
 [3 min read, open as pdf] Inflation is on the rise Easy central bank money, pent up demand after lockdowns and supply-chain constraints mean inflation is on the rise. Will Central Banks be able to keep the lid on inflation? The risk is that it could persistently overshoot target levels. 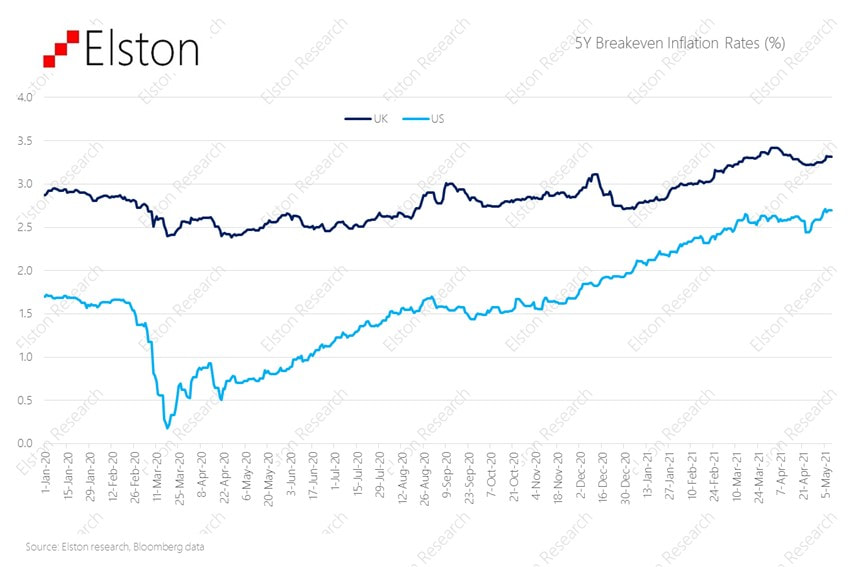 It matters more over time Inflation erodes the real value of money: its “purchasing power”. If inflation was on target (2%), £100,000 in 10 year’s time would be worth only £82,035 in today’s money. But on current expectations, it could be worth a lot less than that. 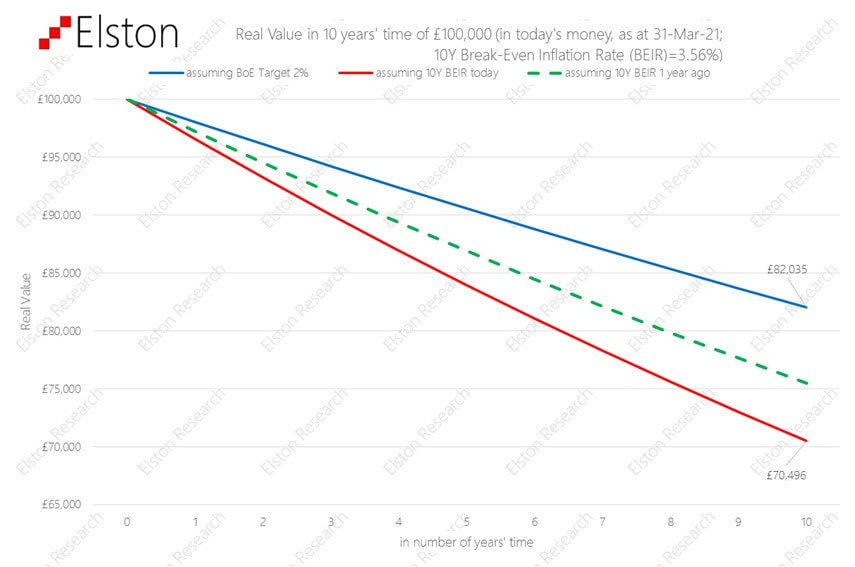 Real assets can help
A bank note is only as valuable as the value printed on it. This is called its “nominal value”. Remember the days when a £5 note went a long way? When inflation rises, money loses its real value. By contrast, real assets are things that have a real intrinsic value over time whose value is set by supply, demand and needs: like copper, timber, gold, oil, and wheat. Real assets can also mean things that produce an regular income which goes up with inflation, like infrastructure companies (pipelines, toll roads, national grid etc) and commercial property with inflation-linked rents. Rethinking portfolio construction Including “real assets” into the mix can help diversify a portfolio, and protect it from inflation. Obviously there are no guarantees it will do so perfectly, but it can be done as a measured approach to help mitigate the effects of inflation. The challenge is how to do this without taking on too much risk. Find out more about our Liquid Real Assets Index  [3 min read, open as pdf]
We look at 1Q21 in review and the outlook ahead. Macro The economic restart will be sudden, with substantial pent up demand. Corporate and personal balance sheets have been supported which should provide confidence in investment and spending. From a monetary policy perspective, the focus remains on the delicate balance between bond yield and inflation. Stable, negative real yields are supportive of risk assets. 10 year breakeven rates have climbed further since year-end amplifying demand for inflation-hedges. With nominal bonds under pressure, there is support for risk-asset. Advisers looking at liquid alternatives to bonds such as property and infrastructure: need to balance the required exposure to inflation-protecting assets with up-risking client portfolios. This balancing act means it’s time to rethink the 60/40 portfolio. Markets The rebound in risk assets is made even more pronounced, owing to a base effect from last year’s market lows. Timber and Listed Private Equity have been the best performing asset classes in GBP terms on a 12 month view. For factor-based strategies, World Equity Value factor outperformed all other factors +12.3%, compared to +3.79% for World Equity, for the first three months of 2021. The breadth and deconcentrating have been rewarded in the first quarter with equal weight US equities returning +11.49%, compared to +6.17% for the traditional cap-weighted S&P500, in USD terms, in the year to March. Regime Regime indicators point to markets being overbought in the near-term. For the full update, please view our Webinar https://www.brighttalk.com/webcast/18493/482564  [3 min read, open as pdf]
A “last resort” policy tool Zero & Negative Interest Rate Policy are Non-Traditional forms of Monetary Policy is a way of Central banks creating a disincentive for banks to hoard capital and get money flowing. Zero Interest Rate Policy (ZIRP) is when Central Banks set their “policy rate” (a target short-term interest rate such as the Fed Funds rate of the Bank of England Base Rate) at, or close to, zero. ZIRP was initiated by Japan in 1999 to combat deflation and stimulate economic recovery after two decades of weak economic growth. Negative Interest Rate Policy (NIRP) is when Central Banks set their policy rate below zero. Japan, Euro Area, Denmark, Sweden are currently using a NIRP. US & UK are currently using a ZIRP, and are considering a NIRP. Fig.1. Advanced economy policy rates 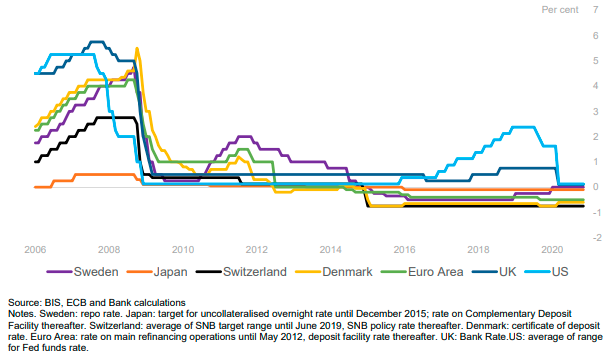 Whilst bond prices may imply negative real yield, or negative nominal yields, a NIRP impacts the rates at which the Central Bank interact with the wholesale banking system and is intended to stimulate economic activity by disincentivising banks to hold cash and get money moving. A NIRP could translate to negative wholesale rates between banks, and negative interest rates on large cash deposits, but not necessarily retail lending rates (e.g. mortgages).
Ready, steady, NIRP Negative Interest Rates were used in the 1970s by Switzerland as an intervention to dampen currency appreciation. . It was the subject of academic studies and was seen as a last resort Non-Traditional Monetary policy during the Financial Crisis of 2008 and during the COVID crisis of 2020. Sweden adopted NIRP in 2009, Denmark in 2012, and Japan & Eurozone in 2014. The Fed started looking closely at NIRP in 2016. According Bank of England MPC minutes of 3rd March 2021, wholesale markets are generally prepared for negative interest rates as have already been operating in a negative yield environment. By contrast, retail banks may need more time to prepare for negative interest rates to consider aspect such as variable mortgage rates. There are arguments for and against NIRP. The main argument for is that NIRP is stimulatory. The main argument against is that NIRP failed to address stagnation and deflation in Japan and can create a “liquidity trap” where corporates hoard capital rather than spend and invest. The hunt for yield With negative interest rates, there will be an even greater hunt for yield. We look at the some of the options that advisers might be invited to consider.
Getting the balance right between additional non-negative income yield and additional downside risk will be key for investors and their advisers when preparing for and reacting to a NIRP environment.  [3 min read, pdf version]
Moderate turnover strategies: Monthly Elson Market Indicator The Monthly EMI ended January 2021 at 62.37 vs 63.12 at end December 2020. For moderate turnover strategies, equity markets continue to look overbought. This drives a preference for lower relative position in risk assets. The Monthly EMI remains above the threshold (60) for a move to a Neutral position in risk assets. Momentum in the VIX Index increased from 50.9 to 54.4, whilst in absolute terms, the VIX Index closed the month at 33.1, compared to 22.8 at previous month end. 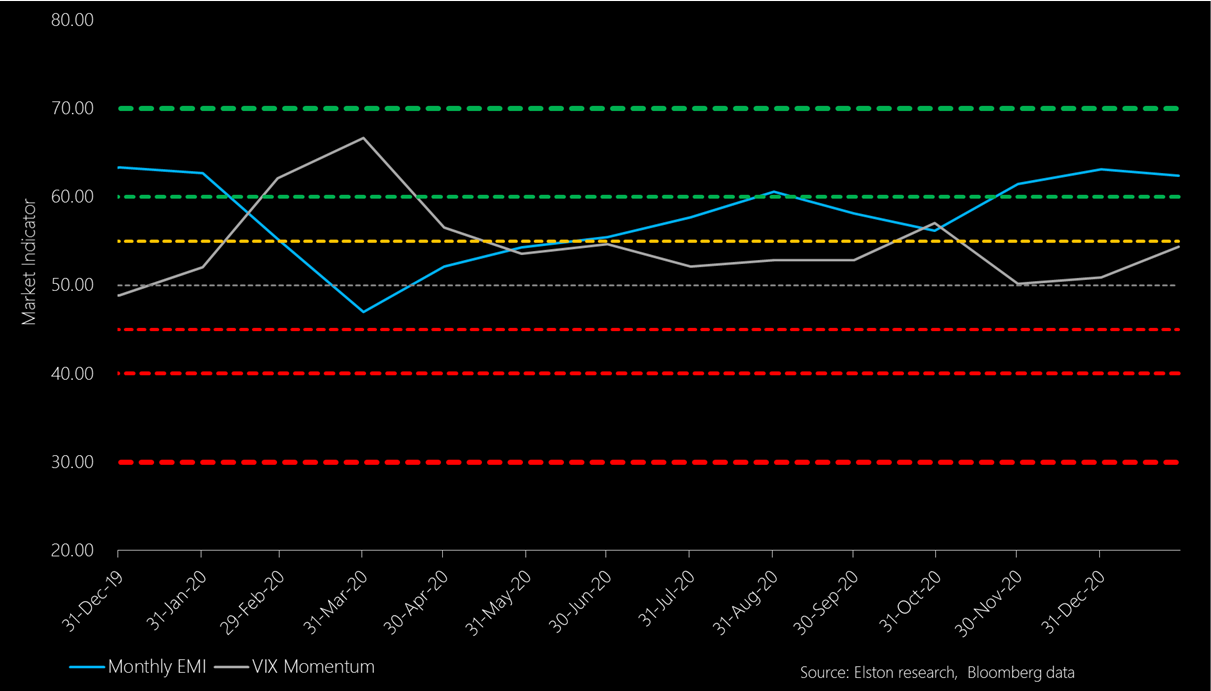 High turnover strategies: Weekly Elston Market Indicator Over the last 4 weeks, the Weekly EMI declined from 63.87 to 59.35, as at last Friday close, falling below the 60 threshold. Momentum in the VIX Index increased from 48.56 to 54.35 over the last 4 weeks. 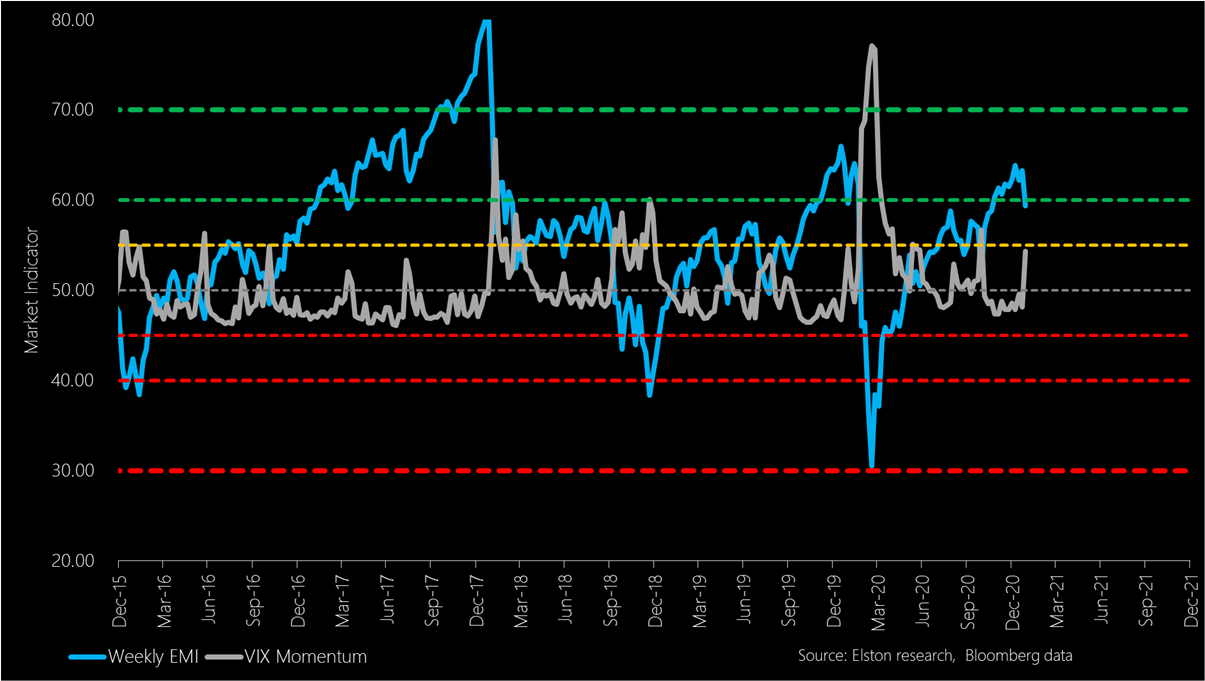  [3 min read, open as pdf]
Growth shock is short and sharp The medium-term outlook for growth points more to a “short sharp shock” rather than a protracted downturn that followed the Global Financial Crisis. However vigilance around economic growth, and ongoing dependency on vaccine rollout, fiscal and monetary policy support remains key. Even lower for even longer interest rates Even lower for even longer interest rates underpins an accommodative strategy to support recovery: but also has created frothiness in some asset classes. Low nominal and negative real yields is forcing investors into refocusing income exposures, but should not lose sight of quality. Inflation in a bottle: for now Inflation caught between growths scare on the downside and supportive policy on the upside. Should inflation outlook increase, nominal bond yields will be under greater pressure and inflation-protective asset class – such as equities, gold infrastructure, and inflation-linked bonds can provide a partial hedge. Trade deal with EU should reduce GBP/USD volatility The 11th hour trade deal concluded in December between the UK and the EU should dampen the polarised behaviour of GBP exchange rate, with scope for moderate appreciation, absent a more severe UK growth shock. Market Indicators: recovery extended Market indicators suggest equities are heading into overbought territory and whilst supported by low rates and bottled inflation, are looking more vulnerable to any deterioration in outlook. Incorporating risk-based diversification that adapts to changing asset class correlations can provide ballast in this respect. 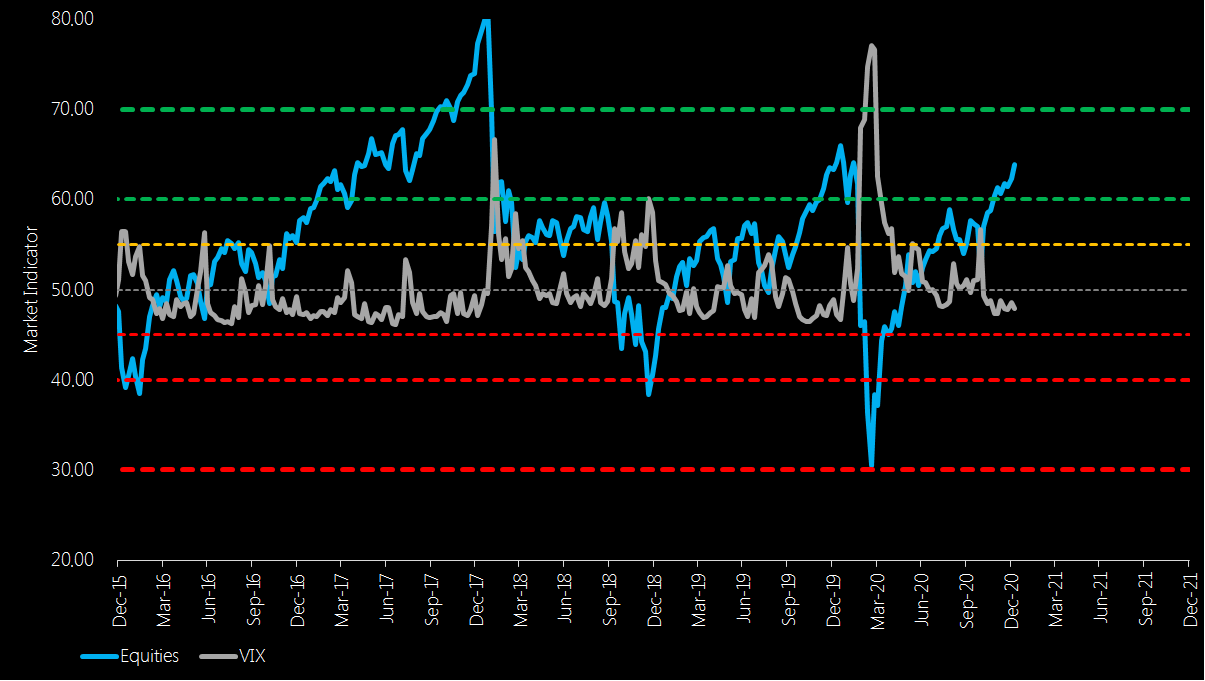 Summary
With respect to 2021 outlook
 [2 min read, open as pdf]
A Factor-based approach to investing Factor-based investing means choosing securities for an inclusion in an index based on what characteristics or factors drive their risk-return behaviour, rather than a particular geography or sector. Just like food can be categorised simply by ingredients, it can also be analysed more scientifically by nutrients. Factors are like the nutrients in an investment portfolio. What are the main factors? There is a realm of academic and empirical study behind the key investment factors, but they can be summarised as follows The different factors can be summarised as follows:
Which has been the strongest performing factor? Momentum has been the best performing factor over the last 5 years. Value has been the worst performing factor. Fig.1. World equity factor performance 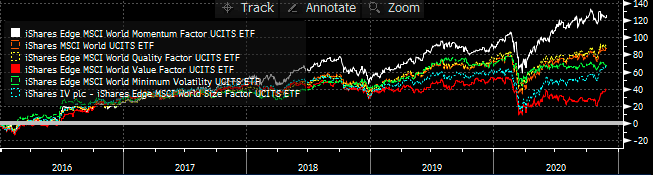 Source: Elston research, Bloomberg data A crowded trade? Data points to Momentum being a “crowded trade”, because of the number of people oerweighting stocks with momentum characteristics. This level of crowdedness can be an indicator of potential drawdowns to come. Fig.2. Momentum Factor is looking increasingly crowded 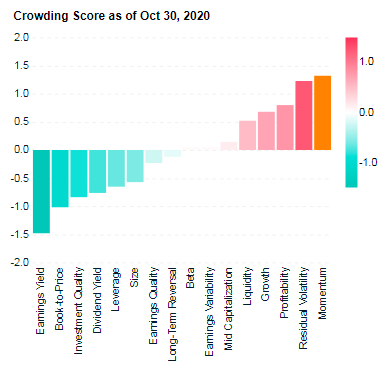 Source: MSCI Factor Crowding Model The best time to buy into a Momentum strategy has been when it is uncrowded – like in 2001 and 2009, which is also true of markets more generally. MSCI’s research suggests that with crowding scores greater than 1 were historically more likely to experience significant drawdowns in performance over subsequent months than factors with lower crowding scores. Fig.3. Factors with higher crowding score can be an indicator of greater potential drawdowns, relative to less crowded factors 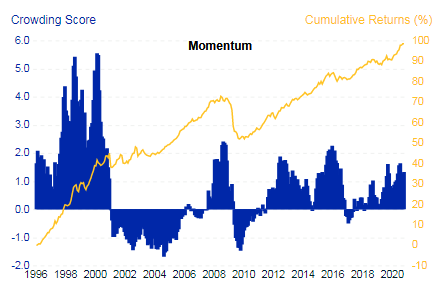 Source: MSCI Factor Crowding Model
Rotation to Value The value-based approach to investing has delivered lack lustre performance in recent times, hence strategists’ calls that there may be a potential “rotation” into Value-oriented strategies in coming months as the post-COVID world normalises. But can factors be timed? Marketing timing, factor timing? Market timing is notoriously difficult. Factor timing is no different. To get round this, a lot of fund providers have offered multi-factor strategies, which allocate to factors either statically or dynamically. Whilst convenient as a catch-all solution, unless factor exposures are dynamically and actively managed, the exposure to all factors in aggregate will be similar to overall market exposure. This has led to a loss of confidence and conviction in statically weighted multi-factor funds. Summary Factors help break down and isolate the core drivers of risk and return.
For more on Factor investing, see https://www.elstonsolutions.co.uk/insights/category/factor-investing https://www.msci.com/factor-investing A local problem? In January, when the Coronavirus story broke in China, the global response was that this was a localised issue. Like other viral outbreaks such as SARS (2003) and H1N1 (2009), the issue look localised to China and Asian Emerging Markets. Going global In February, as the virus spread aggressively in South Korea and Italy, markets woke up to the fact that this was a global issue. The questions being how far would it spread; how fast would it spread; and how long would it last? All of these questions were to ascertain how materially the outbreak would impact global growth, as demand falls, businesses' cash flow struggles and supply chains are disrupted. A false sense of security What was deceptive is that the time from the first infection in a country to the virus "j-curving" has been quite long 20-30 days. This gave Europeans a false sense of security that the outbreak was containtable. The J-Curve The chart below shows the J-curve as to how long it has taken for some key countries to reach 1,000 cases. The reality is that once it gets going, containment is difficult without some of the extreme measures introduced quite promptly in Wuhan (wide area quarantines or "lockdowns"), and more recently in Italy. 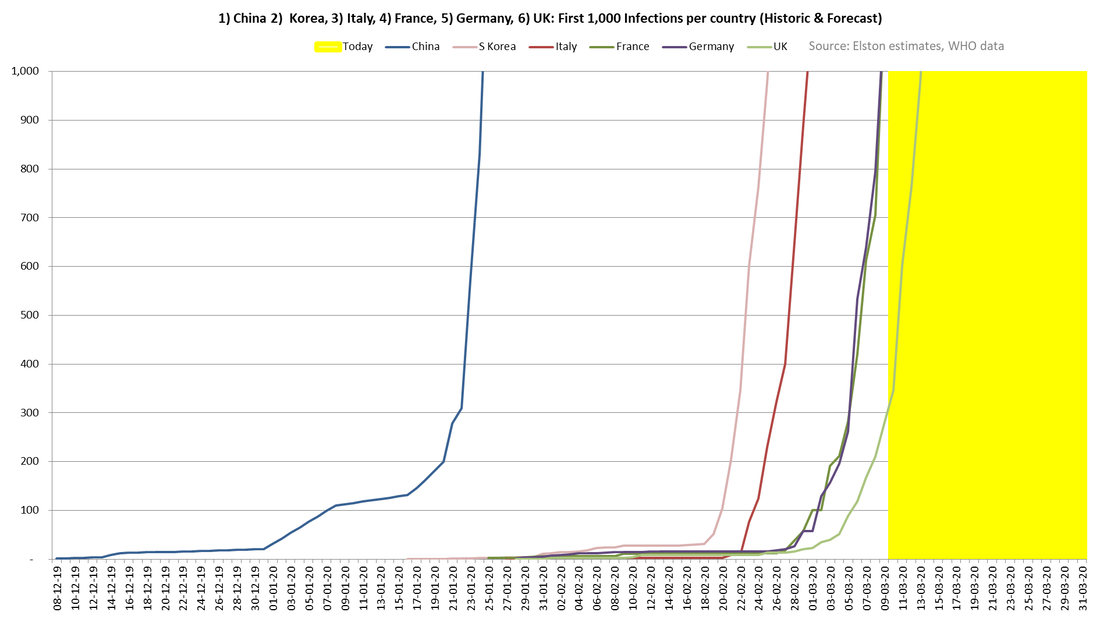 Tracking the J-curve gives helpful cues as to when the UK government might move through the different phases of its response plan to Contain, Delay, and Mitigate the virus' impact undperpinned by Research. On this basis, whilst we are still in the Contain stage, we can expect to move into the Delay stage (closing schools, cancelling large scale gatherings, encouraging working from home) in coming weeks. Economic impact and policy response The economic impact of self-isolation, travel restrictions and lock-down are in addition to the human cost of the virus. That is why we have seen, and expect to continue to see, a co-ordinated economic policy response that supports business, monetary policy and markets. China plateau Meanwhile, in China, where the outbreak started, case numbers have plateaued suggesting that the drastic measures taken have worked, and that it is in aggregate a 2-3 month disruption. 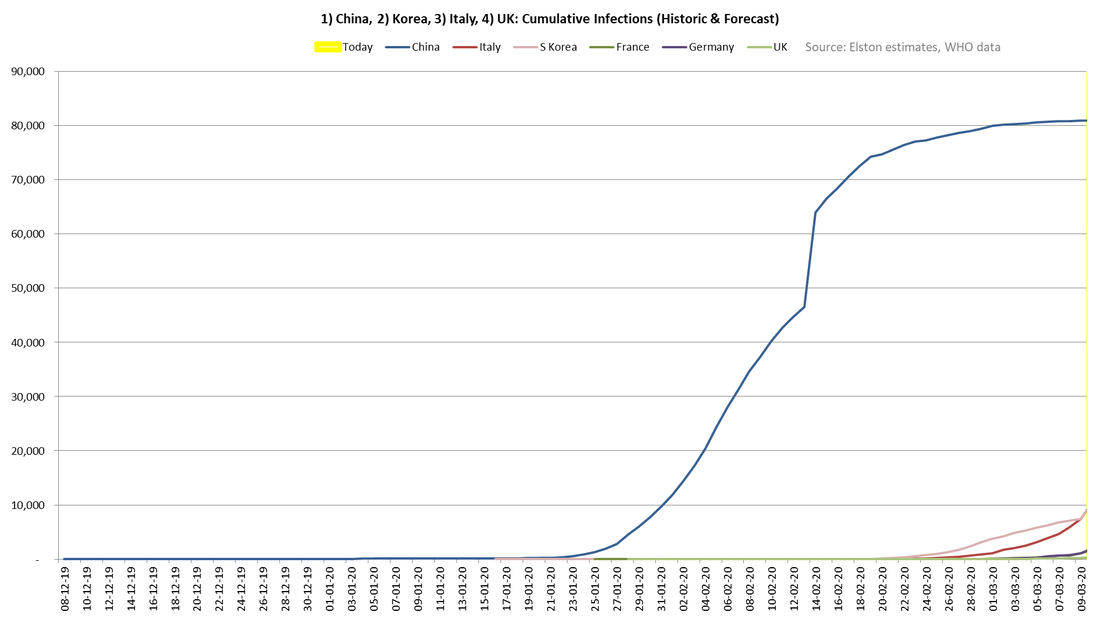 What next?
The next 4-6 weeks will see an acceleration in cases in key European and potentially US markets. So we may not be at "peak panic" yet at a social level, but the key question for markets is will this be a short run (3-6) month impact on otherwise resilient trend growth, or a trigger to a global recession. Our view is the former, but there's more fear to come first.
Conservative majority Conservatives are on track for a winning a clear majority in the UK general election. The campaign has centred on a core message of Get Brexit Done which has appealed to traditional Tories and disgruntled Labour voters in Leave-oriented constituencies. Furthermore, a distrust of Labour’s leadership under a hard-left Corbyn has led to a significant reduction in Labour seats despite his popularity with youth activists. A Brexit election Each party’s position on Brexit has been the key driver for voting intentions, despite efforts by all parties to also focus on domestic policy and leadership personalities. The Conservatives message was to get Brexit done. The Liberal Democrats was to Revoke Article 50, ignore the Referendum result and remain. Labour’s stance was to hold another referendum. Voters, like markets, wanted clarity over “dither and delay”. With a clear majority, and an unambiguous mandate to deliver Brexit, some say that ironically, the bigger the majority, the softer the Brexit as Johnson will not be held hostage by hard-Brexit supporting “ultras” from the European Research Group. Meanwhile, Conservative MPs that have become independents or defected to the Liberal Democrats will vanish into obscurity. Breaking through the “Red Wall” The changing composition of the Conservative win is radical. Whilst some remain-leaning Conservatives voters (and MPs) have shifted allegiance to the Liberal Democrats, constituencies in Labour’s northern heartlands known as the “Red Wall” because they have not had a Conservative MP since the 1930s or 1950s. As predominantly Leave constituencies, voters have “lent” the Conservatives their vote as more trusted to deliver on Brexit after the shambles of a hung Parliament. Strategist vindicated Love him or hate him, the result is a vindication of Johnson’s chief strategist Dominic Cummings who developed Johnson’s core strategy on becoming Prime Minister in July 2019 as “D.U.D.” standing for Deliver Brexit, Unite the Country, Defeat Labour. With the two D’s on track, it will then be for the U and a pivot to a domestic agenda once UK has left the EU on or before 31st January. The Election in 3 Charts 1. Poll tracker Based on an analysis of polling data by the BBC, average voting intentions on 11th December, the day before the election, pointed to 43% support for Conservative, 33% for Labour, and 12% for the Liberal Democrats. Source: BBC 2. Cable Sterling has rallied on exit polls that pointed to a clear Conservative win, with markets encouraged at the prospect at the end of political deadlock, the end of any risk of a hard left Labour government, and the beginning of constructive engagement with the EU to get a comprehensive trade deal in place by December 2020. On becoming PM, Johnson forewarned that “people are going to lose their shirts” by betting against Brexit, using the language of investment managers. For anyone short sterling over the past few weeks, that’s proven absolutely true. 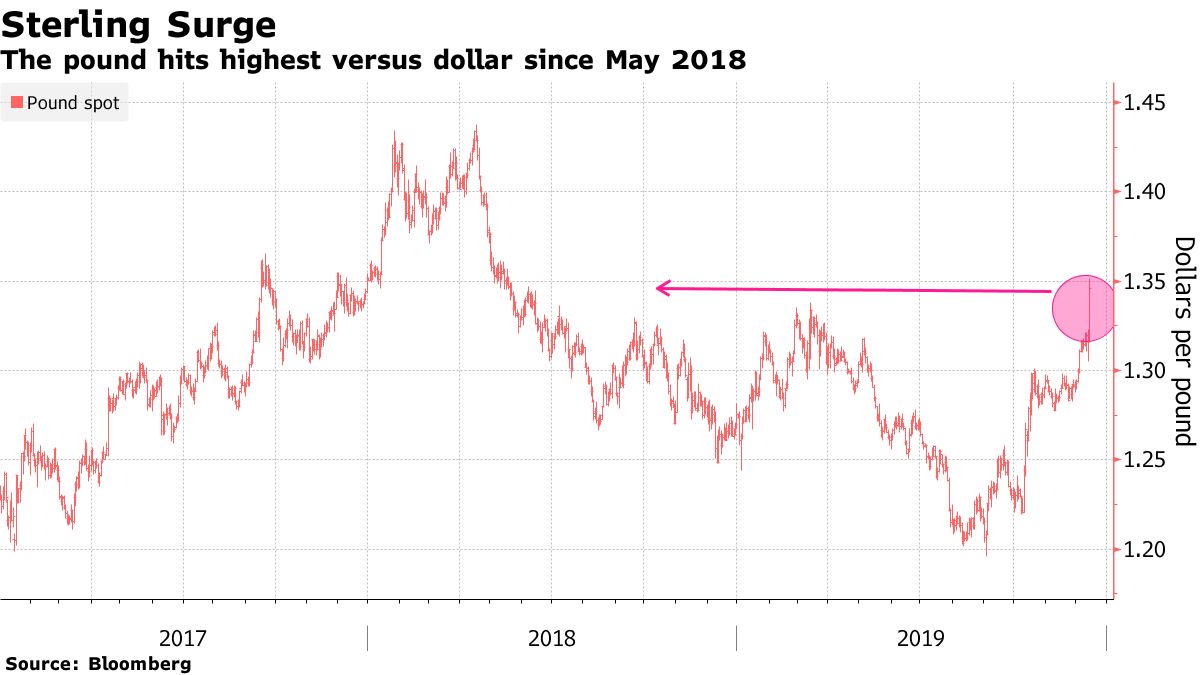 3. ETF Flows focus on UK Small Caps In the three weeks in the run up to the UK election, investors have been positioning for a Conservative win, with a record £151m flowing into the iShares MSCI UK Small Cap UCITS ETF (Ticker: CUKS) that focuses on domestically oriented smaller capitalisation companies. 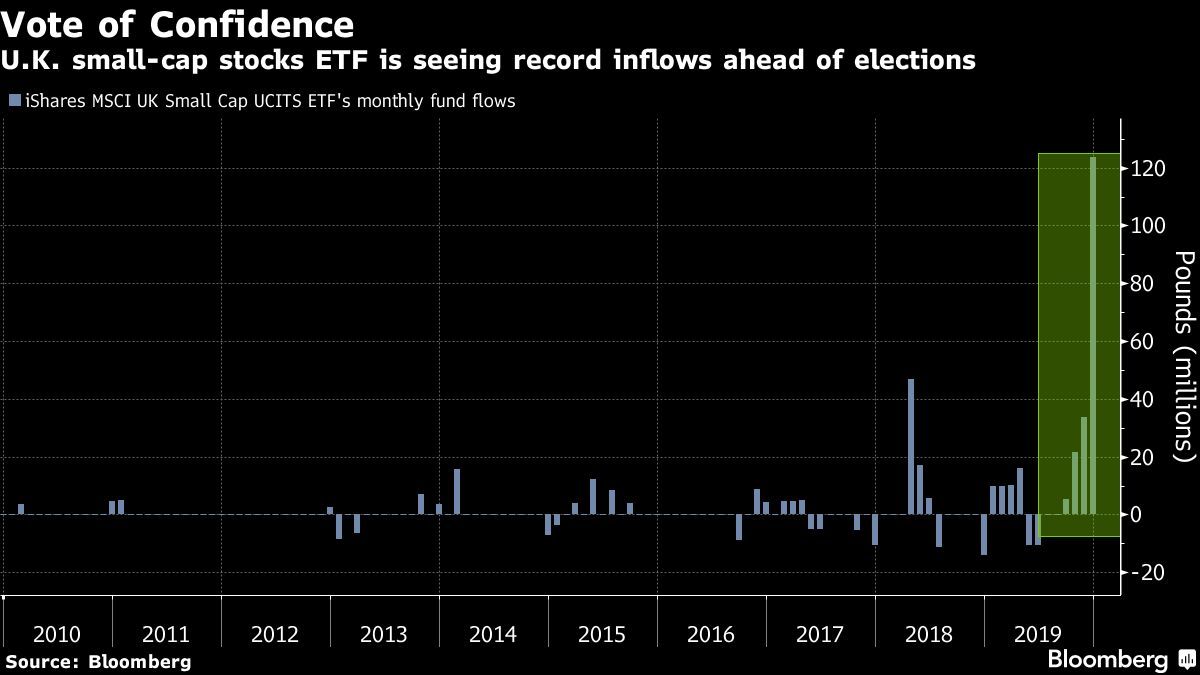 Bottom line
The bottom line is like him or loathe him, Boris Johnson has through force of personality and message discipline won a majority by reaching across tribal party loyalties to secure a clear mandate. We can expect a break-neck parliamentary agenda to deliver Brexit by 31st January 2020, before pivoting to domestic policy issues. At last there will be clarity and focus over the next 5 years, and reduced risk of a hard left Labour. This is good news for the markets, but more importantly good news for the country. [ENDS] Disclosure: I/we have no positions in any stocks mentioned, and no plans to initiate any positions within the next 72 hours. I wrote this article myself, and it expresses my own opinions. I am not receiving compensation for it. I have no business relationship with any company whose stock is mentioned in this article. Additional disclosure: Additional disclosure: This article has been written for a UK audience. Tickers are shown for corresponding and/or similar ETFs prefixed by the relevant exchange code, e.g. “NYSEARCA:” (NYSE Arca Exchange) or “LON:” (London Stock Exchange). For research purposes/market commentary only, does not constitute an investment recommendation or advice, and should not be used or construed as an offer to sell, a solicitation of an offer to buy, or a recommendation for any product. This blog reflects the views of the author and does not necessarily reflect the views of Elston Consulting, its clients or affiliates. For information and disclaimers, please see www.elstonconsulting.co.uk Photo credit: as per specified source; Chart credit: as per specified source; Table credit: as per specified source. All product names, logos, and brands are property of their respective owners. All company, product and service names used in this website are for identification purposes only. Use of these names, logos, and brands does not imply endorsement.
Political context There is certainly going to be continued uncertainty in the run up to the Brexit Hallowe’en. We outline three political scenarios. Hard Brexit: whilst Parliament has successfully passed a law to ensure the Government must apply for an extension if they cannot reach a deal by 31st October, there is still a risk of a Hard Brexit as there is an outside chance that the EU would not win unanimity from the EU27 to agree to grant an extension. 31st October 2019 exit from the EU therefore remains the legal default. Extension: if there is no deal by 31st October, and the UK Government seeks an extension from the EU and it is granted (for example 31st March 2020), then the can has been kicked down the road further, and there will likely be a General Election that will serve as a bitter and contested rerun of the Referendum campaign. That General Election will either result in one of 1) a “Leave” mandate led by a fractured Conservative/Brexit Party, or 2) a “Remain” mandate from a Remain Alliance led by Lib Dems, or 3) a Labour government and second referendum. Last-minute deal: there is an outside chance that the Prime Minister secures a Last-minute deal, that would be largely based on the existing Withdrawal Agreement, but with a Northern-Ireland only backstop. Whilst this would be the ultimate in “government by essay crisis”, it would at least provide resolution to this 3½ year saga, tragedy, comedy or farce (depending on theatrical preference). What about the economy? To gauge the UK economic outlook, we look at three key indicators: Growth, Inflation and Interest Rates. Growth: Despite low levels of unemployment, Brexit uncertainty is weighing on the UK economy with GDP contracting -0.2% in the second quarter. Both manufacturing and service sectors have already shown signs of entering a downturn. The uncertainty around Brexit could slow the growth down even more. The GDP growth for 2019 is still projected at 1.2% by the Bank of England. Inflation: Inflation is close to the Bank of England’s 2% target rate. Although the UK inflation is currently subdued, the expected rate of inflation remained at 3.2% . We estimate expected inflation using the 5 year breakeven rate, the difference between nominal and inflation-linked gilts yields. Put simply, this means that the market is expecting a higher level of inflation over the next five years than at present. Interest Rates: The UK yield curve continued to be flat at the end of 2q19. The spread between 2Y and 10Y bonds decreased further from 27bps to 21bps when compared with last quarter, the smallest gap since 2008. BoE’s chief Mark Carney’s recent speech warning an intensifying global risks added more concerns of a near-term recession. In our view, there is no change to the “lower for longer” outlook for UK interest rates. Asset class positioning In the context of political and economic outlook, what are our views on asset classes? Equities: Within an equity context, our portfolios do not have a domestic bias and are globally diversified, meaning that Brexit has limited impact on global equity risk compared to the bigger issues of the day, namely US-China trade disputes and US interest rate path. For reference, the UK is only about 6% of global equities (when counting both developed and emerging markets). So for globally diversified equity portfolios, Brexit has limited direct impact. Equities are long run return drivers and are exposed to a broad range of currencies in terms of the revenues of the global companies that make up each market. We do not believe that attempting to time the market for short run currency fluctuations, with regards to equity exposure, is worthwhile, and creates additional cost drag. Key question: to hedge or not to hedge However, for UK investors, currency positioning is key. In 2016, advisers that allocated to unhedged global equity exposure, and/or focused on large cap UK equities (e.g. the FTSE100) which have a high proportion of dollar revenues protected their clients from sterling devaluation. Fig.1. World Equity Returns in GBP terms: unhedged vs hedged 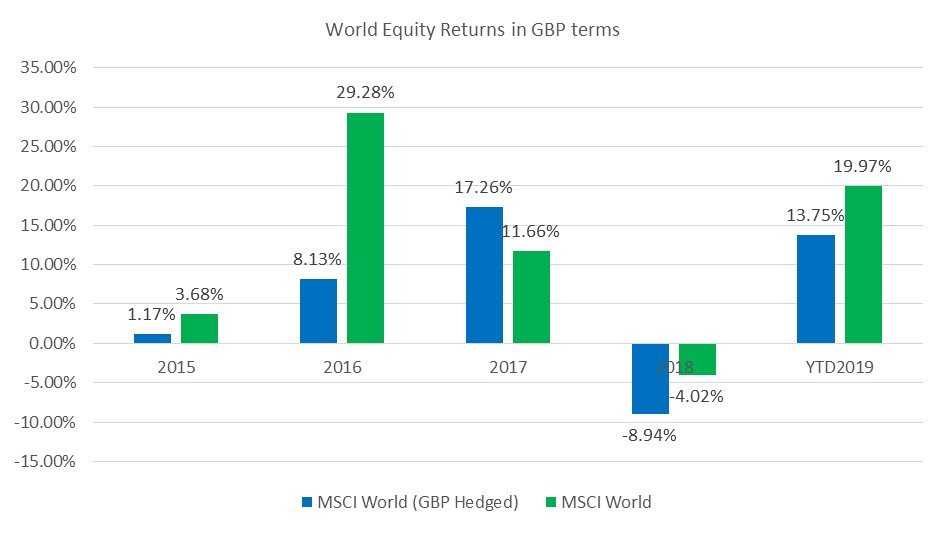 Source: Elston research, Bloomberg data, total returns for respective ETFs. YTD 2019 is to 31-Aug-2019. iShares MSCI World (IWRD) and iShares MSCI World GBP Hedged (IGWD). All performance data in GBP terms. In the event of a no-deal Brexit (legal default), we expect further GBP weakness in which case an unhedged approach continues to make sense. In the event of an extension or a last-minute agreement, we expect GBP to recover towards 1.30 to 1.40 level respectively, in which case a tactical allocation to GBP-hedged global equity exposures would ensure global equity returns are delivered in sterling terms. Fig.2. GBP/USD Spot and potential levels under different scenarios 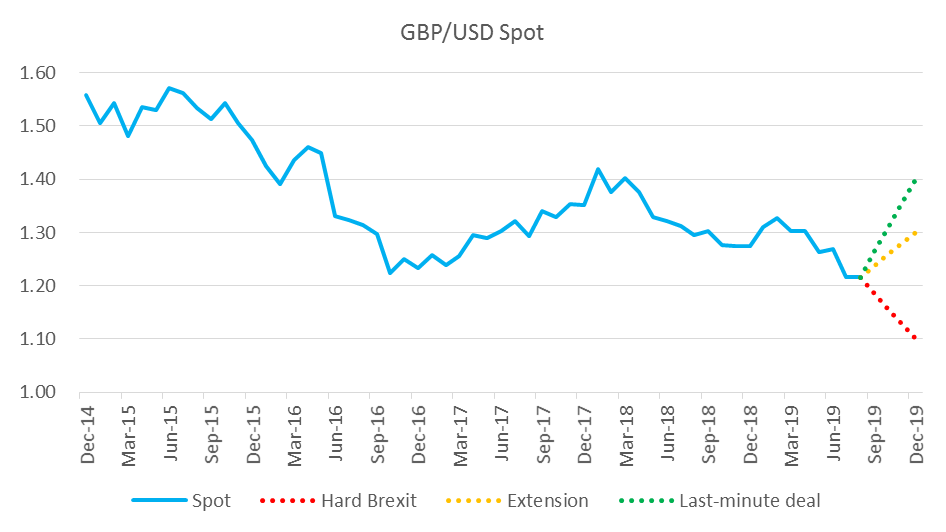 Source: Elston research, Bloomberg data
Bonds: For bonds, most advisers rightly have a bias to domestic bonds for their clients to ensure alignment of client’s income and spending needs, as well as for protection in economic downturns (put simply: typically bond values are higher, when growth and interest rates are lower). We expect UK interest rates to remain lower for longer under all 3 scenarios, whilst inflation remains contained. If we saw risk of higher UK interest rates, we would look at allocating client assets to shorter duration (e.g. <5 year) UK bonds that are less sensitive to changes in interest rates. Alternatives: Property: We like property as a real asset that offers inflation protection. However, we see property as a potentially exposed asset class in the event of a no-deal Brexit. We would be concerned by the risk of reduced economic activity, business relocations and higher vacancies. For this reason our preference is for globally diversified funds that invest in shares of property companies, rather than for UK focused funds that invest in direct assets. Alternatives: Commodities: We like commodities as a diversifier owing to their less correlated relationship with equities and bonds. However as we are late in the cycle, we are cautious commodities. However we see Gold as a traditional defensive asset in uncertain times, and note the risk of sustained upward pressure on oil prices amidst geopolitical tensions in the Middle East. 
Positioning for a GBP recovery? With Brexit doom and gloom mostly priced in, all eyes are on sterling which has become the Brexit barometer. So which way for sterling? Stating the obvious:
In the event of a relief rally in GBP, how can investors position portfolios accordingly? Translation effect Recall that the GBP currency impact on portfolios in 2016 was massive. As GBP depreciated, investors whose global equity portfolios were unhedged enjoyed strong performance thanks to the translation effect of foreign earnings. The same applied to FTSE 100 which looked stronger against a weakening GBP. The reverse would also therefore be true. Any significant appreciation in GBP would see (foreign) global equity returns offset by GBP strength and would weigh on the FTSE 100. So for those who were lucky enough to be unhedged as sterling fell can’t rely on luck if sterling rises. Toolkit for GBP recovery Like everyone else, we have no crystal ball as to how Brexit could play out, but we can identify some of the tools that investors may want to have in their armoury to implement their views, whatever their risk posture, in case of a GBP recovery. We look a selection of exchange traded products to access currency pairs, ultrashort bonds, shorter duration bond and GBP hedged equities to implement a tactical position for different risk levels. 1. Short-term currency exposure On the approach to and in the event of any deal, for very short term exposure (<1 month), investors could consider gaining rapid currency exposure by using a currency pair ETC and if seeking additional risk could use a leveraged exposure. Leveraged exposures should be short-term in nature and investors should ensure they understand the risks. Currency pairs GBPP: ETFS Long GBP Short USD LGB3: ETFS 3x Long GBP Short USD 2. Volatility dampener Investors can tactically allocate to ultrashort GBP bonds if they are looking for a cash-like volatility buffer with more yield than cash with a GBP return profile. Ultrashort duration Bonds ERNS: iShares GBP Ultrashort Bond ETF JGST: JP Morgan GBP Ultra-Short Income UCITS ETF 3. Short duration bond exposure Tactical allocations to short duration GBP bond exposures is available both for UK gilts and GBP corporate bonds for investors seeking GBP bond exposure without being over-exposed to interest rate risk from the longer-duration nature of the main indices. Short duration Gilts IGSL: iShares UK Gilts 0-5yr UCITS ETF GLTS: SPDR® Bloomberg Barclays 0-5 Year Sterling Corporate Bond UCITS ETF Short duration GBP Corporate Bonds IS15: iShares £ Corp Bond 0-5yr UCITS ETF SUKC: SPDR® Bloomberg Barclays 0-5 Year Sterling Corporate Bond UCITS ETF 4. Equities hedged to GBP To access equities hedged to GBP, rather than running a currency overlay, investors can access GBP hedged versions of mainstream ETFs. At 29-30bp TER, these are slightly more expensive than their conventional versions, but the cost difference represents the cost and convenience of running the currency overlay. Most regional equity ETF exposures offer GBP hedged versions, or investors can use ETFs tracking MSCI World (GBP hedged) as a proxy for risk assets. For example: Global equities (GBP hedged) IWDG: iShares Core MSCI World UCITS ETF GBP Hedged XDWG: Xtrackers MSCI World UCITS ETF 2D – GBP Hedged Conclusion Whilst no deal is supposedly ruled out, there is no certainty as to what any deal would look like. Whatever the politics, if you believe there is potential for a recovery in sterling, ETPs provide tactical ways of positioning portfolios accordingly. The absence of a clearly defined plan for Brexit is creating damaging uncertainty for businesses and the markets.
Leaving the EU, but remaining in the EEA through EFTA would address the concerns of the majority of Referendum voters, whilst also requiring a spirit of compromise from both sides. Joining EFTA would immediately provide the UK with continued free trade within the EU/EEA, a more valuable set of external Free Trade Agreements, and the added flexibility to negotiate its own free trade deals bilaterally. Setting a timetable for re-joining EFTA provides a straightforward solution that will give the necessary confidence and direction to businesses and the markets whilst respecting the outcome of the EU Referendum. This paper, drafted for but not published by the Centre for Policy Studies in July 2016, sets out the rationale for Britain in EFTA or "BREFTA" and calls for greater engagement with the "C10": the largest ten Commonwealth economies.  We certainly live in interesting times. At the time of writing, nobody knows what’s happening with Brexit. Will a deal be reached to prevent a disorderly exit? Either way, what will be the impact on the UK and European economies? And how will markets respond?
In the circumstances, it’s understandable that many investors are considering reducing their exposure to equities until things become clearer. Investing is a hugely personal matter, and nobody should take more risk than they’re comfortable taking. However, going to cash is not a decision that should be taken lightly, without serious thought or without seeking the opinion of a competent financial adviser. Regardless of Brexit, there’s a very strong case for keeping your portfolio exactly as it is. So, if you’re thinking of sitting in cash while events unfold in Brussels, here are ten things need you need to bear in mind. 1. Timing the market is notoriously difficult. The evidence shows that it’s almost impossible to do it accurately with any long-term consistency, and the professionals are little better at it than the rest if us. And remember, you have to be right twice; you might get out at the “right” time and then spoilt it all by mis-timing your re-entry. 2. All known information is already incorporated into market prices. Current valuations reflect everything we know about Brexit and the likelihood of all the different outcomes. Do you honestly know something about Brexit that the rest of the market doesn’t? 3. It’s new information that causes prices to rise or fall, and that by its nature, is unknowable. True, government ministers and officials involved in the negotiations may be privy to vital information, but they’re bound by insider trading regulations so can’t act on it anyway. 4. New information is incorporated into prices within seconds, even milliseconds. If there is a significant development over the coming months, it will be absorbed so quickly by the markets that by the time you get to act on it, prices will either have risen or fallen already. 5. Correctly predicting the outcome of the Brexit negotiations won’t, in itself, be of help — unless of course you bet on it. To profit on the financial markets, what you need to do is predict how those markets will respond to the outcome you’re expecting, which is extremely hard to do. 6. Markets often react to big political events in unexpected ways. When an event is widely considered to be negative, markets often wobble initially but then recover and resume the course that they were already on. That’s exactly what happened after the Brexit referendum in 2016 and Donald Trump’s election later that year. 7. Investors typically allow their own political views to influence their investment decisions. Because most of us are prone to confirmation bias and to negativity bias to some extent, our expectations of what will happen if things either go our way or don’t go our way tend to be exaggerated. 8. The idea that there will soon be clarity over Brexit and markets will “return to normal” is unrealistic. It may well be that a deal is reached soon that takes Britain out of the European Union. But, as everyone knows by now, the divorce will be hugely complicated, and it may take many years, decades even, before the lasting effects of Brexit are clear. 9. Important though it is, Brexit isn’t the only show in town. There’s uncertainty everywhere you look, whether it’s the future of President Trump, the prospect of a global trade war or rising tensions between Russia and the West. And those are just the obvious risks. Regardless of whether the UK strikes a win-win deal with the EU that pleases everyone, or there’s a painful, disorderly exit, markets could still fall or rise sharply for a completely different reason. 10. There will always be reasons to bail out of equities. Throughout the long bull run that began in 2009, there’ve been scores of plausible arguments for getting out while the going’s good. If you had heeded any of them, you would have missed out on gains. Will it be Brexit that finally brings the bull market crashing to a halt? The bottom line is that nobody knows. Again, you have to do what you think is right, and only time will tell what the “right” decision proves to be. Whatever you do, though, beware of acting on emotions. Assuming that you and your adviser are comfortable with the risk you’re taking, and that your portfolio is thoroughly diversified and has relatively recently been rebalanced, the rational response is to sit tight and watch the political drama unfold.
A well flagged correction There was near consensus amongst investment managers in their 2018 outlook as regards the risk of a market correction. Equity markets had climbed relentlessly higher in 2017 with little red ink and eerily low volatility. The fact that equity volatility had converged with bond volatility illustrates the limitations of an asset-based approach to diversified multi-asset investing. Of course, it was not to last. It was a question of “when, not if” equity volatility mean reverted. And now we at least know when “when” was. Fig.1 VIX spikes as equity volatility comes back into play. 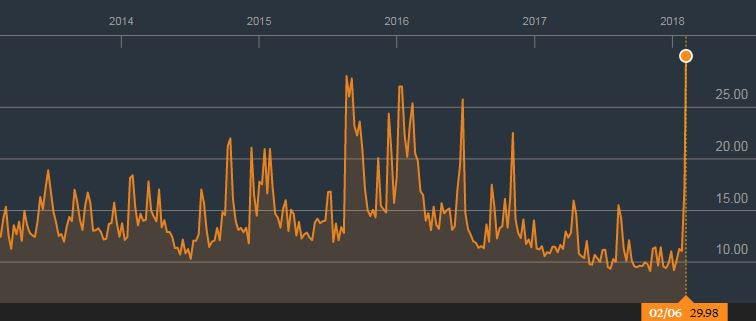 Source: Bloomberg.com What was the trigger? A potential trigger was identified as above-expected inflation trends, leading to increased expectations of monetary tightening. And so it was. Higher than expected wage growth forced a reassessment of inflation outlook, creating expectations of additional Fed tightening. What happens next? A correction enables portfolio managers to consider a fresh look at portfolios.
What is risk-based diversification? In periods of market stress (when the VIX index spikes), correlations between asset classes tend to increase in the short-run, thereby reducing the diversifying power of a traditional asset-based approach. A risk-based approach means that allocations to asset classes are not driven by their label but to their realised risk, return and correlation characteristics. This means that genuine diversification can be delivered using a mathematical risk-based approach, rather than relying on labels alone. Accessing risk-based diversification US portfolio managers can consider the S&P 500 Managed Risk Index (SPXMR Index), which dynamically allocated between the S&P500 index and cash, whilst maintaining a constant allocation to bonds to deliver a risk parity multi-asset portfolio. This index is tracked by the DeltaShares® S&P 500® Managed Risk ETF (NYSEARCA:DRML). UK portfolio managers can consider the Elston Minimum Volatility Index (ESBGMV Index), which dynamically allocates across asset class to deliver a minimum variance multi-asset portfolio. This index is tracked by Commerzbank Elston Multi-Asset Minimum Volatility Certificate (Bloomberg: COSP867<Go>, professional investors only) Fig.2 ESBGMV Index 12 month rolling volatility for index and asset classes 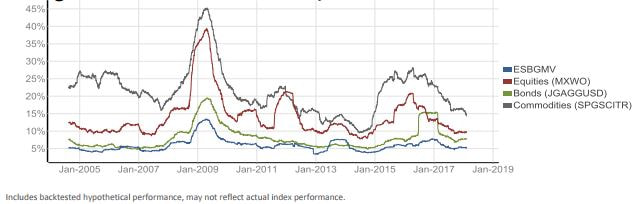 Source: Elston website, ESBGMV index factsheet as at 6/Feb/18
References: http://www.spindices.com/indices/strategy/sp-500-managed-risk-index https://www.deltashares.com/products/sp-500/overview/ http://www.elstonconsulting.co.uk/factsheets.html https://www.bloomberg.com/news/articles/2018-02-02/u-s-added-200-000-jobs-in-january-wages-rise-most-since-2009 [ENDS] Disclosure: I/we have no positions in any stocks mentioned, and no plans to initiate any positions within the next 72 hours. Business relationship disclosure: The Elston Minimum Volatility Index is licensed to Commerzbank for the creation of investable certificates (professional investors only). Additional disclosure: This article has been written for a US and UK audience. Tickers are shown for corresponding and/or similar ETFs prefixed by the relevant exchange code, e.g. “NYSEARCA:” (NYSE Arca Exchange) for US readers; “LON:” (London Stock Exchange) for UK readers. For research purposes/market commentary only, does not constitute an investment recommendation or advice, and should not be used or construed as an offer to sell, a solicitation of an offer to buy, or a recommendation for any product. This blog reflects the views of the author and does not necessarily reflect the views of Elston Consulting, its clients or affiliates. For information and disclaimers, please see www.elstonconsulting.co.uk Photo credit: as per specified source; Chart credit: as per specified source; Table credit: as per specified source. All product names, logos, and brands are property of their respective owners. All company, product and service names used in this website are for identification purposes only.  Confidence that UK equities having "made up lost ground" post-Brexit is misplaced. The largest UK companies that make up the bulk of the FTSE 100 and the MSCI UK Index have high exposure to global earnings. Apparent "strength" in the largest UK equities is just a translation effect of that revenue exposure. So the apparent uptick in UK equities offers no real comfort for global USD-based investors. For GBP-denominated ETFs tracking MSCI UK Equity (e.g. LSE:CSUK) performance is +3.7% since the EU Referendum Day 23rd June 2016 before votes were counted. Over the same period, the USD version of the same ETF (e.g. NYSEARCA:EWU) performance is -9.3% while sterling has weakened -12.4% (FXB). Fig.1 Performance of MSCI UK (LSE:CSUK) in GBP since EU Referendum 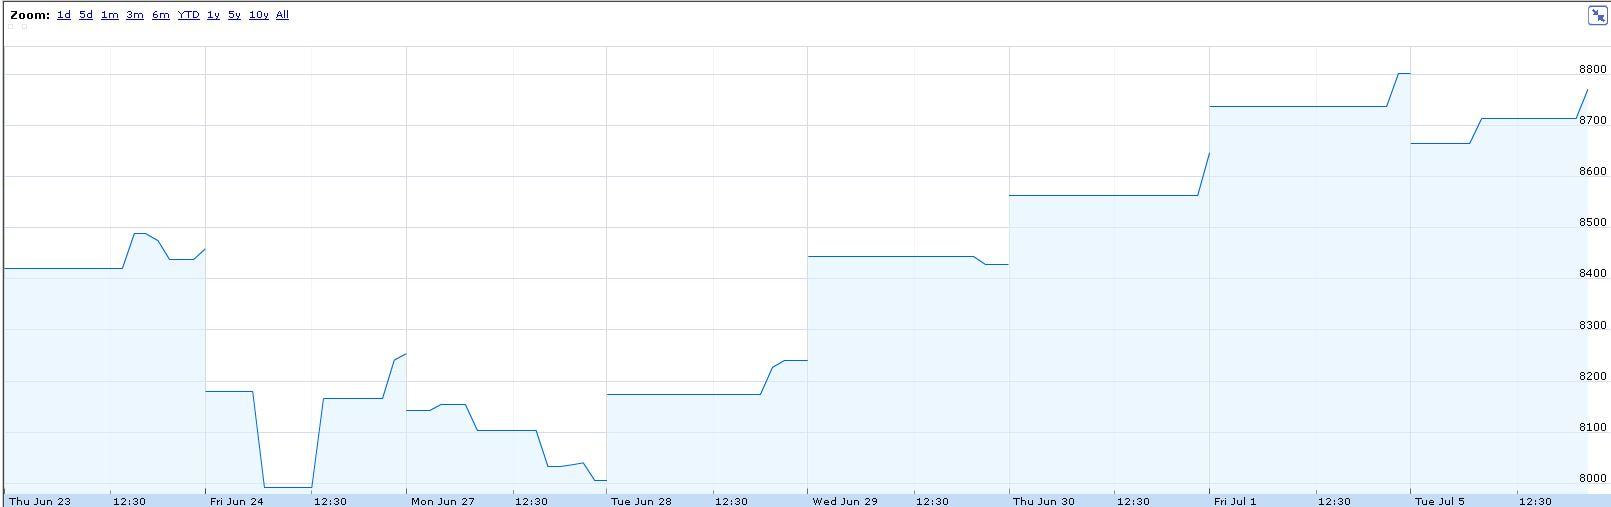 Fig.2 Performance of MSCI UK (EWU) in USD since EU Referendum 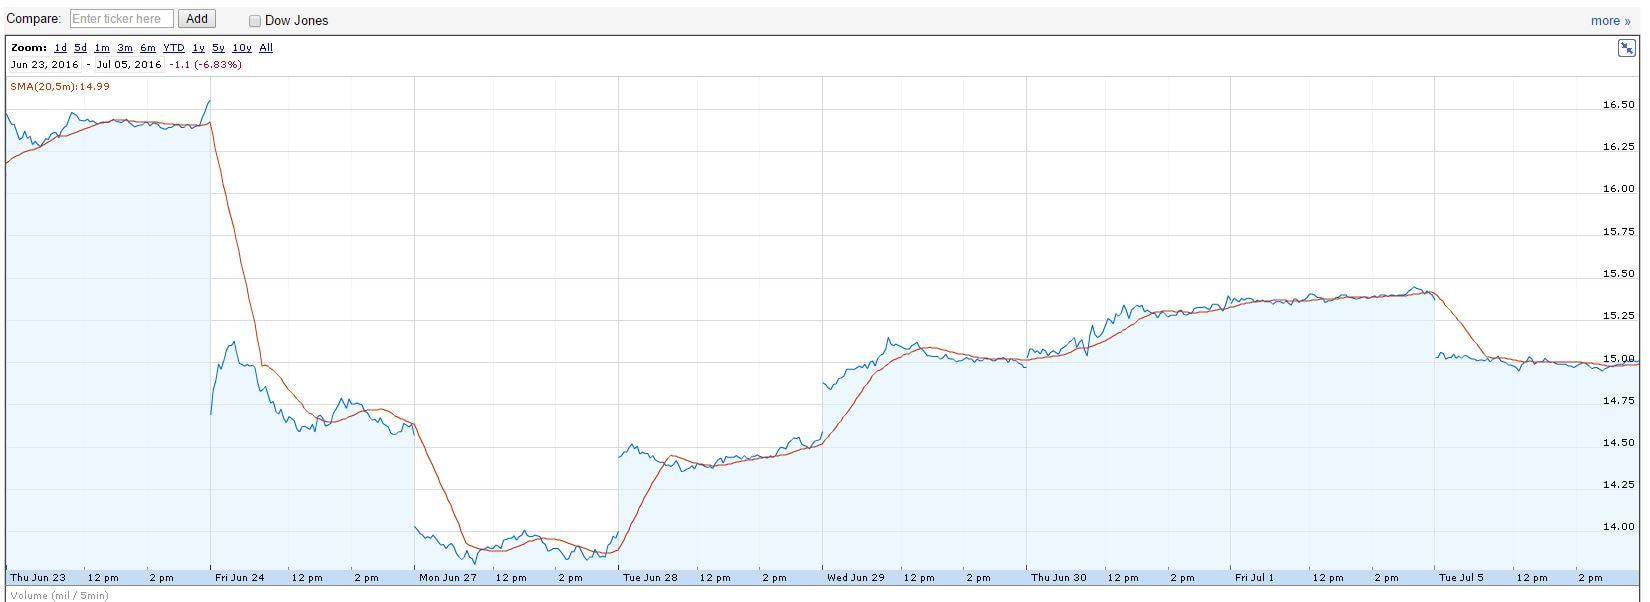 Chart Source: Google Finance
Growth estimates cut UK GDP’s growth rate has been downgraded relative to pre-referendum expectations, with a cut from 2.2% to 1.4% for 2017E and from 2.1% to 1.7% for 2018E. 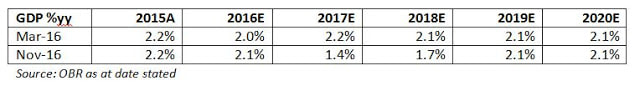 Inflation estimates raised Following post-referendum sterling weakness, estimates for UK inflation were increased from 1.6% to 2.3% for 2017E and from 2.0% to 2.5% for 2018E. This compares to 2.4% and 2.8% for 2017E and 2018E respectively for UK swap breakeven rates. 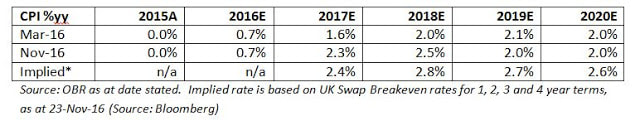 Rising interest rate environment With higher inflation expectations there is upward pressure on Bank Rates after a protracted “lower for longer” regime. 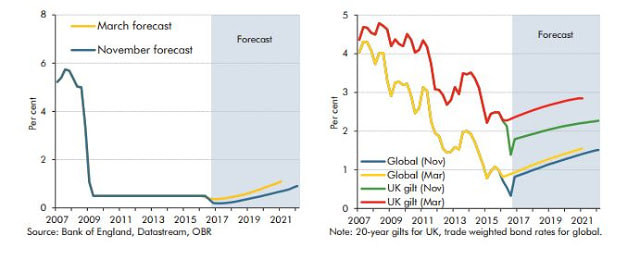 Spending focus: infrastructure and innovation
The government spending plans shows clearly defined cous – with budget to increase infrastructure spending from 0.8% of GDP today to 1.0-1.2% from 2020. This supply side stimulus that focuses on productivity gains is welcome if fiscally manageable. NOTICES: I/we have no positions in any stocks mentioned, and no plans to initiate any positions within the next 72 hours. I wrote this article myself, and it expresses my own opinions. I am not receiving compensation for it. This article has been written for a US and UK audience. Tickers are shown for corresponding and/or similar ETFs prefixed by the relevant exchange code, e.g. “NYSEARCA:” (NYSE Arca Exchange) for US readers; “LON:” (London Stock Exchange) for UK readers. For research purposes/market commentary only, does not constitute an investment recommendation or advice, and should not be used or construed as an offer to sell, a solicitation of an offer to buy, or a recommendation for any product. This blog reflects the views of the author and does not necessarily reflect the views of Elston Consulting, its clients or affiliates. For information and disclaimers, please see www.elstonconsulting.co.uk Photo credit: www.gov.uk; Chart credit: OBR; Table credit: OBR Data, Bloomberg 
Voting results Trump swept to victory with 42 of 50 states declared, Trump leads Clinton 244 electoral votes to 215, with 26 to win, collecting 48.2% of the vote vs Clinton 47.1% (as at 0630 GMT today). The result with 46 of 50 states declared gives a Trump win of 278 electoral votes to 218, with 48.0% of the Vote vs Clinton 47.3% (as at Trump acceptance speech). Impact EQUITIES: expect US equities (NYSEARCA:SPX; LON:CSPX) and global equities (NYSEARCA:ACWI; LON:SSAC) to be volatile, with emerging markets (NYSEARCA:EEM; LON:IEEM) to be negatively impacted, particularly Mexico (NYSEARCA:EWW; LON:CMXC). From a sector perspective expect a positive reaction for financials (NYSEARCA:XLF; LON:SXLF), healthcare (NYSEARCA:XLV; LON:SXLV) and US infrastructure/utilities (NYSEARCA:XLU; LON:SXLU). BONDS: expect near-term flight to safety driving government bond (NYSEARCA:TLT; LON:IGLO) yields down and prices up. ALTERNATIVES: Expect flight to safety to drive relative outperformance in gold (NYSEARCA:SGOL; LON:GBS) and precious metals (NYSEARCA:GLTR; LON:AIGP), oil (NYSEARCA:IEO; LON:SPOG) as well as copper (NYSEARCA:JJC; LON:COPA). CURRENCY: expect USD short-term weakness vs GBP, CHF and JPY. Why pollsters got it wrong? The result compares to pre-election polls of Clinton 46.8%, Trump 43.6%. Pollsters got it wrong for two reasons 1) voter turnout amongst disaffected voters was higher so mix of voters in sample size is no longer indicative, and 2) “secret Trumpers” – voters who may not admit to voting for Trump in polls, but did. 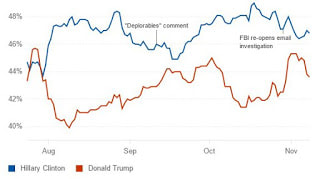 Source: RealClearPolitics Why Bookies got it wrong? By analysing political spread-betting odds, it is possible to derive an implied probability figure for the respective candidates. On the night before election, these gave Clinton an implied 84% probability of success and Trump 16%. As results started coming in, the implied probability for Trump spiked to close at 97% before betting closed. The probabilities were so wrong because a market-derived estimate is only as good as the aggregate views of the market participants betting against each other. And given spread-betting is more a past-time for affluent city types, rather than Trump’s core supporters, it is, like Brexit, liable to the same “groupthink” effect which makes it impossible for them to fathom that anyone would vote for Trump, because they over-estimate the size and influence of their “group”. 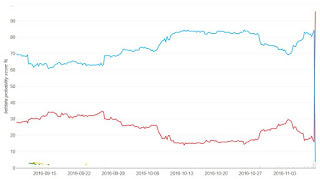 Source: betdata
What next? The risks to a Trump victory were asymmetrical on the downside to a Clinton victory on the upside – and markets will react accordingly. The next few weeks will set the tone of the new President’s administration. It will soon become clear whether or not the toxicity of this campaign will subside in favour of pragmatic policy focus, now that the election is over. Personalities aside, with the new administration, markets need to assess is the outlook for 1) Growth and earnings; 2) inflation and interest rates; and 3) employment and trade. So once the dust settles, and the ticker tape is swept up, the focus will shift policy in Trump’s first 100 days and, more imminently, the Fed’s rate decision in December. NOTICES: I/we have no positions in any stocks mentioned, and no plans to initiate any positions within the next 72 hours. I wrote this article myself, and it expresses my own opinions. I am not receiving compensation for it. This article has been written for a US and UK audience. Tickers are shown for corresponding and/or similar ETFs prefixed by the relevant exchange code, e.g. “NYSEARCA:” (NYSE Arca Exchange) for US readers; “LON:” (London Stock Exchange) for UK readers. For research purposes/market commentary only, does not constitute an investment recommendation or advice, and should not be used or construed as an offer to sell, a solicitation of an offer to buy, or a recommendation for any product. This blog reflects the views of the author and does not necessarily reflect the views of Elston Consulting, its clients or affiliates. For information and disclaimers, please see www.elstonconsulting.co.uk Photo credit: Google; Chart credit: RealClearPolitics, betdata; Table credit: N/A
Who’s right? Given Referendums are only advisory in nature, and sovereignty rests with Parliament alone, the case had merit. And yesterday’s ruling in the High Court, the three ruling Judges agreed. The challengers maintain they are not contesting the referendum results, they just want legal process to be upheld. Others suspect the campaign is partisan, but even if so, the case still deserves to be heard. Parliamentary approval was required on the way in to Europe. It should be required on the way out. Rather than backing the down, the Government is taking the ruling to the Supreme Court in an attempt to get its way. By digging in deeper they are potentially compounding the error of not calling an election the moment that May was anointed Prime Minister. The fine line While in the summer the new Cabinet felt it was riding high on the momentum of populist support, there is a fine line between democracy and demagoguery. Had the Brexiteers had a clear plan for what happens next, there would not be a feeling of rushing headfirst into the unknown. As winter approaches, the need for a cool tempered defence of the sovereignty of Parliament is hard for even the most committed Brexiteers to deny: particularly as sovereignty was at the heart of the Leave campaign. Where’s the mandate? The Conservative government had the referendum in their electoral mandate. But not the mandate to act on its results. Nor did the country vote for May to be Prime Minister May. She should tread carefully. Borrowed time This leaves Prime Minister May with two unpalatable choices: Either to call a snap election (she should have done this when she won the leadership contest) to confirm her mandate as leader and the mandate to trigger Article 50 Or to try to brush the inconvenient constitutional truth of Parliamentary approval by taking it to the Supreme Court. Who’s afraid of an election? The new Cabinet is scared of an election. It could sweep them out of power and could push back further the decisive moment at which Article 50 is triggered as a new government reviews the position. The toxicity in Westminster between Conservative factions means that the political body count of MPs with reputations smashed or jobs lost will continue to grow. That is making the cabinet increasingly desperate. And desperate politicians make bad choices. Bottom line Chances are this Cabinet will fall apart before Article 50 gets triggered, either through extended legal wrangling in the Supreme Court (not a pretty site) or in an attempt to win a mandate by calling an election. With their parliamentary majority so slim, and the dramatis personae so different there is no guarantee they would win. [ENDS] NOTICES: I/we have no positions in any stocks mentioned, and no plans to initiate any positions within the next 72 hours. I wrote this article myself, and it expresses my own opinions. I am not receiving compensation for it. This article has been written for a UK audience. For research purposes/market commentary only, does not constitute an investment recommendation or advice, and should not be used or construed as an offer to sell, a solicitation of an offer to buy, or a recommendation for any product. This blog reflects the views of the author and does not necessarily reflect the views of Elston Consulting, its clients or affiliates. For information and disclaimers, please see www.elstonconsulting.co.uk Image credit: clipart.co; Chart credit: N/A; Table credit: N/A October saw a sharp one month loss for global sovereigns owing to inflation fears, raised interest rate expectations and declining Central Bank appetite for QE. In the US, prospects of a December Fed Rate hike saw 10 year yields clime 30bp on month and 76bp from summer lows to 1.26%, whilst stronger growth numbers raised inflation expectations and positive performance for TIPS. The USD performance for inflation-linked treasuries was -0.33% (LSE:ITPS), compared to for -1.32% (LON:IBTM) for conventional treasuries. In the EU, fears over the ECB’s commitment to QE contributed to the sell off. The EUR performance for inflation-linked Euro government bonds (LSE:IBCI) was -1.78%, compared to for -2.14% for conventional Euro government bonds (LSE:IEGA). In the UK, the inflationary potential from Brexit, and vanishing expectations of any further BoE rate cuts on stronger economic growth led to a gilts sell off. The GBP performance for inflation-linked gilts (LSE:INXG) was -0.65%, compared to -3.92% for (LSE:IGLT) for conventional gilts. 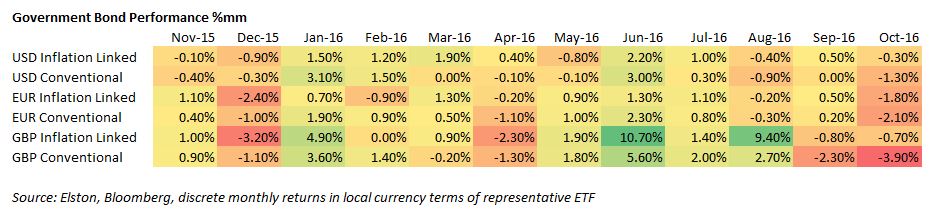 Inflation The Bank of England has raised its 2017 inflation estimate to 2.7%, from the current rate of 1%. The Bank does not expect inflation to return to its 2% target until 2020. The rise in inflation expectations was explained by the decline in the pound since the EU referendum, which is driving up prices of imported goods. Fig 1. Projections for UK CPI based on market interest rate expectations 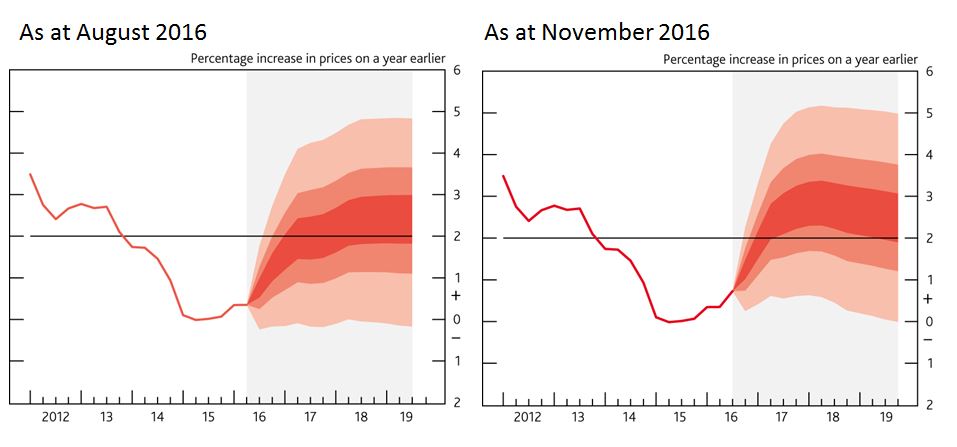 Source: http://www.bankofengland.co.uk/publications/Pages/inflationreport/2016/nov.aspx Growth The economic growth rate forecast was also raised from 0.8% to 1.4% for 2017, whilst expectations were cut for 2018 from 1.8% to 1.5%, signalling that the Brexit impact will be felt later than originally expected. Further interest rates considered in August have been clearly ruled out. Fig 2. Projections for UK GDP based on market interest rate expectations 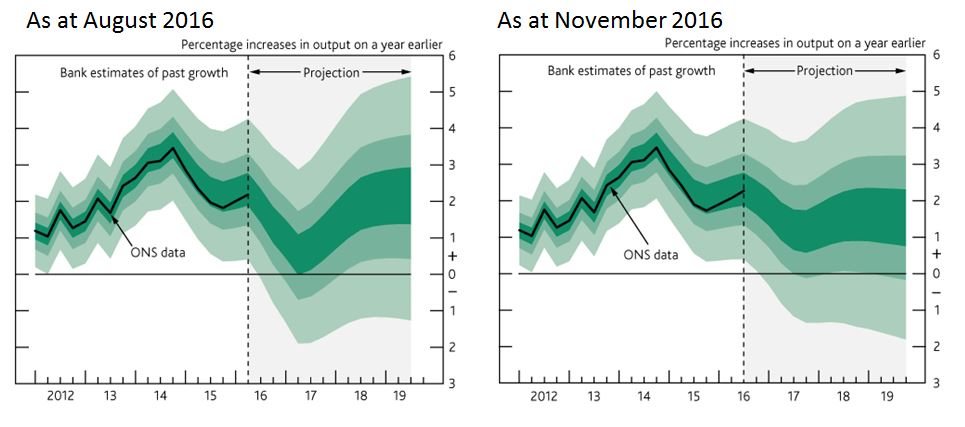 Source: http://www.bankofengland.co.uk/publications/Pages/inflationreport/2016/nov.aspx
NOTICES: I/we have no positions in any stocks mentioned, and no plans to initiate any positions within the next 72 hours. I wrote this article myself, and it expresses my own opinions. I am not receiving compensation for it. This article has been written for a US and UK audience. Tickers are shown for corresponding and/or similar ETFs prefixed by the relevant exchange code, e.g. “NYSEARCA:” (NYSE Arca Exchange) for US readers; “LON:” (London Stock Exchange) for UK readers. For research purposes/market commentary only, does not constitute an investment recommendation or advice, and should not be used or construed as an offer to sell, a solicitation of an offer to buy, or a recommendation for any product. This blog reflects the views of the author and does not necessarily reflect the views of Elston Consulting, its clients or affiliates. For information and disclaimers, please see www.elstonconsulting.co.uk Photo credit: N/A; Chart credit:Bank of England; Table credit: N/A 
Give me a sign Just as high priests in Roman times, after slaughtering their offering, examined its entrails to gauge the Gods’ favour, so too have UK commentators been searching for any statistical insight or market data point to declare whether the shock Brexit result is likely to lead to economic success or failure. The data point phoney war The data that has come out since the EU Referendum on 23rd June 2016 is meaningless as we still don’t know what Brexit looks like. It’s been a phoney war for headlines, as stunned commentators search for a gauge to measure policymakers by. When politicians use statistics, it’s dangerous. When they co-opt data, it’s dynamite. First we had encouraging PMI Data. Brexiteers (those who want the UK to leave) read this as vindication, which is a stretch to any rational observer given the pace of transmission in the economy. Next we had Bremainers (Brits wanting the UK to remain in the EU) shouting “Pound Down/Told You So”, whilst Brexiteers shouting “Footsie Up/Told You So”. It took a while for pundits to figure out that both sides were right, because they were unknowingly saying the same thing. This is because the FTSE 100 (Footsie), consists of companies with predominantly overseas earnings. Hence the UK’s bell-weather index gains were more a function of the pound’s slide, rather than any inherent strength in the economy. Marmite makes it real But perhaps what has hit home hardest is the 24-hour Marmite price spatbetween two behemoths, Unilever (NYSEARCA:UN; LON:ULVR) and Tesco (LON:TSCO), which led to a tabloid induced panic. Marmite is the salty yeast-extract paste either loved or hated by Brits on their toast. Its main ingredient is the sludge left over from brewing beer, so it seemed odd that a UK product with UK input costs should be at risk from a price hike. But given Unilever’s equipment, cost of capital and investors are looking for Euro denominated returns, the impulse to raise prices was clear. So Unilever wanted to raise prices +10% to offset the -15% fall in the pound. Tesco, the UK’s largest grocery, with enlightened self-interest wanted to shield consumers and share the pain with their supplier. For the time being, retailers are shielding consumers from price rises. But that go on forever. The consumer pain from weaker currency will eventually be felt, and will have an inflationary impact. Where is Golidlocks? The true fear gauge for Brexit is therefore not currency alone, but currency and inflation expectations. UK inflation expectation are reflected in the market by the “breakeven rate” – the implied inflation rate derived from the difference between conventional and inflation-linked gilts of the same maturity. This is the UK’s “quiet fear gauge” for Brexit, as it is not referenced in the tabloids. On eve of Brexit vote, US & UK 5Y breakeven rate stood at 1.495% & 2.301% respectively. The lower level in the US reflecting their stronger and faster recovery, steering the US economy away from deflationary fears following the Global Financial Crisis. The UK has followed a broadly similar path since the Global Financial Crisis, albeit at a higher level. Chart 1: US and UK 5Y Breakeven Rates History 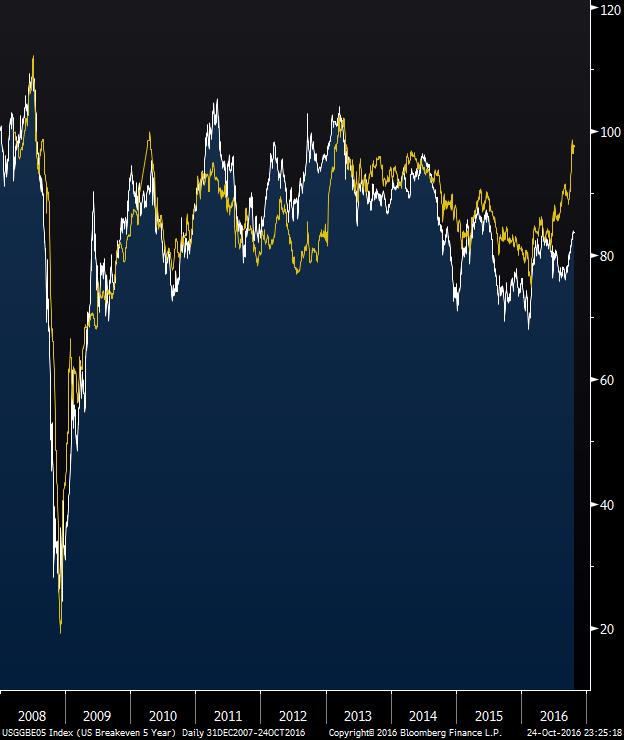 Source: Bloomberg: USGGBE05 Index & UKGGBE05 Index, rebased 31-Dec-07=100 Whilst a long way from the Goldilocks dream of moderate growth with inflation that was ‘just right’, the chart shows that the big bad deflationary wolf of 2008 has been vanquished by the fairytale money created by Quantitative Easing, and inflation targeting is, broadly, back on track. For now. Hard Brexit is inflationary Since the UK’s EU Referendum on 23rd June 2016, relative inflation expectations have dramatically diverged. Whilst the US has notched up slightly to 1.584%, the UK has rocketed to 3.052%. Unhappily for the UK’s new Prime Minister Theresa May, the bulk of this uplift can be pinned to her ‘Hard Brexit’ reference in her speech at the Conservative Party Conference on 2nd October 2016. Chart 2: US and UK 5Y Breakeven Rates since UK’s EU Referendum 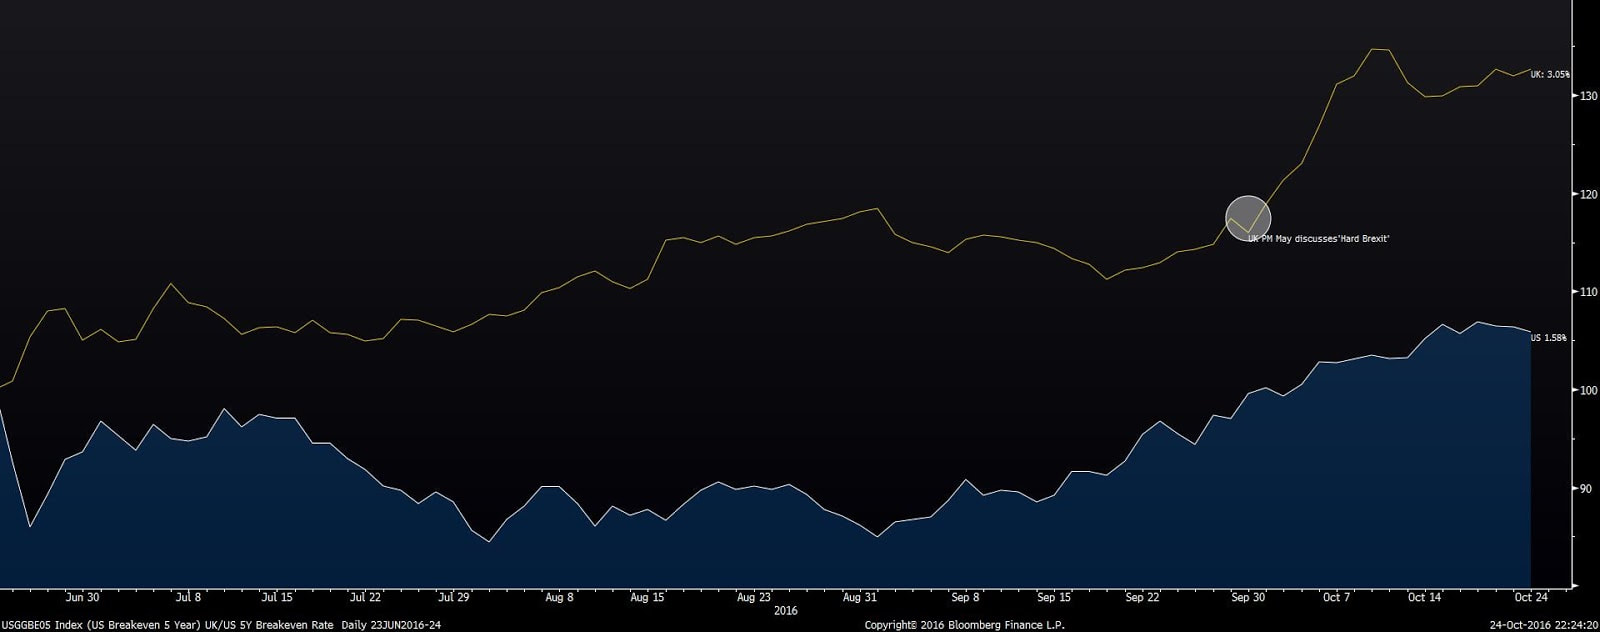 Source: Bloomberg: USGGBE05 Index & UKGGBE05 Index, rebased 23-Jun-16=100
The logic for this is brutally consistent. Hard Brexit means harder trading conditions which means slower growth and weaker pound. Slower growth and rising inflation is a painful combination, and would prove a gruesome challenge for the Bank of England. Carney’s Mission Impossible? Whilst deflation loomed, and inflation remained subdued, the era of ultra-low or zero interest rates was a possible and necessary lever of support. If the Cabinet are hell-bent on hard Brexit, Governer Carney will face a near impossible mission: to defy gravity by keep rising inflation in check (around the 2% target) whilst propping up the economy (and the markets) with a 0.25% Base Rate. The Cabinet’s staunchest Brexiteers are still traumatised from ‘Project Fear’(when the machinery of Cameron’s government lined up behind “Remain”). There is therefore additional political risk if Carney’s apprehension at this impending challenge is construed as partisan, and his position is made – by coercion or insinuation – untenable. Personalities and emotions in the broken love triangle of Prime Minister, Chancellor and Governor will matter here. In that respect the venality of the post-Brexit reshuffle is not encouraging. Brexit: Hard or Soft? The referendum result was not expected. The change of the country’s and Conservative party’s leadership was not expected. The post-referendum realisation that Brexit would actually happen was not expected. The idea that the new Cabinet would go for a “hard” as opposed to “soft” Brexit takes the pain of this sequence of negative surprises to the limit. Wishful thinking would suggest that perhaps the Cabinet’s discussion of a hard Brexit is a cunning plan to fox our EU counterparts before negotiations start? Sadly, given the lack of preparation exhibited by the Brexiteers on their unexpected victory, that would ascribe too much credit, where none is due: whilst cunning was in abundance, there was no plan. Inflation-protecting a portfolio For US and UK portfolio investors, 1.5% and 3% respectively are now the hurdle rates if 5 year returns are to be ‘real’. For long-term multi-asset investors, it is worth considering how best to inflation protect each element of their portfolio
No clear plan Either a clear Remain vote, or a clear Leave vote with a prompt articulation of what Brexit means (the Norway model? the Turkish model? the Swiss model?) would have given UK markets the certainty investors crave. But now four months on, the Government is, it seems, simply making up what Brexit means as we go along, and trying to keep irreconcilable interest groups happy. There seems to be one message from the Government to Japanese car manufacturers, another to the City, another to the EU, and very little, of course, to the electorate: just that, with crypto-clarity “Brexit means Brexit”. A real fear gauge This lack of clarity and lack of direction is creating real economic costs, and will ultimately hit everyone in the pocket for more than just Marmite. The upward march of the UK breakeven rate is the fear gauge for that: watch it. NOTICES I/we have no positions in any stocks mentioned, and no plans to initiate any positions within the next 72 hours. I wrote this article myself, and it expresses my own opinions. I am not receiving compensation for it. This article has been written for a US and UK audience. Tickers are shown for corresponding and/or similar ETFs prefixed by the relevant exchange code, e.g. “NYSEARCA:” (NYSE Arca Exchange) for US readers; “LON:” (London Stock Exchange) for UK readers. For research purposes/market commentary only, does not constitute an investment recommendation or advice, and should not be used or construed as an offer to sell, a solicitation of an offer to buy, or a recommendation for any product. This blog reflects the views of the author and does not necessarily reflect the views of Elston Consulting, its clients or affiliates. For information on Elston’s research, products and services, please see www.elstonconsulting.co.uk Photo credit: Google Images; Chart credit: Bloomberg Professional; Table credit: N/A |
ELSTON RESEARCHinsights inform solutions Categories
All
Archives
April 2024
|
 RSS Feed
Company |
Solutions |
|