|
Consumers love a new product launch. Just look at the queues outside Apple Stores when a new iPhone comes out, or the enduring popularity of car magazines with their sneak peaks of the latest models.
But launches of investment funds are different. With both of the examples I mentioned — smartphones and cars — you expect the new product to be substantially better than the last one; if it isn’t, it’s slated in the press. We already have far too many funds to choose from and, in the vast majority of cases, new funds are no better than what we already have. What they tend to be though is different to all the other funds out there, and it’s that which ensures they attract publicity. Fund management companies thrive on that publicity. They launch new products, in short, not because they will deliver better outcomes for consumers, but because they believe they will sell. A classic example is a new Aberdeen fund called the ASI HFRI-I Liquid Alternative fund, which will track an index of about 140 Europe-based hedge funds. Effectively it will give investors with at £5 million to invest access to average hedge fund returns. The fee of 30 basis points, or 0.30%, certainly seems attractive. But why would anyone seriously want to ape typical hedge fund performance? Hedge funds were all the rage in the 1990s, and some funds performed spectacularly well. Even taking into account the eye-popping fees they paid, some investors prospered. But hedge funds generally fared very badly in the global financial crisis and have failed to regain their golden touch ever since. As the Bloomberg columnist Nir Kaissar recently explained, instead of trying to make money, hedge funds “pivoted to not losing it”. “The new objective,” Kaissar wrote, “was to manage risk by protecting investors during downturns and delivering returns that are uncorrelated with the stock market. “It’s hard to imagine a lower bar, and incredibly, hedge funds failed to clear it… The equity hedge index has posted a negative one-year return 26 times since 2010, based on monthly returns, with an average decline of 4.4%.” There have been several different explanations as to why hedge fund performance has dropped off so badly over the last decade. Perhaps the most plausible one is that there is simply too much money chasing too few opportunities. You might have thought that, in view of the dismal returns that hedge funds have delivered in recent years, investors would have started to desert them. In fact the opposite has happened. According to Hedge Fund Research, the data group collaborating with Aberdeen on the ASI HFRI-I fund, assets invested in US-based hedge funds reached a record $955 billion in September 2018. With more money invested in hedge funds than ever before, your chances of beating the market over long periods are very slim. The irony is that this new Aberdeen fund may well prove very popular. Institutional investors, who traditionally like investing in hedge funds, tend to be very conservative — slow to embrace new ideas and discard old ones. Added to that, there’s still a social cachet connected to hedge funds. Also, of course, there are many investors who can’t resist a little gamble. The ASI HFRI-I fund, then, will probably be good for Aberdeen shareholders and, of course, for already very well remunerated hedge fund managers. But will it be good for those who invest in it? Relative to investing in a regular, low-cost, equity index fund, it almost certainly won’t. Whilst sound in theory, do risk-based strategies work in practice?
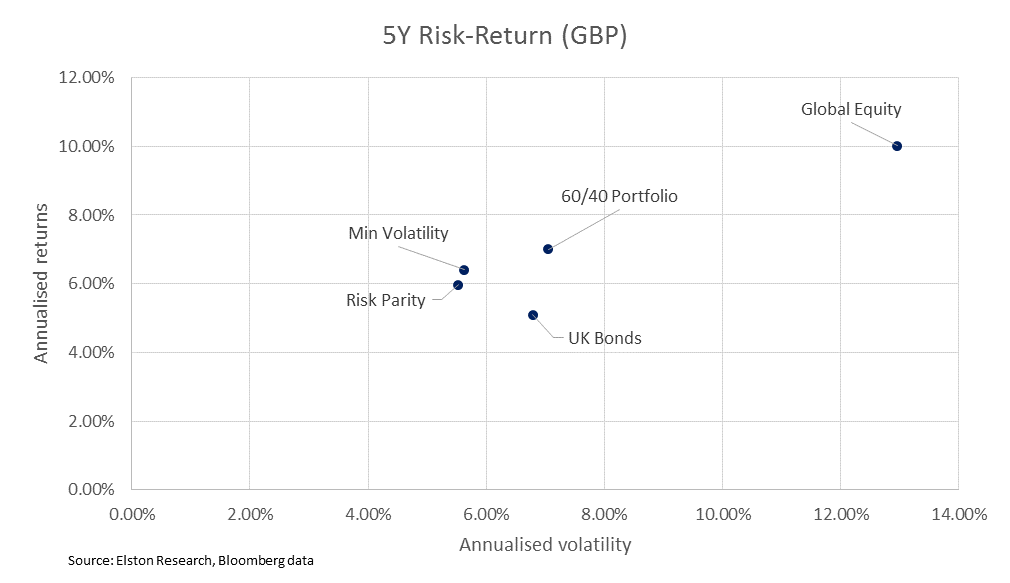
To find out, we took at the performance of a multi-asset Risk Parity Index and a multi-asset Minimum Volatility index. Risk Parity aims to achieve equal risk contribution from each asset class Min Volatility aims to combine each asset class to achieve a minimum variance portfolio On a rolling five year basis, both multi-asset Min Volatility and Risk Parity offered superior risk-adjusted returns relative to a 60/40 Portfolio for GBP investors. Both Min Volatility and Risk Parity offered a lower level of overall risk relative to a 60/40 portfolio. Get the full report here http://www.elstonetf.com/store/p3/Multi-Asset_Indices%3A_risk-based_strategies.html Bill Gross, one of the world’s most famous and influential money managers, has retired at the age of 74.
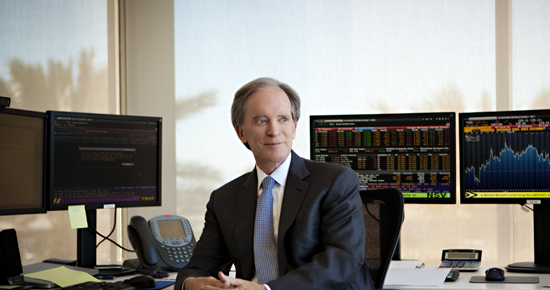
A specialist fixed income investor, nicknamed the Bond King, Gross is best known for co-founding Pimco Asset Management, and for managing the Pimco Total Return fund. There is no doubting his personal success. Under his leadership, Pimco became the biggest fixed investment firm in the world. Forbes estimates his personal wealth at around $1.5 billion. Gross managed to keep his investors happy for most of his career. From June 1987 to September 2014, the Pimco fund was the sector’s star performer, beating the Bloomberg Barclays US Aggregate Bond Index by around 1% a year, which for a bond manager is a large margin. But then came an unravelling. Gross was ousted by his colleagues at Pimco, who didn’t find him easy to work with, and he moved to Janus Henderson. His performance in four years there was less than stellar. He underperformed the index by some distance, and in 2018 his fund lost almost 4%. By the start of this year, it had more than halved in size to less than $1 billion — and most of that money was his own. Over his entire career, Bill Gross beat the index in more years than he was beaten by it. That might seem like a modest achievement; after all, the whole reason for paying active management fees is the hope of beating the market. Compared to his peers, however, Gross’s long-term record is very impressive. But does that really make him a star? And, more to the point, was he genuinely skilled or did he just get lucky? Distinguishing luck from skill in money management is extremely difficult. Depending on which statistician you speak to, it can take decades or even hundreds (yes, hundreds) of years of data to demonstrate skill beyond reasonable doubt. Gross certainly started bond investing at just the right time — the beginning of a bull market that lasted more than 30 years and sent prices soaring. Nearly all bond investments over that period grew in value. Gross was also a risk taker, preferring lower-quality corporate bonds to safer government bonds. Measured by annualised standard deviation, he took around 10% more risk than the index — 4.3% compared with 3.9%. The more risk a manager takes, the higher their returns are likely to be, and so it proved with Gross. There are various theories as to why his performance tailed off at Janus Henderson. The bond markets became more volatile for a start. Gross also moved away from a “total return” approach to what’s known as an “unconstrained” strategy, which may have suited him less well. Whatever the reason, Gross, like countless “star” managers before him was unable to replicate the success that had earned him that stellar status in the first place. How, then, will he be remembered? Of all the assessments made of his career in recent days, perhaps the most telling was by Gabriel Altbach, from the consultancy Asset Management Insights, in the Financial Times. “The industry owes Bill Gross a giant debt of gratitude,” said Altbach. “He made bond investing headline news and helped pave the way for countless other fund companies and portfolio managers.” Perhaps that says it all. Investing and asset management shouldn’t be headline news at all — bond investing especially. The financial media makes it far more exciting and glamorous than it really should be. It also loves characters, and Gross was certainly one of those, with his little eccentricities, his colourful investment letters and his juicy quotes. As for Pimco and Janus Henderson, Gross was their prize asset. Nothing attracts assets like a star manager, so no wonder their employers are usually only too happy to play along. Was Bill Gross genuinely skilful? We can’t be sure. Will there be another Gross? By the law of averages, probably yes. Can you, your adviser or favourite Sunday newspaper identify the next Gross in advance? Don’t even think about it. When it comes to bonds, it’s very hard to make a case for investing in anything other than a low-cost index fund or ETF.
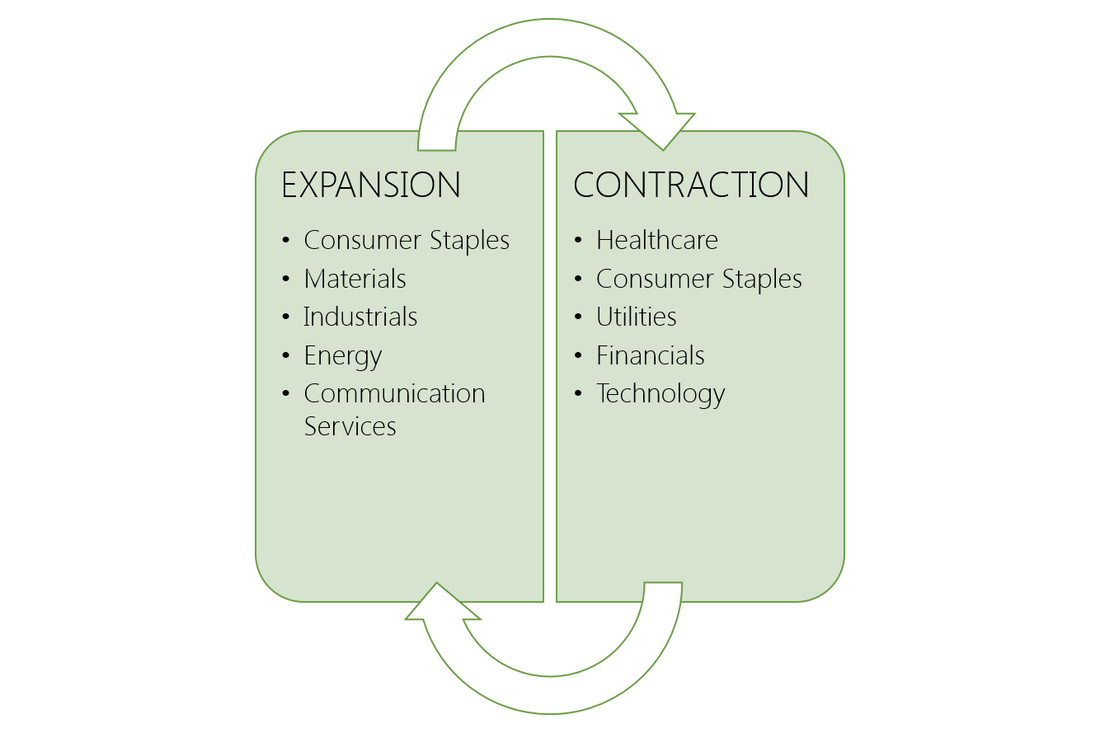
Sectors: walking or just talking? Most portfolio managers discuss markets within the context of the economic cycle. And no wonder: the main drivers of market performance – growth, inflation and interest rates – are not constants but fluctuate with the economic cycle. Managers point to their stock selection decisions because a particular company is seen as “cyclical” or “defensive”. In theory, cyclical companies do relatively better when the economy is expanding. Defensive companies do relatively better when the economy is slowing or contracting. But despite talking the talk on sectors when analysing the economic outlook, it’s harder to judge whether or not managers are walking the walk when it comes to sector investing. If your portfolio manager is not providing a sector allocation in their reporting back, perhaps ask for one. What exactly is a sector? A sector is a group of companies which provide the same or related product or service. The most broadly use classification system is the Global Industry Classification Standard (“GICS”) which categorises companies into 11 distinct sectors. GICS further defines 69 industry types that fall within each of those sectors. Cyclical or Defensive? When a company’s earnings are dependent on or more correlated with the broader economic business cycle, they are “cyclical”. When a company’s earnings are independent of or less correlated with the broader economic business cycle, they are defensive as in theory are less impacted by downswings in the economy. The list of sectors includes sectors considered “cyclical” such as: Communication Services, Consumer Discretionary, Financials, Industrials, Materials, and Technology; and sectors considered “defensive” sectors such as: Consumer Staples, Energy, Health Care, Utilities and Real Estate. Sector indices Sector indices calculate the performance of, typically, the combined market capitalisation of each distinct sector. In this way we are able to see the performance of each sector at different stages of the economic cycle on a standalone basis, in comparison with other sectors, and relative to the overall equity market. Why use a sector lense? By looking both the economy AND the market through a sector lense it is possible to analyse how groups of companies with commonalities as regards their input (expenses) and output (revenues) behave relative to their peers to inform comparisons within each sector, and comparisons between sectors over different time frames. This helps us understand the impact the economy has on sector-specific drivers, and which sectors could be in favour or out of favour at different stages of the economic cycle. Understanding the economic cycle The economic cycle (a.k.a business cycle) is the fluctuation in economic growth rates over time as measured by real (inflation adjusted) Gross Domestic Product as measured by national statistic offices. The economic cycle can be broken down into two broad states: expansion (trend of economic growth) and recession (trend of economic decline). Expansions are measured from the trough (or bottom) of the previous economic cycle to the peak of the current cycle, while recession is measured from the peak to the trough. The economic is different from the market cycle (the fluctuation of the equity markets over time), although one can impact the other. What drives sector performance? Economic activity changes at different changes in the cycle. In periods of expansion, consumers are more likely to increase their non-essential discretionary spending – so Consumer Discretionary should do better. In periods of recession, consumers are more likely to hunker down and focus only on essential spending – so Consumer Staples and Utilities should do better, for example. This seems intuitive. Furthermore, research suggests that more specifically it is the role of monetary policy that really drives sector performance. Central Banks adapt monetary policy based on the economic cycle. When monetary policy is easing, cyclical stocks do generally better. When monetary policy is tightening, defensive stocks generally do better. Surfing the cycle Given the economic cycle and monetary policy are in flux, it follows that an investor with a strategic allocation to equities should dynamically allocate to different sectors at different stages of the cycle, rotating from cyclicals to defensives and back again as the economic cycle fluctuates. This sector rotation strategy can earn “consistent and economically significant excess return while requiring only infrequent rebalancing”. Accessing sectors All equities fall within a sector grouping. Investors must therefore decide whether they wish to construct a portfolio of stocks within each sector or have a fairly concentrated holding within each sector. For investors that want to maximise diversification within each sector, a sector ETF is a convenient way of accessing targeted and comprehensive exposures to distinct sectors. Sector investing Whether investing in a particular sector to capitalise on specific sector trends, or seeking to implement a dynamic allocation strategy between sectors over the economic cycle with an equity allocation, sector ETFs offer a low-cost and convenient way of implementing cyclical sector views efficiently and precisely. Notices and Disclaimers: Disclosure: I/we have no positions in any stocks mentioned, and no plans to initiate any positions within the next 72 hours. Additional disclosure: Recently published Elston ETF Research reports “Sector Equities: 4q18 Update” and “Sector Equities: 4q18 Survey” were sponsored by State Street Global Advisors Limited. We warrant that the information in this article is presented objectively. For further information, please refer to important Notices and Disclosures please see our website www.ElstonETF.com This article has been written for a UK audience. Tickers are shown for corresponding and/or similar ETFs prefixed by the relevant exchange code, e.g. “LON:” (London Stock Exchange) for UK readers. For research purposes/market commentary only, does not constitute an investment recommendation or advice, and should not be used or construed as an offer to sell, a solicitation of an offer to buy, or a recommendation for any product. This article reflects the views of the author and does not necessarily reflect the views of Elston Consulting, its clients or affiliates. For information and disclaimers, please see www.ElstonETF.com Photo credit: N/A; Chart credit: Elston Consulting; Table credit: Elston Consulting |
ELSTON RESEARCHinsights inform solutions Categories
All
Archives
July 2024
|
Company |
Solutions |
|


 RSS Feed