

Smart beta strategies are “smart” because they take a scientific, quantitative and objective approach to investing by combining a range of index-tracking ETFs with different market risk or “beta” exposures. In contrast to the opacity of hedge funds, dynamic allocation “smart beta” investment strategies should do what they say on the tin. Elston runs a number of diversified multi-asset investment strategies, two of which have been offered as indices for asset owners and investment managers to benchmark against or track. Chart 1: Risk and Return 2016 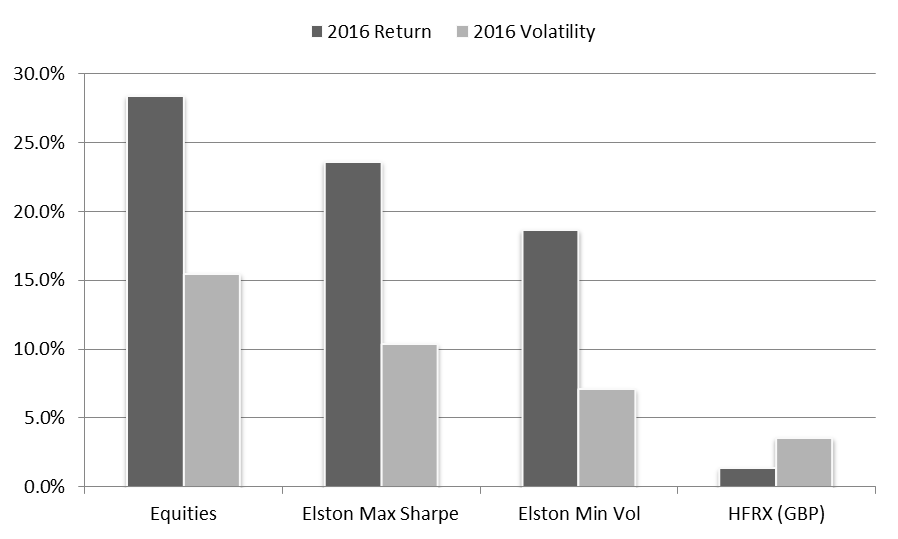 Source: Elston, Bloomberg, all in GBP Looking at outcomes Our multi-asset Global Max Sharpe index (Bloomberg: ESBGMS) did what it said on the tin delivering a Sharpe ratio (our primary measure of success for this strategy) of 2.06 for 2016, compared to 1.94 for Equities, 1.90 for Bonds and 1.45 for Commodities. On a returns basis (our secondary measure of success) the strategy returned 23.58% for the year, compared to 28.35% for equities, but with volatility of 10.35% compared to 15.45% for equities. Put differently, the strategy captured 83% of equity returns with just 67% of equity risk. Chart 2: Elston Multi-Asset Max Sharpe (ESBGMS) 2016 Outcome 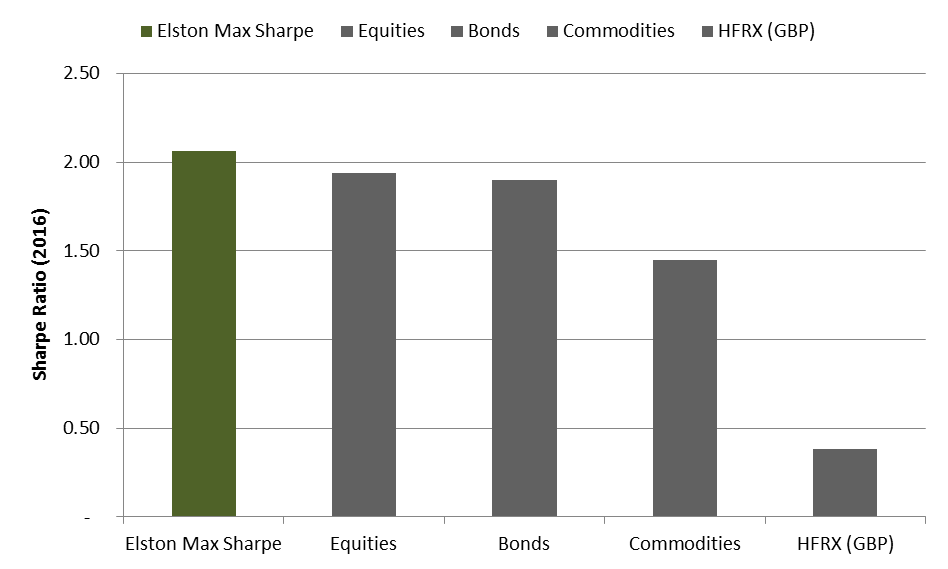 Source: Elston, Bloomberg, all in GBP Our multi-asset Global Min Volatility index (Bloomberg: ESBGMV) also did what it said on the tin whilst maintaining exposure to a broad set of return-seeking asset classes. The realised volatility (our primary measure of success for this strategy) for 2016 was 7.08%, compared to 15.45% for equities, 13.64% for bonds and 25.28% for commodities. Our dynamic asset allocation approach minimised portfolio variance whilst harvesting returns. On a returns basis (our secondary measure of success), the strategy returned 18.62% for the year, compared to 28.35% for equities, but with volatility of 7.08% compared to 15.45% for equities. Put differently, the strategy captured 66% of equity returns with just 46% of equity risk. Chart 3: Elston Multi-Asset Min Volatility (ESBGMV) 2016 Outcome 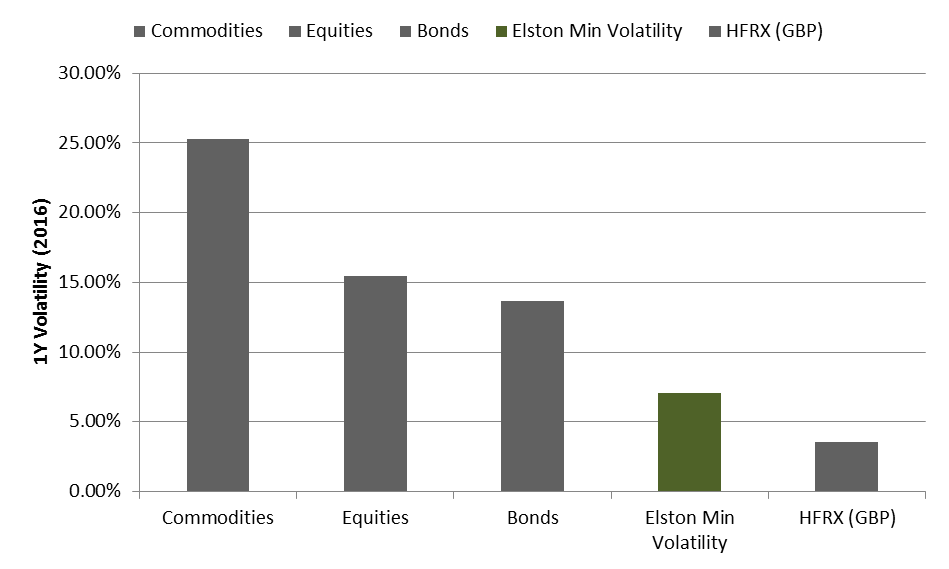 Source: Elston, Bloomberg, all in GBP Theory and practice Our strategies constituent parts are ETFs representing a broad range of asset classes and geographies. The Sharpe of our Global Max Sharpe strategy’s whole is greater than the sum of its constituent parts. The Volatility of our Global Min Volatility strategy’s whole is less than the sum of its constituent parts. And that’s the intention. A low cost more consistent alternative to hedge funds? Hedge funds were popular because they provided differentiated returns and mitigated risk. In 2016, Hedge Funds returned 1.35% with volatility of 3.56%. Put differently, on average they captured just 5% equity returns, despite taking on 23% of equity risk. We plot out equity return capture (return relative to global equity return) and risk outlay (volatility relative to global equity volatility) for the main asset classes, our strategies and HFRX (all in GBP) in the summary matrix below. Chart 4: 2016 Return Capture vs Risk Outlay 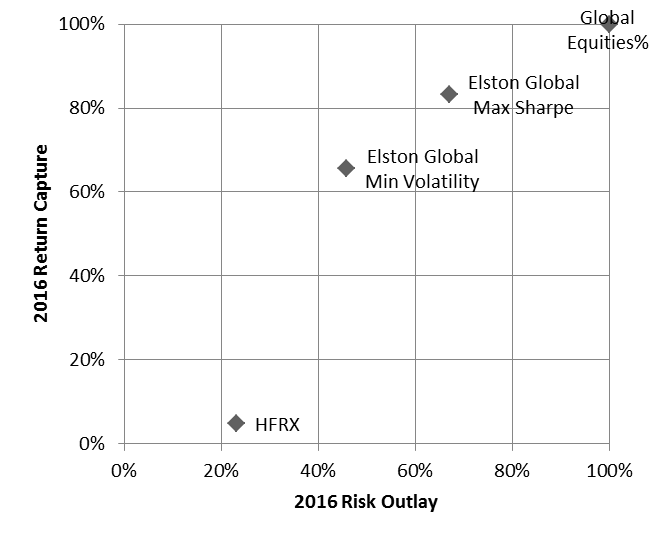 Source: Elston, Bloomberg
The problem with many hedge funds is that they are not doing what they say on the tin. They aim to provide diversified differentiated returns – but their process, statistically, amounts to trial and error, fraught with subjective bias. We seek to achieve similar outcomes, but using a clinically quantitative approach. To paraphrase a famous composer: “At the end of the day, it’s just maths.” What next? The Elston Strategic Beta multi-asset indexes were launched in December 2014. They are priced daily with index values available for free, factsheets are published daily. Our research strategies and indices are available for licensing. |
ELSTON RESEARCHinsights inform solutions Categories
All
Archives
July 2024
|
 RSS Feed
Company |
Solutions |
|