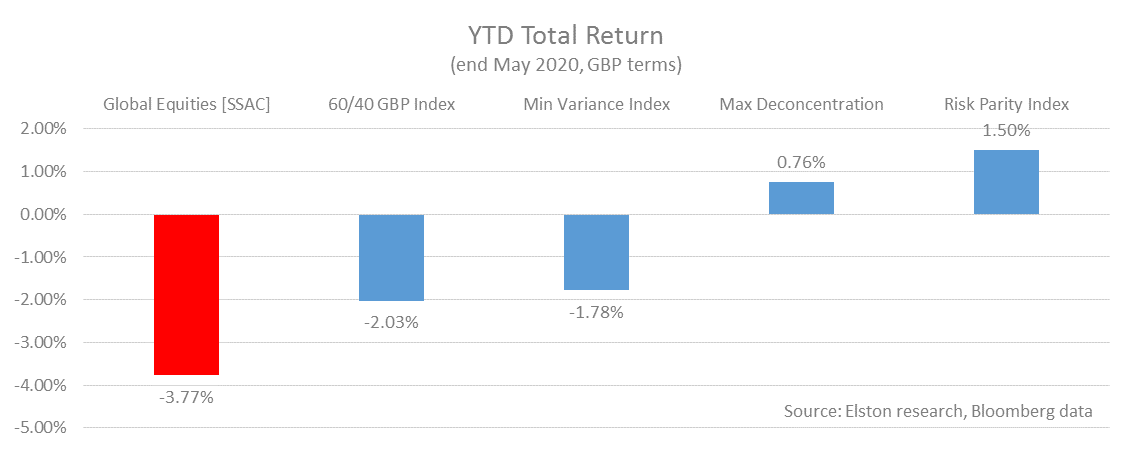
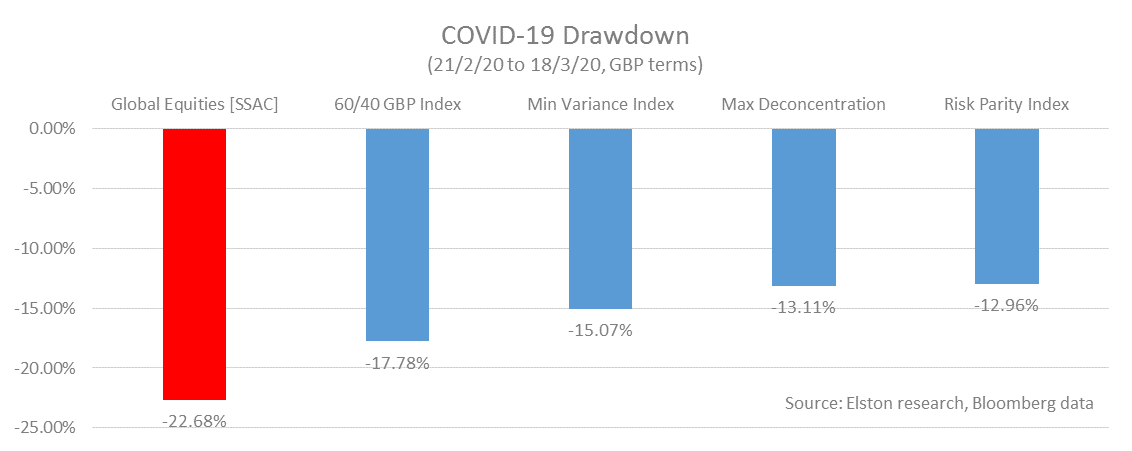
The standard rationale for multi-asset investing is to ensure diversification between equities and bonds. But how to construct that multi-asset portfolio. We summarise 4 approaches and look at performance through the “live ammo stress test” of 2020. The classic 60/40 portfolio: This represents a traditional asset-weighted portfolio for UK investors with predominantly global equities and predominantly GBP bonds. This strategy is represented by the 60/40 GBP Index [6040GBP]. The equal weight or "1/N" portfolio: This represents an equal-asset-weighted portfolio to remove overallocations to size and/or domestic biases within equity and bond exposures. This strategy is represented by the Elston Max Deconcentration portfolio [ESBGMD]. However, the problem with any asset-weighted investing is that in extreme stress periods, correlations between asset classes increase meaning that any asset-weighted diversification effect is reduced just when you need it most. Enter risk-weighted multi-asset strategies. Rather than allowing asset weights to drive portfolio risk & correlation, risk-weighted multi-asset means allowing the portfolio risk (volatility, correlation) to drive asset weights. The Min Variance portfolio: This looks at the volatility and correlation between asset classes and aims to deliver the combination of equities and bonds required to achieve the minimum variance (lowest risk) portfolio whilst remaining exposed to risk assets. This strategy is represented by the Elston Min Variance Index [ESBGMV]. The Risk Parity portfolio: This looks at the risk contribution of each asset class and aims to deliver a portfolio where each asset class contributes equal risk contribution to the overall portfolio. This strategy is represented by the Elston Risk Parity Index [ESBDRP]. Year to date performance Of these risk-based multi-asset strategies for GBP investors, the best performing YTD (to end May) has been Risk Parity +1.50%, followed by Max Deconcentration +0.76%, followed by Min Variance -1.78%, compared to -2.03% for the 60/40 GBP Index, and -3.77% for Global Equities. Drawdowns From the start of the market turmoil to the trough of the 60/40 index on 18th March, Risk Parity provided most downside protection, closely followed by Max Deconcentration. Unsurprisingly, the 60/40 index took approximately 60% of global equity downside. How to get “true diversification”
To achieve true diversification, you need to combine uncorrelated/differentiated holdings alongside your core strategy. An asset-weighted approach, such as 60/40 portfolio, does reduce beta (by definition you are taking 0.6x of market risk), but does not reduce correlation. A 60/40 portfolio is almost 100% correlated to global equities. By contrast, a risk-weighted approach creates the potential for decorrelation, thereby creating the potential for “true diversification” relative to a core portfolio. The recent market turmoil has shown that when true diversification is needed most, a risk-weighted approach has a useful role to play. For more on our risk-weighted portfolios and indices, see www.ElstonETF.com/etf-portfolios.html
We are adding the Elston Maximum Deconcentration Portfolio to our suite of multi-asset risk-based strategies. The portfolio is now "live" with factsheets updated daily (portfolio ticker ESBMDC). What is "Deconcentration"? Put simply, in the context of multi-asset investing, if single asset investing is having all eggs in one basket; 60/40 investing is having all eggs in two baskets; then deconcentration is having one egg per basket. It is diversification at its simplest: giving an equal weight to each asset class within the portfolio. This portfolio construction approach is known as a "Deconcentration strategy" as it deconcentrates the portfolio from any single asset class. It is also known as a (1 over N) approach, where N is the number of holdings within the portfolio. What problem are we trying to solve? Most traditional multi-asset strategies, such as a 60/40 portfolio, have a capitalisation-weighted approach to asset allocation. Within a classic global equity benchmark, for example, the US dominates with a ~60% allocation. So within a vanilla 60/40 portfolio, US equities may have a 36% allocation (60% US exposure within 60% Global Equity allocation). Nothing wrong with that, but it's an overweight based on capitalisation. Likewise within the bond allocation rather than having a bias towards GBP issued bonds under a classic 60/40 approach. Again, nothing wrong with that, but it limits the diversification impact of international bonds. How does a max deconcentration portfolio work? One way of creating differentiated risk-returns is to ignore these size-and-domestic biases is to create a "naive" or simple diversification strategy, such as an equally-weighted multi-asset approach. We look at an opportunity set of 20 asset class exposures: regional equity markets, bonds by issuer type, maturity and currency, as well as alternatives such as gold, listed infrastructure, property securities. We then create an equal-weight allocation (1/20 = 5%) to each asset class. This portfolio thereby provides an alternative approach to multi-asset diversification with differentiated risk-return characteristics. Does it work? By default, the risk-return characteristics of a 1/N portfolio will be different to that of a traditional multi-asset portfolio, so a Max Deconcentration strategy will provide a differentiated risk-return characteristic for diversification purposes. However, there is also research to suggest that a "simple" 1/N portfolio can outperform more "sophisticated" mean-variance optimised portfolios. For more on this, see De Miguel, Garlappi and Uppal (2009) and related readings. Obviously the nuance of any 1/N portfolio will depend on its design parameters: the performance of our Max Deconcentration strategy will be included in future multi-asset strategy reviews relative to a 60/40 benchmark as well as other risk-based strategies such as Min Variance and Risk Parity. Keep updated To view peformance of this strategy, please refer to our strategy factsheets, published daily, or request portfolio access via Bloomberg. To replicate this strategy, subscribe to our Advanced Portfolios for weightings files and detialed performance analysis.
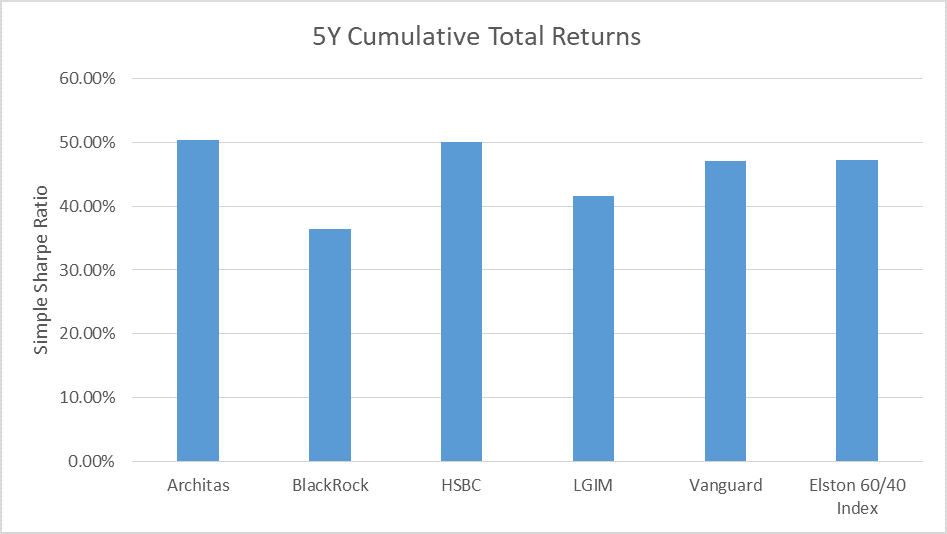
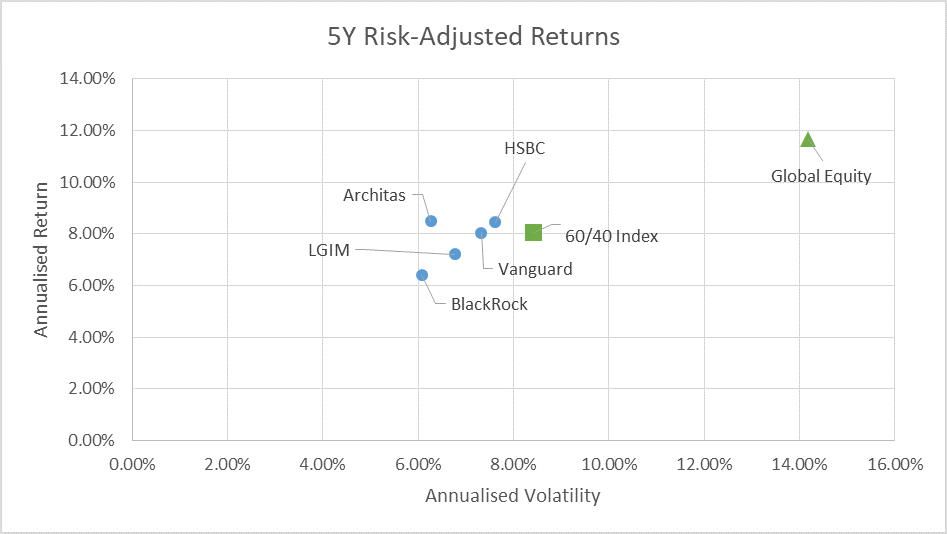
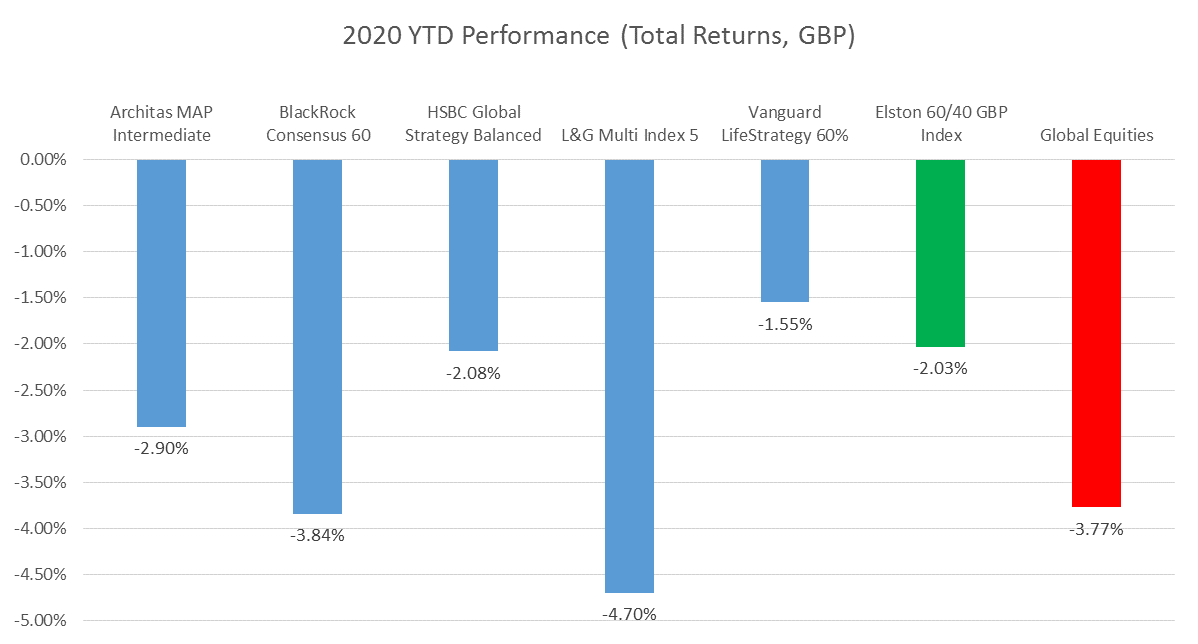
We analysed 5 year performance of major multi-asset index funds relative to the Elston 60/40 GBP Index to end December 2019, and a YTD update through the COVID-19 impact. We focused on the following multi-asset index funds* for performance analysis: Architas Multi-Asset Passive Intermediate fund, BlackRock Consensus 60 fund, HSBC Global Strategy Balanced fund, LGIM Multi-Index 5 fund and Vanguard LifeStrategy 60% Equity fund. Cumulative Returns Architas and HSBC have the best performing funds in absolute terms within this group: Source: Elston research, Bloomberg data Notes: Total returns in GBP terms, daily data, as at 31/12/19 Risk-adjusted returns Within this group, Architas has delivered best risk-adjusted returns within: Source: Elston research, Bloomberg data Notes: Annualised total returns in GBP terms, daily data. 5 year annualised daily volatility data as at 31/12/19 Performance in COVID-19’s “live fire stress-test” Looking at performance year to date, we see Architas, HSBC and Vanguard delivering performance most consistent with the 60/40 index. BlackRock Conensus 60 and L&G Multi-Index have delivered least consistent performance relative to this index, underperforming the 60/40 index by -1.81ppt and -2.67ppt respectively. Obviously those funds’ objectives are specific to each fund and are aiming neither to track nor beat the 60/40 index. But now we can track the performance of a “no-brainer”** 60/40 portfolio in real-time, it’s easier to see the value that multi-asset index funds add or substract relative to that plain vanilla benchmark. Multi-asset managers can add value through optimisation, tactical allocation and implementation efficiencies, for example. Source: Elston research, Bloomberg. As at 29/5/20 total returns basis, GBP terms.
Costs Ranked by Total Costs and Charges (“TCC”) which represents OCF plus transaction costs, HSBC offers the lowest cost option. OCF TCC HSBC 0.18% 0.22% BlackRock 0.22% 0.29% Vanguard 0.22% 0.26% LGIM 0.31% 0.31%*** Architas 0.47% 0.48% Source: manager data, as at end December 2019. ***estimated figure Value For Money Architas may look expensive on a TCC basis. But it has delivered best risk-adjusted performance in the period under review owing to their more dynamic asset allocation approach, so arguably offers good value for money on a risk-adjusted basis. For static allocation funds, the main differentiator is cost alone, on which basis HSBC offers best value for money, in our view. A less inappropriate benchmark Whilst our 60/40 benchmark by default may not be the "perfect" benchmark for these and other (balanced/medium-risk) multi-asset funds, it is certainly a less inappropriate benchmark than comparing a multi-asset fund to a FTSE 100 or Global Equity benchmark. Whilst individual fund houses may use composites for comparison, these may not be publicly available for analysis. The existince of a published standardised 60/40 benchmark enables cross-comparison, analysis and insights. *Fund tickers: ARINTDA, BRC60DA, HSWIPCA, LGMI5IA, VGLS60A respectively. Index ticker: 6040GBP Index **Abraham Okusanya's coinage in https://finalytiq.co.uk/cobras-unintended-consequences-multi-asset-funds/
Multi-asset index funds are a powerful and straightforward way for DIY investors to create a multi-asset, diversified and low-cost core holding within a portfolio. How much should I have in my core? For index investors not wanting to worry about creating and managing their own asset allocation, these funds can provide a one-stop shop and receive a 100% allocation. For investors who enjoy picking their own stocks or funds, these funds can provide a helpful core exposure. The extent to which multi-asset funds make up a core is up to the investor as a preference, and obviously impacts the similarity of portfolio performance to a multi-asset fund. Investors who want the bulk of their risk-return characteristics to be self-selected should consider a lower allocation to a multi-asset fund core, for example 20-40%. Investors who want the bulk of their risk-return characteristics to be consistent with the chosen multi-asset fund should consider a higher allocation to that core, for example 60-80%. Self-selected single asset class investments would thereby represent satellite holdings. Selecting a risk profile Multi-asset funds typically come in “suites” with 3 to 5 versions to choose from based on risk profile. Risk profile can be defined by percentage allocation to equities, so investors can select a risk-return profile that is consistent with their objectives. How do they differ? Multi-asset index funds will differ in the following ways in terms of philosophy and process:
Does it make sense to hold more than one multi-asset fund? Not really. Multi-asset funds of the same given risk profile (as defined by % equity allocation) will have similar risk-return characteristics. The building block index funds they use will mean similar underlying equity/bond exposures. They are all incredibly well diversified. Having multiple multi-asset index funds just reduces economies of scale, introduces higher frictional dealing costs, and blurs transparency around asset allocation. Investors should therefore select a multi-asset fund whose objectives and investment process resonates best and where value for money is keenest. Comparing multi-asset funds The IA Mixed Investment Sectors are peer groups of multi-asset funds. There are four relevant “risk profiled” sectors for multi-asset funds (Target Volatility and Target Absolute Return funds are treated separately.)
However these remain popular peer groups for comparative purposes. A 60/40 index can help comparison As the bulk of assets flow into “balanced” multi-asset funds with a 60% equity allocation, we created a 60/40 equity/bond index for GBP investors to provide a comparator for multi-asset funds. This means that investors can evaluate multi-asset fund managers skill at 1) creating optimised portfolios over a “boring” 60/40 portfolios; and 2) evaluate the value added by dynamic asset allocation decisions relative to a static-weight index. While additional indices for different risk profiles may make sense in the future, we believe a 60/40 index is an important first step.
When evaluating multi-asset funds and portfolio strategies we were often frustrated by a lack of straightforward “vanilla” multi-asset benchmarks for GBP investors. Instead there is a heavy reliance on peer groups. Multi-asset funds are often compared to mixed asset fund sector performance, which reflects the average performance of funds within a category, which gives one dimension of comparison. Likewise, multi-asset portfolios are often compared to the median of a peer group of managed portfolios. But peer groups are not always ideal comparators. By default, you cannot ever replicate peer group performance. The accidental influence of multi-asset benchmarks Whilst there are multi-asset benchmarks for retail investors, the methodology that underpins the decisions around asset allocation changes within those benchmarks is committee-led and subjective, rather than rules-based. Given the importance of asset allocation, why should a discretionary manager or multi-asset fund use a third party for asset allocation comparison that may have no bearing on that manager’s strategic view. Put differently, should the asset allocation of a benchmark indirectly influence the wealth management industry? We think not. But at the same time, there is a clear and persistent need for an objective comparator, such as a composite. Composites: helpful but inconsistent In the institutional space, the objective comparator is often a highly customised composites. That’s understandable, as a composite will be designed to be a “strategic neutral” asset allocation for a particular investment style. But more generally for investment research and comparison, 60/40 equity/bond composites are used for performance comparisons. But as with any composite, the selected assumptions and parameters around even a simple 60/40 index can differ widely. This means there is very low consistency or comparability between these composites used by different managers. A straightforward 60/40 benchmark Weirdly, despite its popularity in research and performance analysis, there has been no central, consistent and accessible point of reference as regards the performance of a 60/40 equity/bond strategy for GBP investors. Until now. We set ourselves the challenge of how do we create a straightforward benchmark that represents a 60/40 equity/bond portfolio for GBP investors that meets the “SAMURAI*” benchmark tests. To do this, we had to consider three issues: 1. Is a simple “heuristic” 60/40 approach intellectually ok? 2. What’s the background to the 60/40 approach anyway? 3. How should we construct a 60/40 benchmark for GBP-based investors? Heuristic allocations: a pragmatic approach Creating a heuristic (“rule of thumb”), rather than optimised, asset allocation is a long-standing, pragmatic approach by portfolio theorists and practitioners alike. Even Harry Markowitz, the father of Modern Porfolio Theory, chose a simple 50/50 equity/bond allocation for his own pension scheme. I should have computed the historical co-variances of the asset classes and drawn an efficient frontier. Instead, I visualized my grief if the stock market went way up and I wasn’t in it–or if it went way down and I was completely in it. My intention was to minimize my future regret. So I split my contributions 50/50 between bonds and equities.[1] So we can be comfortable with creating a heuristic allocation because it is an accepted practice, some background towhich is outlined below. Background to the 60/40 allocation Any reference to a 60/40 portfolio prior to the 1970s would be most welcome. But from our research, we understand that in the 1970s and 1980s pension scheme trustees used a 60/40 equity/bond benchmark for plan assets. Whilst in theory a perfect immunisation strategy could be implemented with a 100% bond allocation of matching duration, the risk that actual returns might not keep pace with expected returns particularly in an inflationary environment, together with higher implicit cost and limited availability of implementing such strategies, led practitioners to incorporate a substantial allocation to equities to protect against inflation and to help generate growth of plan assets. Research at the time supported a 40-70% allocation to risk assets, thereby defending the 60/40 allocation as a pragmatic approach[2]. Jack Bogle, the founder of Vanguard, was a staunch believer in the 60/40 portfolio as a benchmark allocation (although in later years he moved closer towards 50/50[3]). So whilst we can accept heuristic allocations in general, and the 60/40 allocation in particular, we have to decide: how best to populate a 60/40 portfolio for GBP investors? Whose 60/40 is it anyway? How do we construct a 60/40 portfolio for GBP investors? It may seem straightforward, but design parameters are still required, for which the only consensus can be, that there will be no consensus on what is “right”. In this respect, we have attempted to make design decisions that implicitly reflect practitioner views as well as our own. Whilst a 60/40 equity/bond allocation may seem straightforward, it requires thought depending on an investor’s base currency. For example:
1. Should the 60% equity reflect UK equity or global equity or both? The bulk of portfolio research originates in the US which not only represents the bulk of global equity indices, but also has the world’s largest companies that have international revenue streams. Put simply the S&P500 gives investors exposure to US companies that have global revenues. That’s why the debate around including international equities is a very different one when viewed from a US or UK perspective. Whilst US companies represent the bulk of global equity (developed and emerging markets combined) by market cap as well an international revenue dimension; UK companies represent a fraction of global equity by market cap, despite an international revenue dimension. So whereas the decision for a US investor to use US only or Global equities in a 60% equity allocation is fairly nuanced, for a UK investor it is absolutely critical. We decided that within the 60% equity allocation, a 100% allocation to UK equities would be too much, and yet a market allocation (~6%) would be too little. A 50/50 allocation would be too great a home bias, so we decided to have a 80% allocation to global equities and a 20% allocation to UK equities. A heuristic within a heuristic. What stopped us having a 100% allocation to Global Equities, is to reflect that asset allocation models used by UK managers and advisers typically have an element of UK equity bias. 2. Should the 40% bonds reflect UK bonds, or global bonds or both? On the bond side, we believe the opposite is true. For bonds, it makes sense for UK investors to have a bias towards UK bonds as a buffer against changes in UK economy, interest rates and inflation, we therefore allocate 80% to UK bonds (corporates and gilts of different maturities), and 20% to international bonds (unhedged). Summary In summary, for our UK 60/40 benchmark we use predominantly global equities and predominantly UK bonds. If portfolio or multi-asset managers want to improve performance vs this “vanilla” index by optimising, or indeed ignoring these weights, then go for it. The purpose of the index is not to provide a “right answer”, but to provide a representative multi-asset allocation that captures the broad opportunity sets for both equities and bonds. Potential applications: a useful yardstick Our 60/40 benchmark can provide consistent, transparent insight for performance evaluation of multi-asset funds and portfolios. Furthermore, the advantage of a simple 60/40 benchmark is that it can be used test multi-asset portfolio construction hypothesis such as:
Why Elston 60/40 GBP Index?
Search “6040GBP Index” on leading data vendors such as Bloomberg, Reuters and Morningstar or visit http://www.elstonetf.com/indices.html References [1] https://jasonzweig.com/what-harry-markowitz-meant/ https://jasonzweig.com/what-harry-markowitz-meant/ [2] Pension Fund Asset Allocation: In Defense of a 60/40 Equity/Debt Asset Mix (Ambachtsheer, 1987) [3] https://www.investopedia.com/articles/financial-advisors/012716/where-does-john-c-bogle-keep-his-HHmoney.asp * A publicly available index can be used as a benchmark so long as it has the following qualities*: Specified: The benchmark is specified in advance - prior to the start of the evaluation period. Appropriate: The benchmark is consistent with the manager’s investment style or area of expertise. Measurable: The benchmark’s return is readily calculable on a reasonably frequent basis. Unambiguous: The identities and weights of securities are clearly defined. Reflective: The manager has current knowledge of the securities in the benchmark. Accountable: The manager is aware and accepts accountability for the constituents and performance of the benchmark. Investable: It is possible to simply hold the benchmark. * See Managing investment portfolios: A dynamic process (CFA institute investment Series), Third edition, John L. Maginn, Donald L. Tuttle, Jerald E. Pinto, Dennis W. McLeavey |
ELSTON RESEARCHinsights inform solutions Categories
All
Archives
July 2024
|
Company |
Solutions |
|



 RSS Feed