
What just happened? The UK’s financial services watchdog, the Financial Conduct Authority (FCA) has fined Henderson Investment Funds Limited, the fund provider that is now part of Janus Henderson, £1.9m ($2.5m) for “failing to treat fairly more than 4,500 retail investors in two of its funds.” The funds named are the Henderson Japan Enhanced Equity Fund and the Henderson North American Enhanced Equity Fund, which had been originally set up and marketed as actively managed funds. In November 2011, the funds’ appointed manager Henderson Global Investors Limited decided to reduce the level of active management of these funds – effectively making them more similar to a passively-managed tracker fund. Who was affected? While this change of strategy was communicated to institutional investors, who were also offered fees to be reduced to zero, there was no such communication or fee adjustment for the 4,713 direct retail investors (who represented 5% of fund value by AUM), and 75 intermediary companies (for example, financial advisers) who remained invested in those funds. How long did this go on for? This discrepancy continued between November 2011 and August 2016, Henderson allowed this discrepancy to continue with retail investors seeing no change in prospectus, objectives or fee levels while the fund was deliberately reposition to a more passive-style strategy: effectively Henderson wilfully converted two of its funds into closet index funds, but just didn’t tell its retail clients. What was performance like during this period? The charts below show the performance of each fund between November 2011 and August 2016. The charts show the funds underperforming the index owing to active fees which creates heavier and heavier drag. Henderson Japan Enhanced Equity (old name) 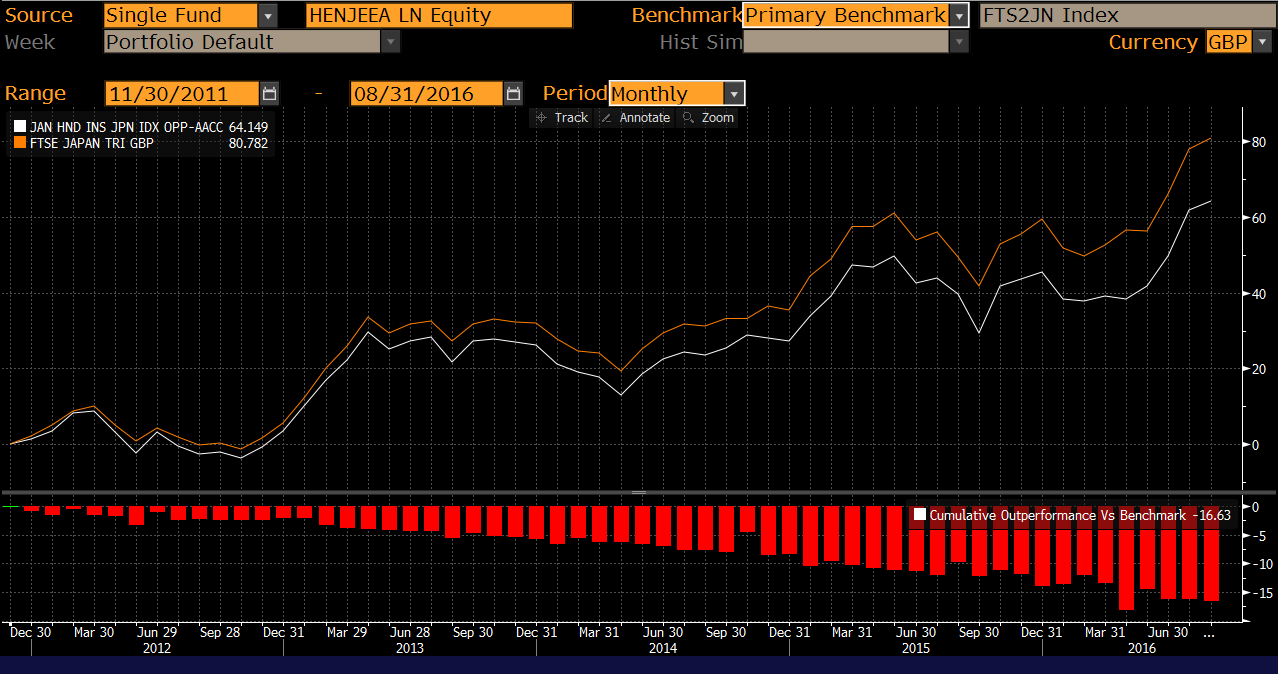 Source: Bloomberg, GBP terms, monthly data, vs selected index Henderson North American Enhanced Equity (old name) 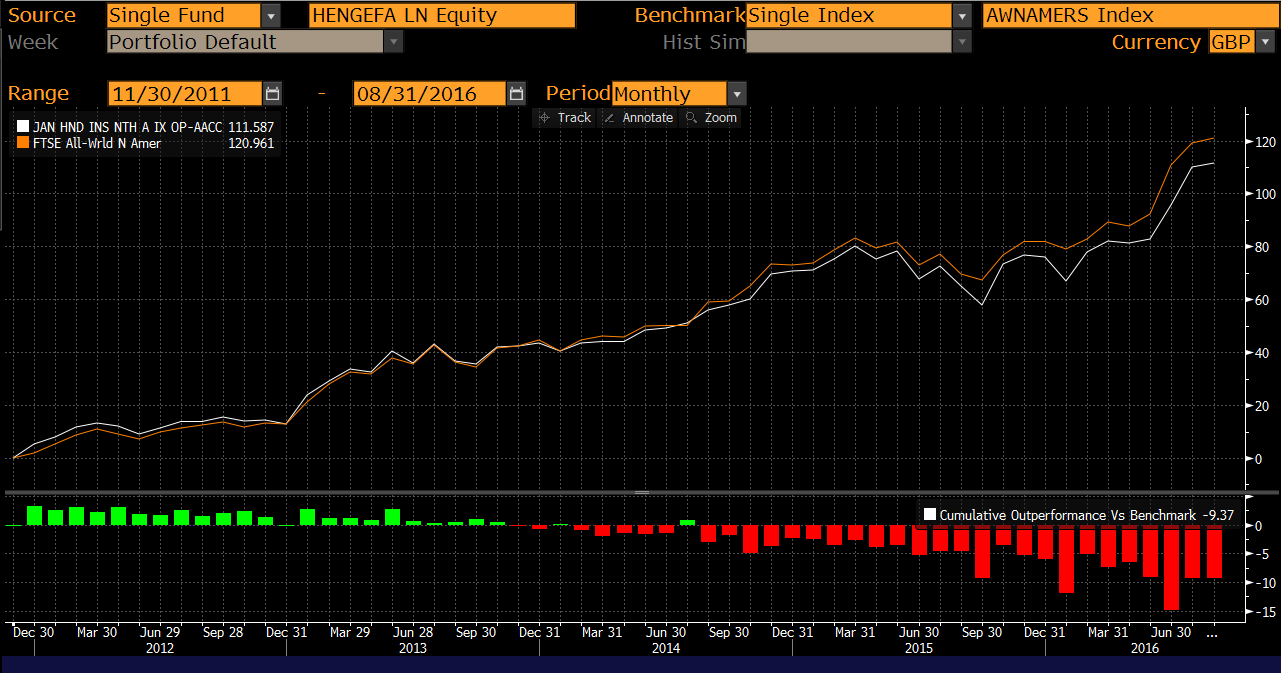 Source: Bloomberg, GBP terms, monthly data, vs selected index What happened after 2016? Based on our research, in 2016, the two offending funds were renamed. The Henderson Japan Enhanced Equity became the Henderson Institutional Japan Index Opportunities fund. The Henderson North American Enhanced Equity became the Henderson Institutional North American Index Opportunities. The retail AMC on these funds was reduced from 1.50% to 0.50%. Information on the two funds is presented in the table below. Fund particulars 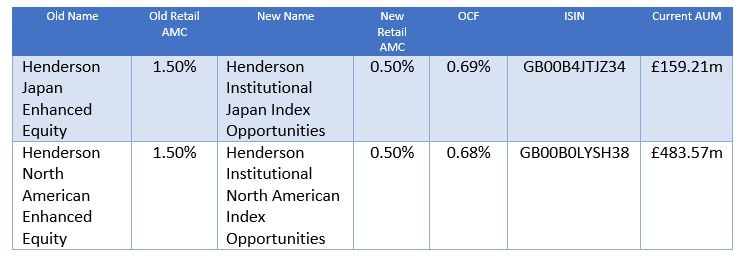 Note: Old name and old retail AMC is pre 2016 changes. New name, new retail AMC and new OCF is as at April 2019. AUM as at November 2019. Source: See fund provider data for each fund here and here Fined for being a closet index fund? The fine is for not treating customers fairly, because for retail clients the change in strategy was not communicated and fees were left unchanged. This contrasts to the treatment of institutional clients, where changes were communicated and fees were offered to be waived. The fine is therefore for leaving retail investors thinking they were invested in active fund even though it had – deliberately – become a closet tracker. Is the first fine for closet indexing in the UK? No, the FCA led the way in 2018 and issued the first fine in Europe for closet index funds, fining a number of unnamed fund houses £34m to compensate clients invested in closet index funds. What’s different this time is that both the manager and the specific funds have been “named and shamed”. How can you tell if an active fund is a closet tracker There are a number of metrics used such as active share, tracking error and R-squared that have been set out by ESMA. On that basis, between 5-15% of all funds offered in Europe could be deemed closet index funds. How was the fine worked out? The total fine was £2.7m, based on £5.8m revenues during the period, but a 30% discount was applied based on Henderson’s cooperation resulting in a £1.9m fine. £1.8m of this fine represents compensation to affected clients, based on the difference in fees paid by retail investor between the two Henderson funds and similar passive products. How can we evaluate a “closet index” fund? There is no defined formula for evaluating a closet index fund. Some measures look at active share, others at a combination of active share, tracking error and correlation. In our view, a closet index fund will have zero or negative alpha, a beta to its index that is close to 1.0x and a high correlation between the fund and the index. Negative alpha means the fund underperforms the index. Beta close to 1.0x means that the fund moves in tandem with the index. Correlation close to 100% means the behaviour of the fund is similar to the index. In terms of similarity to the index, we can see the following metrics for the period under review: Henderson Japan Enhanced Equity (old name) Alpha: -0.198% Beta: 1.033 Correlation: 95.6% Source: Elston research, Bloomberg data, 1-Nov-11 to 31-Aug-16, monthly data Henderson North American Enhanced Equity (old name) Alpha: -0.137% Beta: 1.052 Correlation: 90.0% Source: Elston research, Bloomberg data, 30-Nov-11 to 31-Aug-16, monthly data Investor awareness The fines are helping to increase investor awareness of the closet indexing issue, and we expect long-only retail active managers to remain under scrutiny. Find out more Read the FCA’s final notice Disclosure: I/we have no positions in any stocks mentioned, and no plans to initiate any positions within the next 72 hours. I wrote this article myself, and it expresses my own opinions. I am not receiving compensation for it. I have no business relationship with any company whose stock is mentioned in this article. Additional disclosure: Additional disclosure: This article has been written for a UK audience. Tickers are shown for corresponding and/or similar ETFs prefixed by the relevant exchange code, e.g. “NYSEARCA:” (NYSE Arca Exchange) or “LON:” (London Stock Exchange). For research purposes/market commentary only, does not constitute an investment recommendation or advice, and should not be used or construed as an offer to sell, a solicitation of an offer to buy, or a recommendation for any product. This blog reflects the views of the author and does not necessarily reflect the views of Elston Consulting, its clients or affiliates. For information and disclaimers, please see www.elstonconsulting.co.uk Photo credit: as per specified source; Chart credit: as per specified source; Table credit: as per specified source. All product names, logos, and brands are property of their respective owners. All company, product and service names used in this website are for identification purposes only. Use of these names, logos, and brands does not imply endorsement. |
ELSTON RESEARCHinsights inform solutions Categories
All
Archives
July 2024
|
 RSS Feed
Company |
Solutions |
|