
 Central Banks' policy rates are expected to pivot towards cuts in 2024 with a material impact on asset class perspectives.
Read the full article in FT Adviser 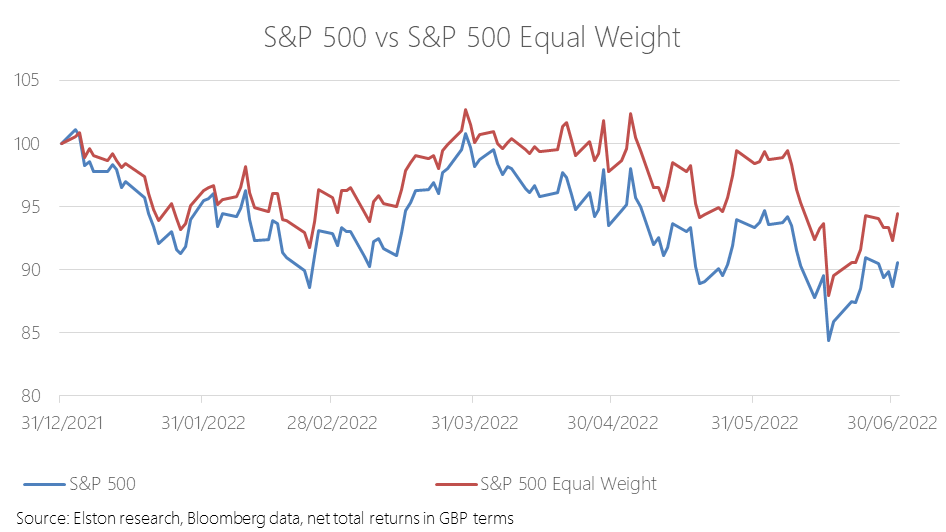 [5 min read, open as pdf for full article]
Critics of tracker funds often flagged concentration risk or the “big get bigger” approach of passive investing as a structural flaw to index investing. But concentration risk is a choice, not an obligation for the index investor. As would be expected, an equal weight approach has proved relatively more defensive in the down-market year-to-date. The S&P500 Equal Weight index has returned -5.2% against the traditional S&P 500’s -9.3% YTD, in GBP terms. For more on this topic, please see our CISI-endorsed CPD webinar: The curious power of equal weight, with guest speaker Tim Edwards, Managing Director, Index Investment Strategy, S&P Dow Jones Indices 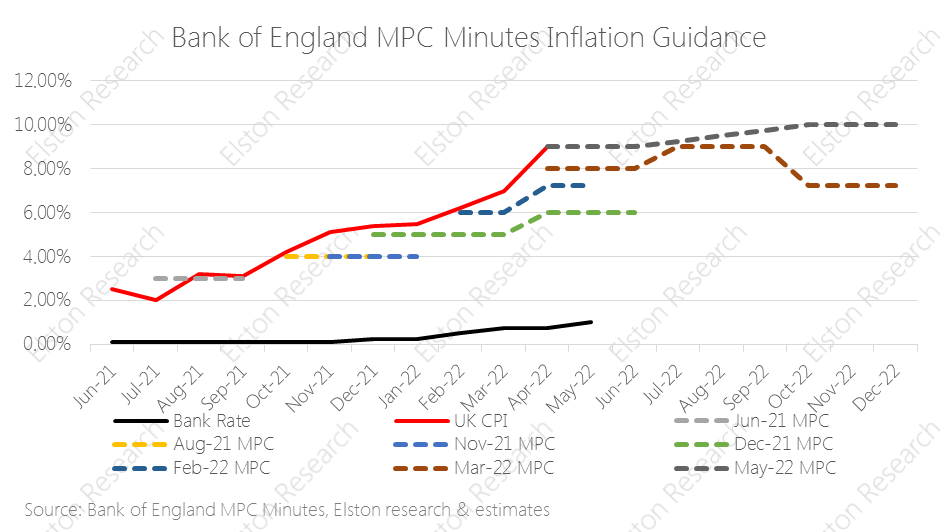 [5 min read, open as pdf]
Inflation hits 40 year high UK inflation figures came out today with a print of +9.0%yy (April), from +7.0% (March) and slightly below +9.1%yy consensus estimate. This is the highest level in 40 years, putting renewed focus on the “cost of living crisis”. Rising energy and food costs are the primary drivers, linked to the sanctions regime and the Russia/Ukraine war. The Bank of England has been “behind the curve” as regards to inflation risk. A look at inflation guidance contained in recent Monetary Policy Committee (MPC) minutes shows. Near-term inflation guidance has consistently under-estimated inflation since August 2021 – rising from “above 2%”, to 4%, 6%, 8%,, 9% and now 10%. Read full article with charts 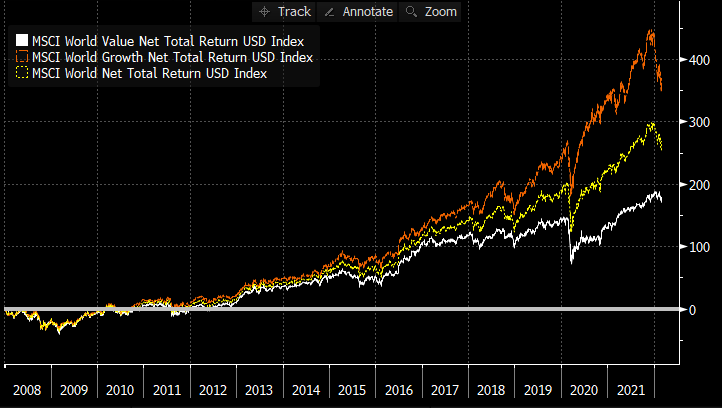 [5 min read, open as pdf]
The “great rotation” to Value began towards the end of 2020 as inflation fears came into focus. It has been rewarded. Since Dec 2020, the MSCI World Value factor has delivered +21.43% returns to 25th February 2022 compared to +7.70% return for Growth factor and +14.78% for the parent MSCI World index (a traditional market-cap based index), all in GBP terms. If we look back further at relative performance since end 2007 to 25-Feb-22, we can see that Value’s underperformance relative to Growth is still material. Over that period, Growth returned +369% (11.54%pa), compared to +179% (7.52%pa) for Value, and +268% (9.63%pa) for traditional market-cap based world equities, in GBP terms. On this basis, the re-rating of Value, relative to Growth, has room to run in the face of a persistent inflationary regime. Read full article with charts Watch our CISI-accredited CPD on an Introduction to Factor Investing 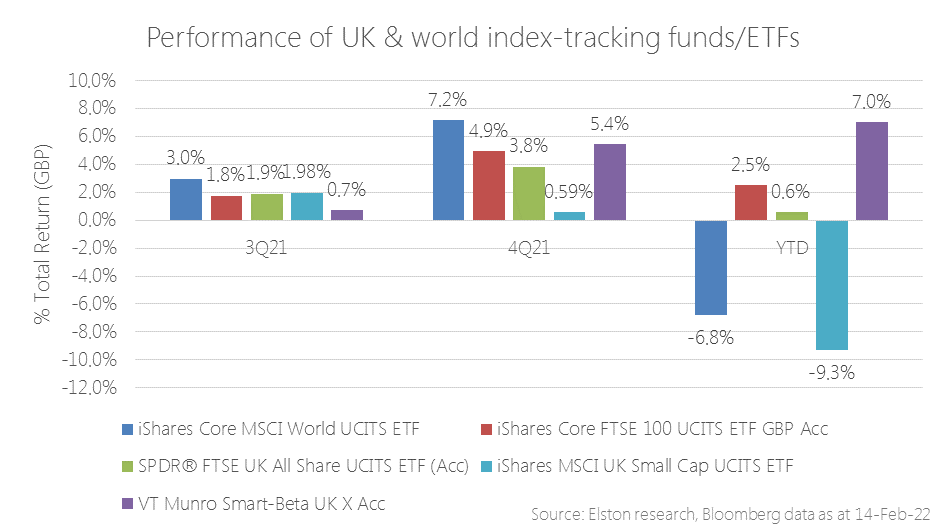 [3min read, open as pdf]
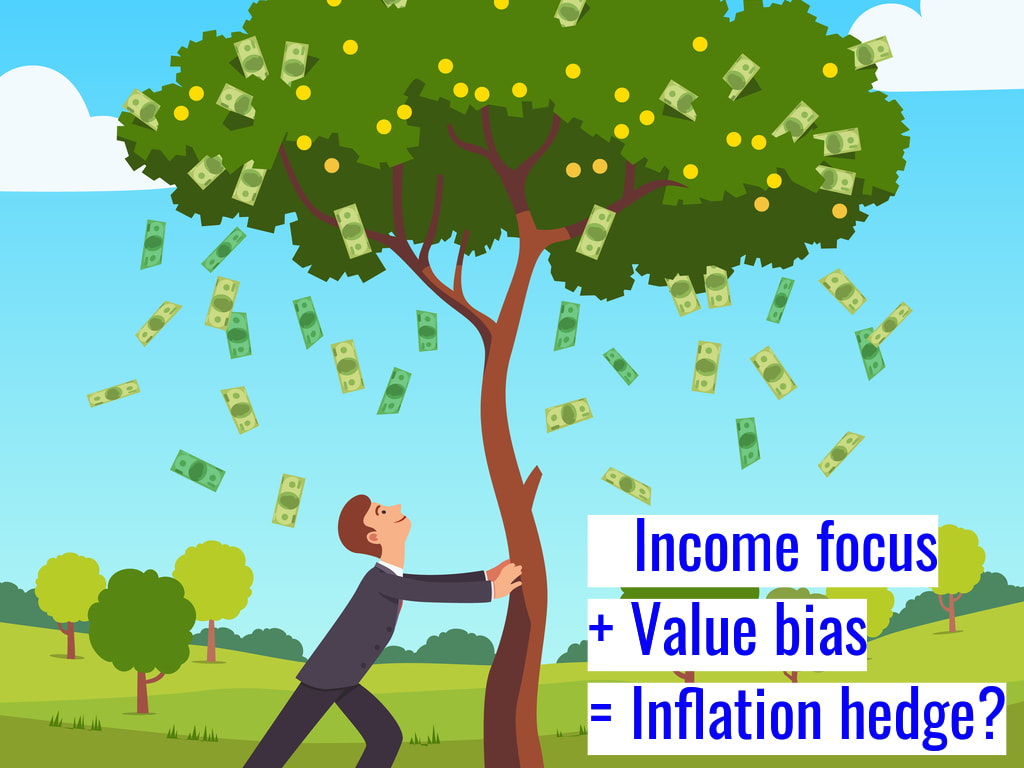
Value/Income bias for inflation protection In our 2022 outlook, we explained why inflation will remain hotter for longer and will settle above pre-pandemic levels. Within equities, we outlined our rationale for being overweight Value-factor equities with an Income bias to shorten equity duration. This built on our May 2021 view on UK equity income providing a helpful inflation hedge. The rapidity and severity of market movements against the prospect of faster-than-expected inflation and greater-than-expected interest rate tightening have only served to reinforce these views, as reflected by performance. Whereas world equities have struggled year to date, UK equities have been a relative bright spot. Within UK equity index exposures, indices that focus on dividends (with an inherent value bias), over size (market cap) have delivered best results. Our Smart-Beta UK Dividend Index [ticker ELSUKI Index] has delivered positive returns YTD ahead of more mainstream UK equity indices, driving the absolute and relative returns of the VT Munro Smart-Beta UK Fund, which is benchmarked to this index[1]. Read full article as pdf [1] Note & Commercial Interest Disclosure: Elston Indices is the benchmark administrator for the Freedom Smart-Beta UK Dividend Index, to be renamed the Elston Smart-Beta UK Dividend Index with effect from 1st March 2022. The VT Munro Smart-Beta UK Fund is benchmarked to this index.  [5 min read, open as pdf]
In our 2022 outlook, we explained why inflation will remain hotter for longer and will settle above pre-pandemic levels. Advisers should consider how to adapt portfolios for inflation across each asset class – equities, bonds and alternatives. Research demonstrates how different asset classes exhibit different degrees of inflation protection over different time-frames. Equities therefore provide a long-term inflation hedge.
In this article, we explore how to adapt portfolios for inflation within and across each asset class: Equities, Bonds and Alternatives. For full article, read as pdf 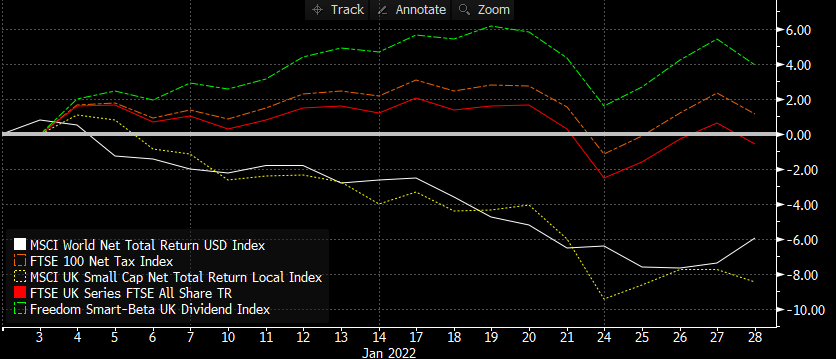 [7 min read, open as open as pdf]
Year to date performance The dispersion between styles and segments within equities is pronounced in the UK. Given recent market stress over the prospect of a rising interest rate environment, inflationary pressure, and geopolitical tensions, year-to-date performance underscores the relative resilience of equities with a Value/Income bias relative to other UK equity segments and world equities. Year to date, world equities are down -5.93%, the FTSE All Share is flat at -0.55%. UK Small Caps are down -8.49%, the FTSE 100 is +1.14% and UK Equity Income (Freedom Smart-Beta UK Dividend Index) is +3.97%. This is because returns are underpinned by dividend income as well as exposure to energy and financials which benefit respectively from a high oil price/rising rate environment. Read in full as pdf  [3 min read, open as pdf]
2021 in review Our 2021 market roundup summarises another strong year for markets in almost all asset classes except for Bonds which remain under pressure as interest rates are expected to rise and inflation ticks up. Listed private equity (shares in private equity managers) performed best at +43.08%yy in GBP terms. US was the best performing region at +30.06%. Real asset exposures, such as Water, Commodities and Timber continued to rally in face of rising inflation risk, returning +32.81%, +28.22% and +17.66% respectively. 2022 outlook We are continuing in this “curiouser, through-the-looking glass” world. Traditionally you bought bonds for income, and equity for risk. Now it’s the other way round. Only equities provide income yields that have the potential to keep ahead of inflation. Bonds carry increasing risk of loss in real terms as inflation and interest rates rise. Real yields, which are bond yields less the inflation rate, are negative making traditional Bonds which aren’t linked to inflation highly unattractive. Bonds that are linked to inflation are highly sensitive to rising interest rates (called duration risk), so are not attractive either. How to navigate markets in this context? The big three themes for the year ahead are, in our view:
See full report in pdf Attend our 2022 Outlook webinar 
Inflation is proving more persistent than transitory. In an inflationary environment, Value style investing has the potential for continued outperformance relative to other factors. For UK fund investors, actively managed funds with a value-oriented philosophy, UK equity income funds with an inherent value bias and Value-factor index funds/ETFs offer ways of increasing allocation to Value within a portfolio. Read the article (5 min read) Watch the webinar 
The era of quantitative easing programmes have had a distorting effect on markets since the 2008 financial crisis has given value investors a torrid time in the past decade. The near-constant sugar-rush of liquidity has served to de-link valuations from underlying fundamentals prompting a huge bias towards growth. While pockets of investors have been braced for a long-expected correction that has never really materialised, the recent sharp increase in inflation may constitute an inflection point of sorts. In inflationary periods and when interest rates rise, the time horizon for future discounting shrinks, leaving equities exposed. Income-yielding shares have an inherent value-bias, owing to the types of company that pay steady dependable dividend). This provides a measure of inflation protection both in absolute terms and relative to nominal bonds. Read the full article Watch the webinar  [10 min read, open as pdf]
 [3 min read, open as pdf] Inflation is on the rise: equities provide long-term inflation protection Inflation risk means greater focus on intrinsic value such as dividends UK equities with value and/or income bias are attractive Inflation is on the rise, and whilst it’s broadly accepted that equities can provide a long-term inflation hedge, which kind of equities are best positioned to provide this. Since the financial crisis, Value investors have been jilted by a market love affair with Momentum. The switch back to Value was already being called on purely a valuation basis since late 2019. But the rekindling of inflation risk in the market is only making companies with a Value-bias and a progressive quality income stream back in the spotlight. What is quality income? Quality means persistency, focusing on companies that regularly pay a stable or increasing dividend, whilst mitigating dividend concentration risk. “One of the most persuasive tests of high quality is an uninterrupted record of dividend payments going back many years.” Benjamin Graham Indeed, research suggests that Dividends are a key anchor of Total Returns, although this differs from market to market. 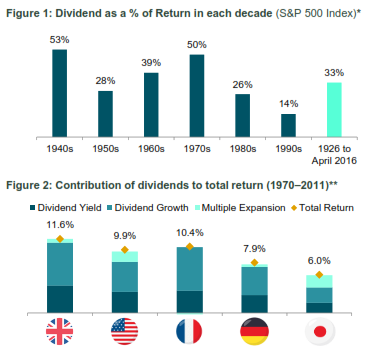 Figure 1: Source: S&P Dow Jones Index Research August 2016
Figure 2: Source: JP Morgan, The Search for Income: A Global Dividend Strategy, 2012 How then to screen for companies that can deliver this type of strategy? Is it just about yield? We don’t think so. High yield is not high quality Screening for high dividend yield alone can lead to “value-traps” that negatively impact performance. The poor performance is because those high-yielding companies might be poor businesses with unstable dividends. Market cap weight or Dividend contribution weight Traditional equity indices are market-capitalisation weighted. The resulting dividend income for an index is therefore a function of each company’s size. An alternative approach is to weight the holding in each company by its contribution to overall dividends. This way the index is focused on the biggest dividend payers, rather than the biggest companies by size. This creates a direct bias towards Yield, and an indirect bias towards Value, from a factor-exposure perspective. Forward- or backward-looking Active equity income managers typically look at forward-looking dividend estimates. Index-based “passive” equity income strategies often look at historic dividend yield for ranking purposes. This is sub-optimal. We believe that index strategies that focus on equity income should use forward-looking estimates, to systematically capture upswings in earnings and dividend estimates. Equities as an inflation hedge It’s broadly accepted that equities can provide a long-term inflation hedge. But what kind of equities are likely to perform well in an inflationary regime? We believe there are three characteristics:
Why the Value focus in inflationary environment? When the two major styles of investing are compared, i.e., growth and value investing, the latter style rejects the efficient market hypothesis and choses an equity with lower expectations, which is often undervalued and would profit quickly when the market adjusts itself. During an inflationary environment, economic concepts direct that the ‘time value of money’ has a major role to play. Thus, an equity today, becomes of greater value, when compared to its worth tomorrow. Hence, value investing seems attractive in an inflationary world since the investors are less willing to pay up for future earnings and can regain their money sooner rather than later, when compared to growth investing. (Murphy, 2021) With a global pandemic, many predicted deflation as a threat; however, with the counter-balancing forces, investors soon realized inflationary threat. (Baron, 2021). Rising inflation is good for value investing for a number of reasons. In general, equity markets are dynamic and display a stronger corelation to inflationary environment, this lays a very strong premise that higher inflation and stronger earnings are co-dependent. Financially speaking, Sectors such as energy, financial are major drivers of the major economic growth. A rise in these value stocks tends to pace up the overall economic growth, thus outperforming others. (Lebovitz,2021) According to JP Morgan’s chief strategist, the change in investing style, this time around could be a more impactful due to several factors such as the failure of monetary and fiscal policies whilst recovering from a pandemic. (Ossinger, 2021) Dividends, dividends, dividends: a tried and tested approach The most fundamental explanation, by John Kingham, a value investor, states that a dividend discount model, attempts to find the true value of the stock, under any market circumstances and focuses on the dividend pay-out factors and the market expected returns. Historically, the companies with dividend have generated higher returns when compared to companies which either have no dividend or eliminated the dividend. (Park and Chalupnik, 2021) This means that dividends hold value when it comes to the total return of the portfolio. Moreover, with the market getting more and more inflationary, and equities getting exposed. Adding companies which can provide returns even in a low growth environment can create a sustainable portfolio. Government bonds have not performed well with rising inflation (Baron,2021) High yielding corporate bonds offered better protection compared to government gilts since these inflations linked bonds add value in-line with RPI Inflation according to Barclays Equity Guilt Study and can protect investors from unexpected inflation, yet they are still not considered as a safe haven like government gilts. (Dillow,2021) Investment manager of Iboss Chris Rush recently told Portfolio Adviser that in order to reduce the inflationary shock the firm had already reduced its positions from treasures and gilts and incorporated strategic bonds They also plan on holding a short duration fixed income. (Cheek, 2021) Although, it might have not been the fundamental goal, over the past several decades until 2017 dividends reported 42% of the S&P 500 Index’s total return. The global recession and now pandemic have created a lack of stability for the layer of support for future returns, however, analysts have assured there is room for recovery. (Markowicz, 2021) Summary Whether transitory or persistent, with inflation on the rise, there is a strong rationale for having an allocation to Value from a factor-exposure perspective. Those value-type firms that generate and pay a progressive dividend policy provides a level of inflation protection both in absolute terms and relative to bonds that is more than welcome, and potentially essential. Henry Cobbe & Aayushi Srivastava  [2 min read, open as pdf]
A Factor-based approach to investing Factor-based investing means choosing securities for an inclusion in an index based on what characteristics or factors drive their risk-return behaviour, rather than a particular geography or sector. Just like food can be categorised simply by ingredients, it can also be analysed more scientifically by nutrients. Factors are like the nutrients in an investment portfolio. What are the main factors? There is a realm of academic and empirical study behind the key investment factors, but they can be summarised as follows The different factors can be summarised as follows:
Which has been the strongest performing factor? Momentum has been the best performing factor over the last 5 years. Value has been the worst performing factor. Fig.1. World equity factor performance 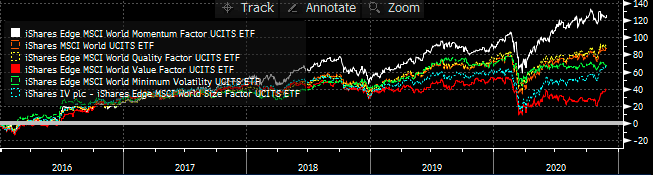 Source: Elston research, Bloomberg data A crowded trade? Data points to Momentum being a “crowded trade”, because of the number of people oerweighting stocks with momentum characteristics. This level of crowdedness can be an indicator of potential drawdowns to come. Fig.2. Momentum Factor is looking increasingly crowded 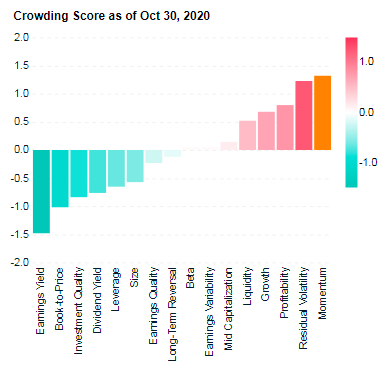 Source: MSCI Factor Crowding Model The best time to buy into a Momentum strategy has been when it is uncrowded – like in 2001 and 2009, which is also true of markets more generally. MSCI’s research suggests that with crowding scores greater than 1 were historically more likely to experience significant drawdowns in performance over subsequent months than factors with lower crowding scores. Fig.3. Factors with higher crowding score can be an indicator of greater potential drawdowns, relative to less crowded factors 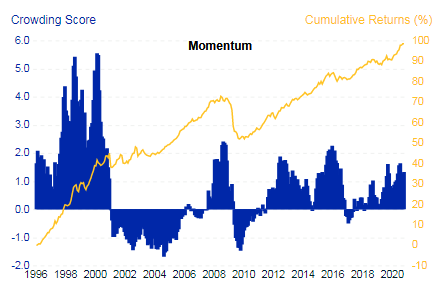 Source: MSCI Factor Crowding Model
Rotation to Value The value-based approach to investing has delivered lack lustre performance in recent times, hence strategists’ calls that there may be a potential “rotation” into Value-oriented strategies in coming months as the post-COVID world normalises. But can factors be timed? Marketing timing, factor timing? Market timing is notoriously difficult. Factor timing is no different. To get round this, a lot of fund providers have offered multi-factor strategies, which allocate to factors either statically or dynamically. Whilst convenient as a catch-all solution, unless factor exposures are dynamically and actively managed, the exposure to all factors in aggregate will be similar to overall market exposure. This has led to a loss of confidence and conviction in statically weighted multi-factor funds. Summary Factors help break down and isolate the core drivers of risk and return.
For more on Factor investing, see https://www.elstonsolutions.co.uk/insights/category/factor-investing https://www.msci.com/factor-investing |
ELSTON RESEARCHinsights inform solutions Categories
All
Archives
July 2024
|
 RSS Feed
Company |
Solutions |
|