
 [2 min read, open as pdf]
A Factor-based approach to investing Factor-based investing means choosing securities for an inclusion in an index based on what characteristics or factors drive their risk-return behaviour, rather than a particular geography or sector. Just like food can be categorised simply by ingredients, it can also be analysed more scientifically by nutrients. Factors are like the nutrients in an investment portfolio. What are the main factors? There is a realm of academic and empirical study behind the key investment factors, but they can be summarised as follows The different factors can be summarised as follows:
Which has been the strongest performing factor? Momentum has been the best performing factor over the last 5 years. Value has been the worst performing factor. Fig.1. World equity factor performance 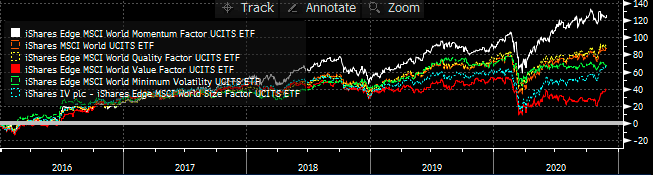 Source: Elston research, Bloomberg data A crowded trade? Data points to Momentum being a “crowded trade”, because of the number of people oerweighting stocks with momentum characteristics. This level of crowdedness can be an indicator of potential drawdowns to come. Fig.2. Momentum Factor is looking increasingly crowded 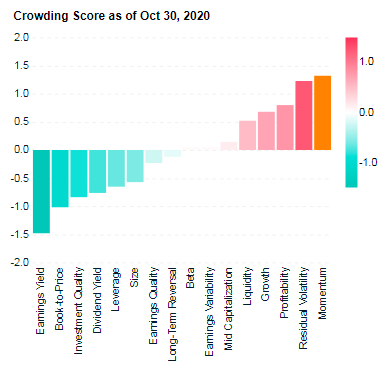 Source: MSCI Factor Crowding Model The best time to buy into a Momentum strategy has been when it is uncrowded – like in 2001 and 2009, which is also true of markets more generally. MSCI’s research suggests that with crowding scores greater than 1 were historically more likely to experience significant drawdowns in performance over subsequent months than factors with lower crowding scores. Fig.3. Factors with higher crowding score can be an indicator of greater potential drawdowns, relative to less crowded factors 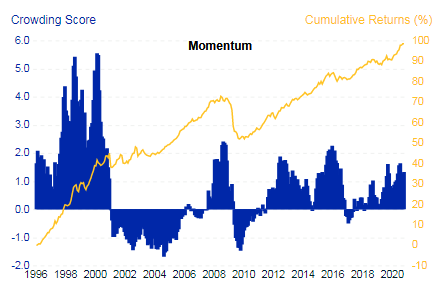 Source: MSCI Factor Crowding Model
Rotation to Value The value-based approach to investing has delivered lack lustre performance in recent times, hence strategists’ calls that there may be a potential “rotation” into Value-oriented strategies in coming months as the post-COVID world normalises. But can factors be timed? Marketing timing, factor timing? Market timing is notoriously difficult. Factor timing is no different. To get round this, a lot of fund providers have offered multi-factor strategies, which allocate to factors either statically or dynamically. Whilst convenient as a catch-all solution, unless factor exposures are dynamically and actively managed, the exposure to all factors in aggregate will be similar to overall market exposure. This has led to a loss of confidence and conviction in statically weighted multi-factor funds. Summary Factors help break down and isolate the core drivers of risk and return.
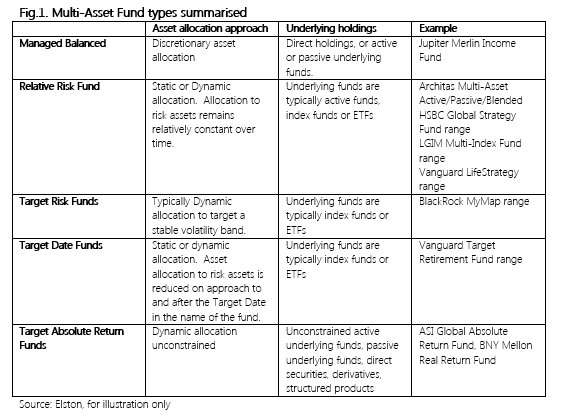
For more on Factor investing, see https://www.elstonsolutions.co.uk/insights/category/factor-investing https://www.msci.com/factor-investing  [7 min read, open as pdf] Whether or not investors enjoy creating and managing their own ETF portfolios, ready-made portfolios and funds of ETFs and index funds offer a convenient alternative In this series of articles, I look at some of the key topics explored in my book “How to Invest With Exchange Traded Funds” that also underpin the portfolio design work Elston does for discretionary managers and financial advisers. Who needs or wants a ready-made portfolio? Individual investors of all wealth levels may find the prospect of engaging with their investment daunting, time-consuming, or both. This is heightened by the high number of investment products and services available. In the UK, there are over 70 discretionary management firms, and over 3,000 investment funds and ETFs. For this reason, DIY investors may want ready-made portfolios that are an easy-to-buy and easy-to-own investment. Not only do these solutions look like a simple alternative but they can also address and can potentially mitigate behavioural mistakes. We look at three alternative ways of delivering ready-made portfolios for DIY investors in more detail: multi-asset funds, ETF portfolios and multi-asset ETFs. Multi-Asset Funds Multi-Asset Funds (also known as Asset Allocation Funds or Multi-Manager Funds) are the most established type of ready-made portfolios. By owning a single fund (or in some cases an investment trust), investors get exposure to a diversified portfolio of underlying funds to reflect a specific asset allocation. This means that having selected a strategy, the investor does not need to worry about asset allocation, or about the portfolio construction to achieve that asset allocation, or about security selection within each asset class exposure. We categorise Multi-Asset Funds into different categories by investment strategy:
 Despite the cost of wrapping underlying funds within a fund structure, economies of scale mean that Multi-Asset Funds can be delivered to investors at highly competitive price points with very low minimums. However, the disadvantage is that Multi Asset Funds have a one-size-fits-all approach that means there is little scope for customisation to the individual needs and characteristics of the investor’s objectives and constraints. ETF Portfolios ETF Portfolios are basket of individual ETFs providing an asset allocation. Rather than wrapping an investment strategy within a fund, a model portfolio is made available as a basket of ETFs that can be bought individually to create the strategy. Model portfolios may be “strategic” (rebalanced to fixed weights of the same securities) or “tactical” (rebalanced to changing weights of the same or different ETFs). Model portfolios are research portfolios meaning that the model portfolio provider has no control of client assets so it is up to a portfolio manager, adviser or DIY investor to implement any changes should they wish to follow a given model portfolio strategy. The advantages of ETF Portfolios include: firstly, potentially lower fees owing to removal of a fund wrapper to hold the strategy; secondly greater flexibility and specificity with regards to asset allocation design; and lastly agility as strategies can be launched or closed with ease. An example of an ETF Portfolio could be as simple as a classic global 60/40 Equity/Bond strategy constructed with ETFs. 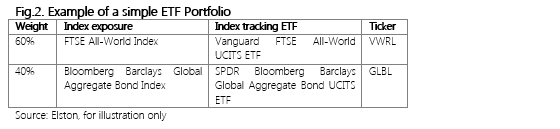 Whilst ostensibly very simple – a two security portfolio – the underlying holdings of each ETF means that investors get exposure to 3,133 equities in global and developed markets (approximately 47 countries) and 1,660 investment grade bonds in over 24 countries. Put simply, the investor is able to buy the bulk of the global equity and bond markets with two simple trades. When manager, advisers or research firms create model portfolios, the weighting scheme can be one of three types as summarised in the table below. 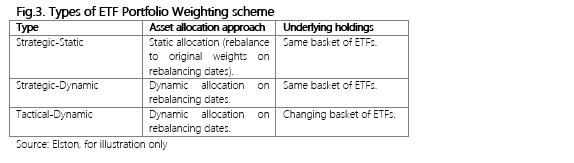 The ability to design and create ETF Portfolios with an increasing number of ETF building blocks means that both traditional (asset managers, stock brokers) and non-traditional providers (e.g. trade publications, investment clubs, industry experts) can create investment strategies that can be “followed” by investors. However, the usual due diligence rules for any investment provider should be applied as regards their investment process. Whilst the rise of more bespoke ETF strategies is welcome, the convenience of having a single strategy delivered as a single security from a portfolio construction perspective is attractive. This is where Multi-Asset ETFs could have a role to play. Multi-Asset ETFs Multi-Asset ETFs are an emerging way of delivering the returns of a managed ETF Portfolio using a single instrument. Whereas multi-asset funds are often funds of index-tracking funds, Multi-Asset ETFs can be viewed as an “ETF of ETFs”. In the US, there are a number of multi-asset ETFs available providing a ready-made allocation within a single trade. In the UK, there are currently only two ranges of multi-asset ETFs available. Multi-Asset Infrastructure (launched April 2015) SPDR® Morningstar Multi-Asset Global Infrastructure UCITS ETF ESG Multi-Asset ETFs (launched September 2020) BlackRock ESG Multi-Asset Conservative Portfolio UCITS ETF (MACG) BlackRock ESG Multi-Asset Moderate Portfolio UCITS ETF (MAMG) BlackRock ESG Multi-Asset Growth Portfolio UCITS ETF (MAGG) We expect multi-asset funds, constructed with ETFs and index funds, to gain more traction than multi-asset ETFs because as a “buy and hold” ready-made portfolio multi-asset funds do not need the intraday dealing availability that ETFs provide. Multi-asset funds (constructed with index funds/ETFs), ETF Portfolios, and Multi-asset ETFs provide a ready-made one stop for delivering a multi-asset investment strategy for all or part of an investment portfolio, whether defined by a multi-asset index or not. The advantages of a multi-asset fund of ETFs as a ready-made portfolio The advantages of a “one and done” approach include collectivisation, convenience and consistency. Firstly, is collectivisation of investor’s by objective which creates cost efficiency from the economies of scale. Adopting a collectivised approach, can be done where each group of clients shares the same goal (as defined by, for example, a target risk level or income objective, or volatility objective or target date). This can help achieve economies of scale and lower the cost of offering professionally managed asset allocations in at least three different ways. Firstly, each cohort becomes a multi-million pound ‘client’ of an asset manager who can deploy institutional-type bargaining power on the pricing of the underlying funds within their asset allocation. Secondly, the collective scale reduces frictional trading costs of implementing the asset allocation decisions: one managed investment journey is more efficient to manage and deliver than thousands of individual ones. Finally, by focusing on actively managing the asset allocation as the main determinant of the level and variability of returns[1] the asset allocation can be implemented with index-tracking ETFs to keep costs down. Secondly is convenience. Rather than focusing solely on building optimal multi-asset class portfolios that need monitoring, the proposition of investment offerings can be engineered to eliminate poor behavioural tendencies that prevent effective management. Engineering funds so that they offer a single investment journey which investors do not necessarily need to monitor regularly in order to reach their goals can help reduce the perceived hassle of investing. This can motivate individuals to invest. Such professionally managed funds prevent investors from either not rebalancing the portfolio or doing it in an improper fashion due to behavioural tendencies such as status quo bias[2] and disposition effect[3]. Furthermore, a professionally managed strategy can respond to other risks aside from market risk such as shortfall, concentration or longevity risks which lay investors can overlook. An additional advantage of offering managed diversified funds is that it automatically curtails the number of products offered, thereby reducing cognitive load of making an investment decision and can prevent decision deferral.[4] Finally is consistency. Investors in each strategy experience the same time-weighted investment returns thereby reducing the likely dispersion of returns that a group of investors would experience through an entirely self-directed approach. This consistency is why multi-asset funds have also been adopted by some financial advisers as a core or complete holding within a centralised investment proposition. The disadvantage of a ready-made portfolio are not secret. They are designed as a “one-size-fits-all” product with no scope for customisation. The respective features of the various types of ready-made portfolio are set out below. Whereas multi-asset funds of ETFs, and multi-asset ETFs can be accessed via a single trade, their scope for customisation is low. ETF Portfolios have the highest degree of flexibility for creating custom strategies, but are not accessible via a single trade. 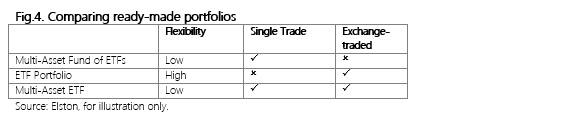 Summary Ready-made portfolios are easy to buy and easy to own. They enable a “set and forget” approach to investment management which can help design out key behavioural risks, or provide a useful core holding to a broader strategy. Obviously the primary choice is which strategy an investor must choose, or their adviser should recommend depending on their risk-return objectives and suitability considerations. [1] Ibbotson, “The Importance of Asset Allocation.” [2] Samuelson and Zeckhauser, “Status Quo Bias in Decision Making.” [3] Shefrin and Statman, “The Disposition to Sell Winners Too Early and Ride Losers Too Long”; Weber and Camerer, “The Disposition Effect in Securities Trading.” [4] Iyengar and Jiang, “How More Choices Are Demotivating”; Iyengar, Huberman, and Jiang, “How Much Choice Is Too Much?”  [7 min read, open as pdf] Fee pressure is here to stay. In the “race to the client” being run by platforms, DFMs and fund houses, it’s up to advisers to rethink their business model, and make sure they stay in the lead. In this series of articles, I look at some of the key topics explored in my book “How to Invest With Exchange Traded Funds” that also underpin the portfolio design work Elston does for financial advisers. Fee pressure is here to stay Between competition, regulation and ultra-low interest rates, there is understandable and justified pressure on costs. Looking at the overall “value chain” – the cost of advice, platform, discretionary manager, and underlying funds – means that without careful scrutiny, investing a pension or an ISA ends up meaning its client money risked for the financial service industry’s reward. With these “all-in” costs sometimes as high as 2.50%-3.00%, the situation is untenable, particularly when contrasted with non-advised workplace pensions and non-advised d2c solutions that can deliver a manager multi-asset investment solution at an all-in (excluding advice) cost of 0.50-0.75%. Put simply, if we imagine a price anchor/price cap of 0.75% for workplace and pathway-style non-advised investments, there is effectively a soft-price cap of 1.75% for advised investments, in our view, from a Value for Money perspective. MiFID II has been a tremendous driver of total cost transparency, and has sharpened the minds, and the pencils, of clients and advisers alike. The cost of delivering investment solutions (excluding advice) differs vastly depending on whether accessed via advised, workplace and non-advised channels (see Fig.1.). This is not sustainable. 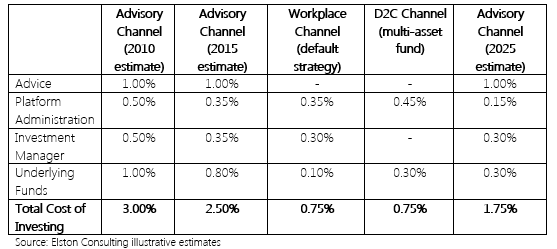 Changing landscape
Given the inevitability of fee pressure and a steadily shrinking pie, there are three key trends emerging:
The Race to the Client Sustained fee compression across the value chain, means that there is a growing awareness amongst providers within the industry that their position in the value chain can be commoditised. That’s why there is so much corporate activity and proposition change from all the different parties within the value chain. Fund houses are investing in platforms, platforms are setting up advice firms, and advice firms are setting up DFMs. All of these parties are afraid of watching their products or services being commoditised, and hence many want to move to a vertically integrated model. I call this the “Race to the Client”. And yet at the end of the day, there is only relationship that matters and that cannot be commoditised. And that’s one of trust and personality which makes up the relationship between the adviser and their client. Control of the value chain: who has the power? Whilst some fund houes see advisers as “Distributors”, the truth is now the opposite. Instead of being price takers, advisers are becoming price setters. In the race to the client, advisers are and should aim to stay in the lead. But only if they take control of the value chain and align it to their clients’ best interests. Next generation advisers are no longer fund pickers, or model pickers, or manager pickers: they are fiduciaries who owe a duty of care to their clients and help them navigate the maze of financial services to ensure good customer outcomes, and excellent value for money. The institutionalisation of retail As workplace schemes become more individualised, and individual schemes become more mass-market, the retail and institutional worlds are beginning to collide, and this “institutionalisation of retail” means a focus on greater governance, increased professionalism, at substantially lower end-client costs. Strategic options for advisers Advisers have a number of options to compress all-in costs, whilst enhancing their business model.
Stop feeding the hand that will bite you The race to the client is hotting up, and is all too visible from the M&A activity in the sector, and the rush of private equity capital into the UK advice market. And yet many adviser firms seem determined to feed the hand that’s going to bite them. Why use a DFM whose stated aim is to cut you out of the value chain, and who spends more on Facebook ads, than your entire turnover? Why use a fund house whose billboards at every station reach out to your clients to go direct? Why use a platform that prefers to offer accounts to customers directly? Looking after clients is the most valuable part of an adviser business. Don’t give them away to your larger, bigger branded competitors. Summary As the race to the client hots up, the good news for advisers is that you are already in the lead. So stop feeding your competitors – the DFMs, the fund houses, the platforms, and take back control of the value chain to ensure you can protect clients’ best interests. © Elston Consulting Limited All Rights Reserved  [3 minute read, open as pdf]
Dividend Concentration Risk Dividend Concentration Risk is the over-dependence of a portfolio on a handful of holdings to generate the overall portfolio income. Dividend Concentration Risk became even more apparent in 2020 when large cap companies suspended or cut their dividends. Too often, Dividend Concentration Risk has been looked at in hindsight rather than as part of ongoing due diligence and challenge to portfolio constructors. We look at potential evaluation metrics and conclude that a quantitative and qualitative approach makes most sense. Understanding dividend dependency We look at Contribution to Yield to understand the asset-weighted income generated by each underlying holding as a proportion of the overall yield of a portfolio. Thus a 5% weighting to a 4% yielding stock A (an asset weighted yield of 0.20%) will have a greater contribution to yield than a 3% weighting to a 6% yielding stock B (an asset weighted yield of 0.12%). For a portfolio with an overall yield of 3.0%, stock A has a 6.67% Contribution to Yield (0.20% / 3.0%) and Stock B has a 4.0% Contribution to Yield. For income investors, looking at a portfolio from the perspective of income-weighted Contribution to Yield is as important as looking at its asset-weighted allocation. Portfolios where there are a greater number of stocks with a higher Contribution to Yield are more dependent on those dividends than a portfolio where there are a greater number of stocks with a lower Contribution to Yield. Contribution to Yield is therefore a way of looking at the vulnerability of a portfolio to the idiosyncratic risks of specific stocks cutting or suspending their dividend. Fig.1. Contribution to Yield of the iShares FTSE 100 UCITS ETF 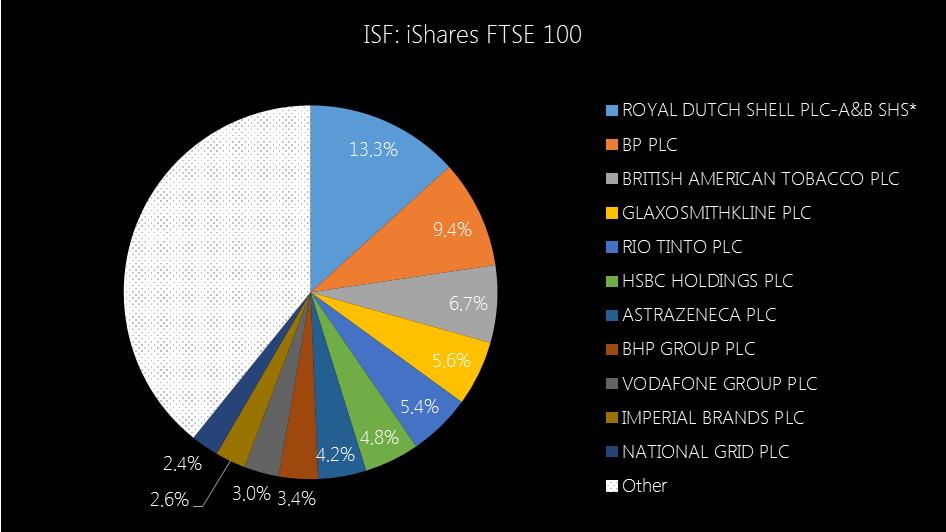 Source: Elston research, Bloomberg data. As at 30th June 2020 Screening & Weighting Screening methodologies and weighting schemes can substantially alter the components and concentrations of an income portfolio. For example, a fund using an index which ranks securities by their yield alone, such as the iShares UK Dividend UCITS ETF, will have a different composition to a fund that uses an index which ranks securities by their dividend consistency, such as the SPDR S&P UK Dividend Aristocrats UCITS ETF (UKDV). Fig.2. Contribution to Yield of the iShares UK Dividend UCITS ETF 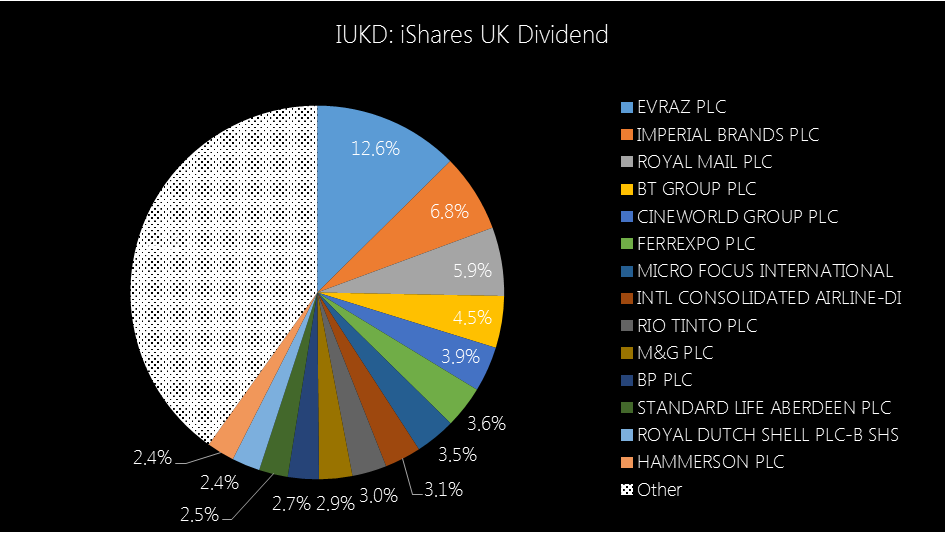 Source: Elston research, Bloomberg data. As at 30th June 2020 Fig.3. Contribution to Yield of the SPDR S&P UK Dividend Aristocrats UCITS ETF 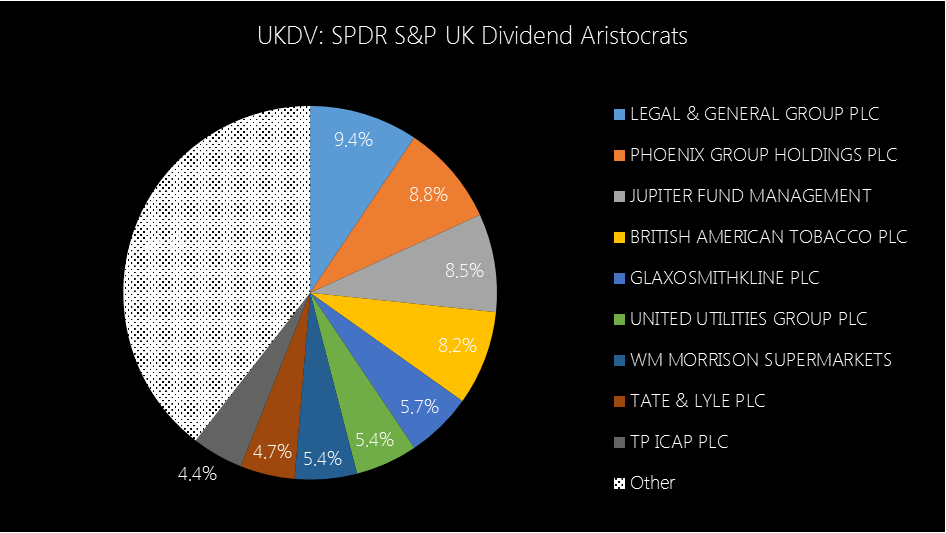 Source: Elston research, Bloomberg data. As at 30th June 2020 What about Concentration? We can look at what number of holdings contribute to a threshold level of income. For example, of the funds above it takes 11, 14 and 9 underlying holdings for ISF, IUKD and UKDV respectively to generate an ad hoc threshold, e.g. 60% of overall income. Another concentration metric would be to look at a Herfindahl-Hirschman Index (HHI) measure. This measure of concentration (the sum of the squares of each weighting) is typically used to assess market competitiveness for an industry, but could also be used as a measure of concentration of Contribution to Yield. For example, a portfolio with equally weighted Contributions to Yield of 5% would have a HHI score of 500 (less concentrated). A portfolio with equally weighted Contributions to Yield of 10% would have a HHI score of 1,000 (more concentrated). On this basis, the HHI score of Contributions to Yield for ISF, IUKD and UKDV are 484, 406 and 525 respectively, suggesting that UKDV is more concentrated, than ISF which is more concentrated than IUKD in relative terms. Nonetheless, in absolute terms, each of them are relatively unconcentrated (a score of >1,000 would imply high concentration). Fig.4. Dividend Contribution Concentrations (HHI Scores) 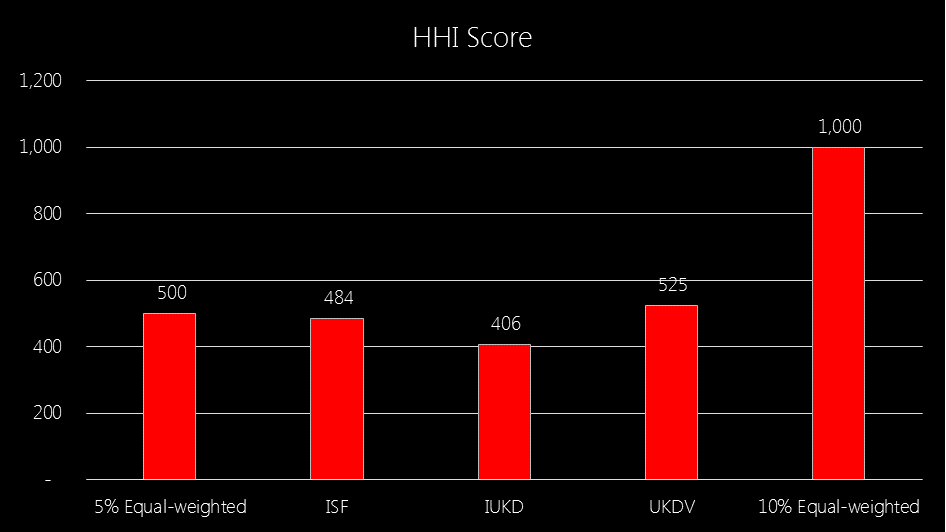 Source: Elston research, Bloomberg data. As at 30th June 2020
A quantitative and qualitative approach Whilst Contribution to Yield and concentration measures can provide a quantitative approach, it is the qualitative dimensions of dividend risk that are the key drivers to understanding and mitigating Dividend Concentration Risk. The qualitative dimensions include a company’s dividend history, its outlook based on its willingness (dividend policy) and ability (dividend cover) to pay and the underlying industry-specific exposures that are driving corporate earnings and dividend potential. It therefore makes sense to combine a quantitative and qualitative approach to portfolio constructing when considering dividend concentration risk. Mitigating dividend concentration risk Ways of mitigating Dividend Concentration Risk include:
View the structured CPD webinar on this topic  [7min read, open as pdf]
After deciding on an asset allocation and which funds or ETFs to populate it, how best to put the plan into action? All at once or in stages? If in stages, how many and for how long? Looking out for portfolio “drift” and the options for rebalancing. These implementation decisions can have far greater impact on the value of investments than picking the “right” fund or portfolio. In this series of articles, I look at some of the key topics explored in my book “How to Invest With Exchange Traded Funds” that also underpin the portfolio design work Elston does for discretionary managers and financial advisers. Implementation is the process of putting an investment strategy plan into action. Implementation is key to investment outcomes whether transitioning an existing portfolio from one strategy to another, or whether investing fresh capital. Implementing a new portfolio Having decided on an amount to invest, the next hardest decision is when and how to start investing. Your entry level will be directly impacted by the immediate direction (sequence of returns) from the day you invest. You could think the market is too high and wait but it could climb higher. You could think you’ve bought the dip only to be catching a falling knife that marks the start of a steady and protracted decline. Deciding the “right time” to move assets from cash into risk assets can be tricky but staying out of the market is much more costly in the long run. So how best to invest: with a lump sum, or gradually phased over time? Lump sum investing: in the very long run research suggests that investing with a lump sum delivers better returns in the long run (as capital is in the market for longer, despite near-term fluctuations). However in the short-run it can be a scary and stressful experience, particularly for new investors, if they see immediate paper losses. If the sight of those paper losses is likely to cause an investor to withdraw their capital from the market then real damage is done. So whilst from an academic perspective lump sum investing makes sense, for practitioners considering investor experience and behavioural risks, a phased approach may be less stressful. Phased investing: Phased investing is a less stressful approach. By investing in regular intervals, short-term fluctuations smoothen out, and the investor achieves an entry price to risk assets that is the average over that implementation period. The pace of phased investing consideration should be given to client needs, portfolio size and market conditions. If markets are upward trending, implementation should be rapid. If markets are uncertain or downward trending, implementation should be gradual. Timing the markets is impossible, hence the best approach is to make a plan and stick to it. This enables better acceptance of the outcome. Implementing an existing portfolio where the asset allocation changes Implementing an existing portfolio where there is a change in the asset allocation may also benefit from a phased approach to help smooth returns (ignoring any tax considerations). A rolling benchmark can be used to calibrate performance evaluation. An implementation window should be agreed and any evaluation metric adjusted accordingly. Changes in tactical asset allocation should continue to be reflected immediately. By using a phased approach this can reduce portfolio sensitivity to short term market directional movements as it transitions to its new strategic posture. Implementing an existing portfolio where there are only changes to underlying holdings Implementing an existing portfolio where there is no change in asset allocation, but a material change in the underlying holdings (for example switching from active funds to ETFs) we recommend an immediate approach (assuming no tax considerations). This is because with no change in asset allocation, there is no change in the risk profile of the portfolio. Changes in tactical asset allocation should continue to be reflected immediately. Drift and rebalancing A key implementation decision is around portfolio rebalancing. Once a strategic allocation is set, investors need to decide what is an acceptable amount of drift, how frequently or infrequently to rebalance and on what basis to do so[1]. Allocation ranges As the asset returns of each asset class in the allocation vary, the weight of each asset class will “drift” from its start weight. Left unchecked, or if rebalancing is too infrequent, the risk profile (expected risk-return) of the allocation may vary significantly from target weights. Investors should specify to what extent they will allow such “drift” by specifying the minimum and maximum asset allocation ranges for each asset class. This can be expressed arithmetically (e.g. a 50% strategic allocation to equities can drift between +/-2.5ppts from the target weight), or geometrically (e.g. a 50% strategic allocation to equities can drift between 0.95x and 1.05x of the target weight). Rebalancing policy After deciding on allowable ranges of drift, investors must consider the frequency of rebalancing. The advantages of frequent rebalancing are:
The disadvantages of frequent rebalancing are:
In conclusion, for contrarian investors, regular rebalancing makes sense, but investors need to achieve a balance between frequency and trading and other frictional costs. Hence the more long-term your portfolio, the less frequently you need to rebalance. The more short-term your portfolio the more frequently you need to rebalance. A useful rule of thumb would be to consider quarterly rebalancing for medium-term portfolios (3-10 years), semi-annual rebalancing for long-term portfolios (10-20 years) and annual rebalancing for longer term portfolios (>20 years). It follows that the less frequent the rebalancing, the greater the range of allowable drift should be. Bringing this together, the investment time horizon, rebalancing frequency, and allowable drift ranges will differ from mandate to mandate. Rebalancing triggers When selecting a rebalancing trigger, investors can select one of the following:
After deciding on frequency of review, drift ranges, and type of trigger investors need to decide on what weighting scheme to implement. Types of rebalancing When selecting a weighting scheme, investors can select one of the following:
Rebalancing and cash flow Finally there investors can use cashflows where available to mitigate trading costs. Where there is no new capital introduced, the rebalancing process will necessarily consists of sales and purchases of each asset class to realign to target weights. Where there is sufficient capital being introduced, that opportunity can be used to make purchases only, to realign the portfolio to target weights. This reduces trading costs. Rebalancing enforces investment discipline, but there is a balance to be struck between accuracy of target weights and trading costs. The degree to which a portfolio is traded (with associated transaction costs) is called portfolio turnover, and this is one of the technical considerations for portfolio implementation. Technical considerations Portfolio turnover Decisions around rebalancing will directly impact portfolio turnover. Turnover is the measure of the extent to which a portfolio is changed. Annual turnover is calculated by taking the lesser of the value of securities purchased or sold during one year and dividing that by the average monthly value of the portfolio for that period. Lower portfolio turnover (e.g. 0-20%) is closer to a “buy-and-hold” strategy which has lower transaction costs. Higher portfolio turnover (e.g. 80% or more) is closer to a frequent trading strategy, which has higher transaction costs. The type of strategy and related turnover should be consistent with the investment objectives. Taking the inverse of the annual turnover figure gives the average holding period. For example, for a portfolio with annual turnover of 20%, the average holding period for a security is 5 years, For 200% it is 0.5 years. Whilst evidence suggests that lower turnover strategies tend to outperform higher turnover strategies[4], the main value of the turnover ratio is to ensure that the portfolio is being managed in alignment with the agreed mandate. Regular investing with Pound Cost Averaging For DIY investors who don’t have large lump sums to invest one of the most effective ways to resolve implementation risk is to adopt a permanent phased investment approach known as a regular investment plan. The benefit of this approach is known as pound cost averaging. Pound-cost averaging is a popular investment strategy where the same dollar amount is invested sequentially over a number of time-periods. Pound cost averaging[5] smooths the entry point for investments over each year. It means investors are topping up when markets are down and are buying less when markets are up. In this respect the approach is contrarian. The primary benefit of pound cost averaging is not necessarily that it improves returns, but it reduces the stress and anxiety associated with worrying about market levels. By breaking one large investment decision into a sequence of investments, the investor essentially diversifies their risk to obtain an entry price of an investment closer to the average price of an investment for the given time frame that was used to purchase it. While the majority of academic research notes the inferior performance of pound-cost averaging relative to lump sum investing over the long run[6], there is evidence that pound-cost averaging can lead to higher returns in the case of lower volatility funds or when there is a substantial chance of an investment losing value[7]. There is also the practical considerations ignored by academics that many DIY investors find it easier to allocate a certain portion of monthly income to their investments rather than a lump sum. For example, for most DIY investors it’s easier from a cashflow perspective to invest £500 per month into an ISA than to make a lump-sum investment of £6,000. Finally, evidence suggest that DIY investors tend to be their own worst enemy when attempting to time the market. Analysis of equity allocations for the period 1992-2002 for over a million accounts reveals that individuals frequently end up buying high and selling low[8] and there is also evidence that an average investor performs worse than the corresponding benchmark[9]. A disciplined investment approach of pound-cost averaging mitigates investors’ temptation to time the market[10] and therefore protects against the cognitive errors that lead to suboptimal investment outcomes[11]. Furthermore, it nudges right decisions in a bear market, “buy low”, precisely when investors’ confidence in the stock market is weakened[12]. Studies in the UK market suggest that retail net fund flows are broadly influenced by the direction of the market with inflows chasing up-markets, and out-flows chasing down-markets. This contrary to the principles of value investing. Pound cost averaging is therefore an antidote to many of the behavioural pitfalls that can catch investors out. Summary These are the main implementation considerations when setting up a new or transitioning an existing portfolio.
[1] Dayanandan and Lam, “Portfolio Rebalancing–Hype or Hope?” [2] O’Neill, “Overcoming Inertia”; Benartzi and Thaler, “Heuristics and Biases in Retirement Savings Behavior.” [3] Sharpe, “Adaptive Asset Allocation Policies.” [4] Cremers and Pareek, “Patient Capital Outperformance.” [5] Agarwal, “Exploring the Benefits of Pound Cost Averaging”; Morningstar Equity Analysts, “The Benefits of Pound Cost Averaging.” [6] for example see http://www.morningstar.co.uk/uk/news/96177/is-pound-cost-averaging-overrated.aspx/ [7] Leggio and Lien, “An Empirical Examination of the Effectiveness of Dollar-Cost Averaging Using Downside Risk Performance Measures.” [8] Benartzi and Thaler, “Heuristics and Biases in Retirement Savings Behavior.” [9] Dalbar, Inc. & Lipper, “Quantitative Analysis of Investor Behavior.” [10] Kahneman and Tversky, “Prospect Theory.” [11] Statman, “A Behavioral Framework for Dollar-Cost Averaging”; Benartzi and Thaler, “Heuristics and Biases in Retirement Savings Behavior.” [12] Cohen, Zinbarg, and Zeikel, Investment Analysis and Portfolio Management, Homewood, Illinois. |
ELSTON RESEARCHinsights inform solutions Categories
All
Archives
July 2024
|
 RSS Feed
Company |
Solutions |
|