

 Momentum does not care about sectors, themes, or valuations. In this article for ETF Stream, Hoshang Daroga explores the Momentum factor.
Whilst the original Fama & French research isolated 3 factors (Market risk (Beta), Size and Value) that were found to be persistent drivers of returns, research has since evolved to look at other factors such as Quality, Yield, Momentum and Minimum Volatility. Read in full  For investors wanting a differentiated approach to implementing a global equity exposure, what are the options?
Read the full article in FT Adviser  Central Banks' policy rates are expected to pivot towards cuts in 2024 with a material impact on asset class perspectives.
Read the full article in FT Adviser  [5 min read]
2022 was a reminder of the importance of dispersion within equity markets. It turns out this lesson remains relevant in 2023 but with very different - almost opposite - themes. Read the article in FT Adviser 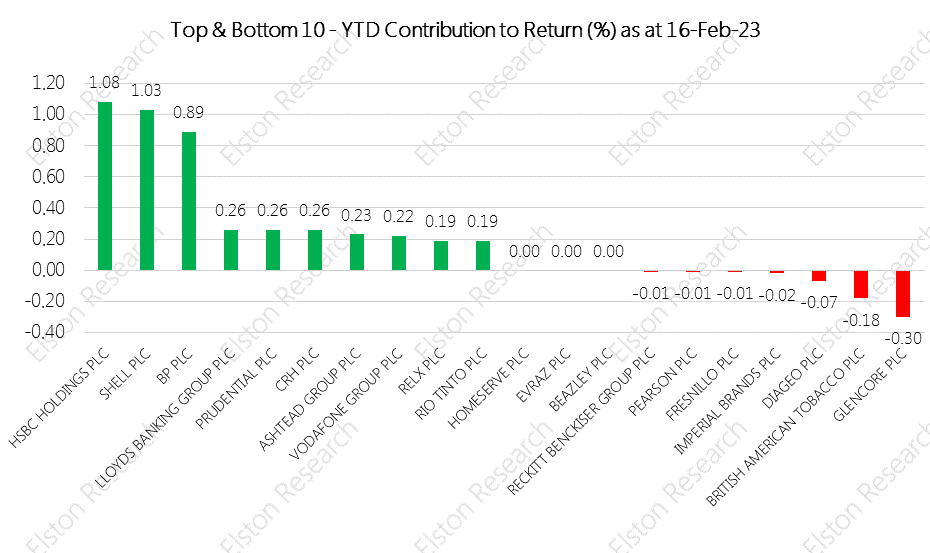 [5 min read, open as pdf]
 NMA speaks to investment consultant Henry Cobbe about positioning equities for higher inflation using sector and factor equity investing.
Listen to the podcast  [5 min read, open as pdf]
 [5 min read, open as pdf]
With low growth, soaring inflation and spiking interest rates, advisers need to rethink the definition of risk. Focus on volatility is focus on the “wrong problem”. Instead, advisers should focus on preserving purchasing power (mitigate inflation risk) to protect client outcomes. That requires a fundamental rethink around traditional definitions of risk, asset allocation and diversification. For full article including charts, open as pdf 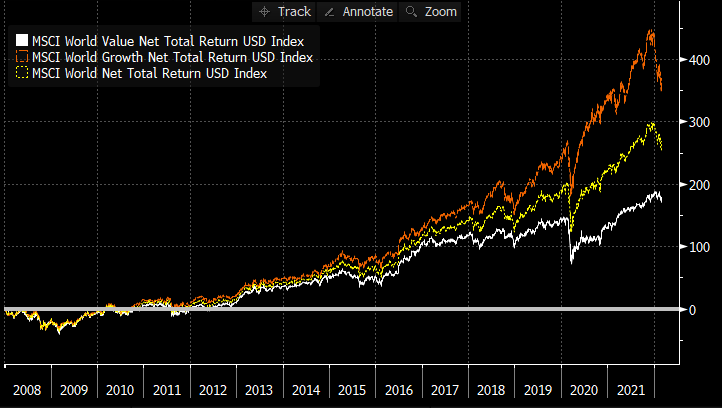 [5 min read, open as pdf]
The “great rotation” to Value began towards the end of 2020 as inflation fears came into focus. It has been rewarded. Since Dec 2020, the MSCI World Value factor has delivered +21.43% returns to 25th February 2022 compared to +7.70% return for Growth factor and +14.78% for the parent MSCI World index (a traditional market-cap based index), all in GBP terms. If we look back further at relative performance since end 2007 to 25-Feb-22, we can see that Value’s underperformance relative to Growth is still material. Over that period, Growth returned +369% (11.54%pa), compared to +179% (7.52%pa) for Value, and +268% (9.63%pa) for traditional market-cap based world equities, in GBP terms. On this basis, the re-rating of Value, relative to Growth, has room to run in the face of a persistent inflationary regime. Read full article with charts Watch our CISI-accredited CPD on an Introduction to Factor Investing 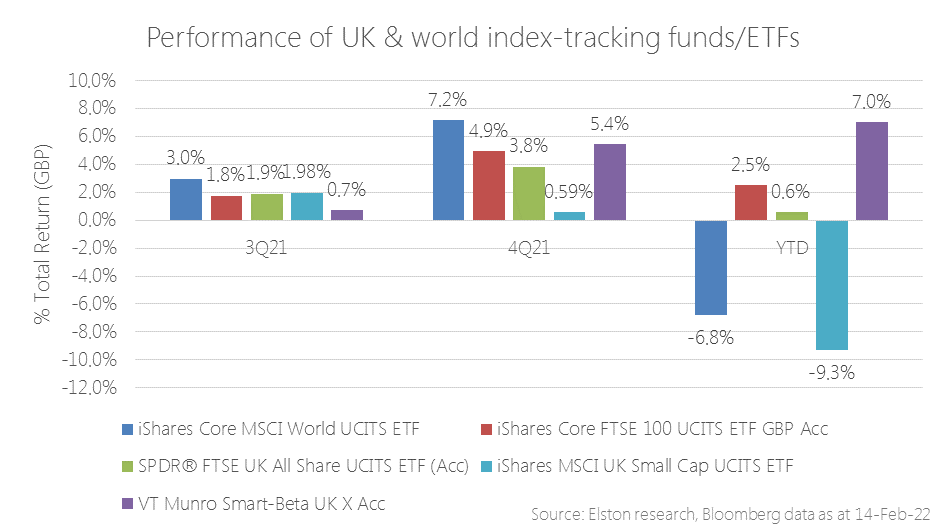 [3min read, open as pdf]
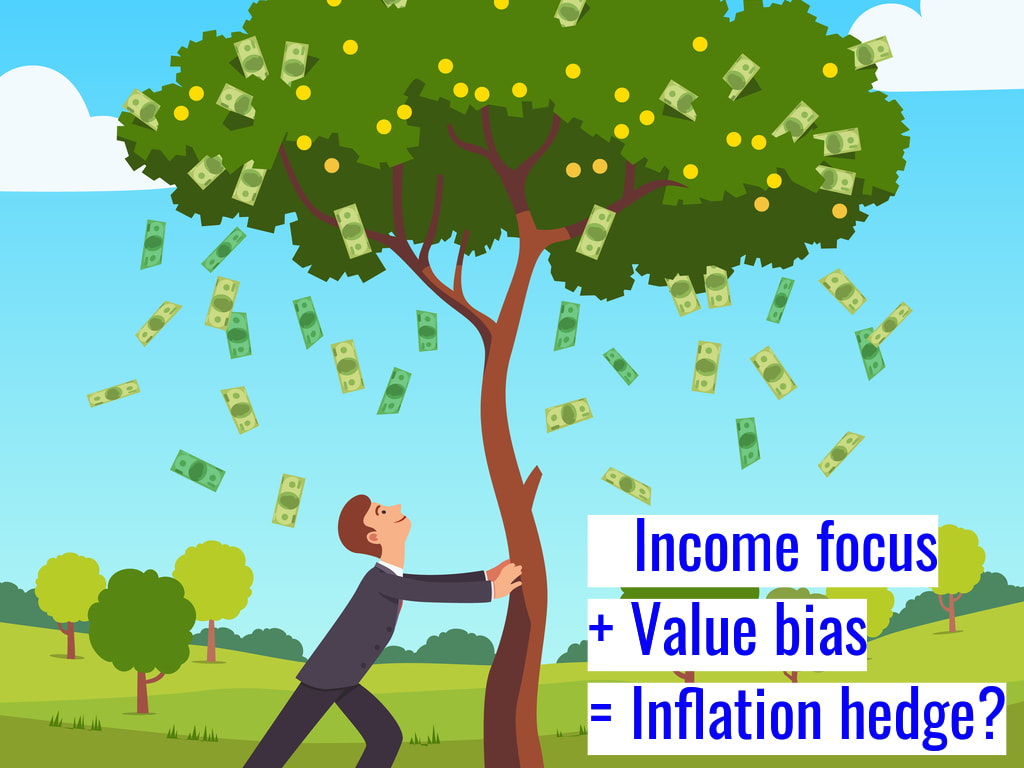
Value/Income bias for inflation protection In our 2022 outlook, we explained why inflation will remain hotter for longer and will settle above pre-pandemic levels. Within equities, we outlined our rationale for being overweight Value-factor equities with an Income bias to shorten equity duration. This built on our May 2021 view on UK equity income providing a helpful inflation hedge. The rapidity and severity of market movements against the prospect of faster-than-expected inflation and greater-than-expected interest rate tightening have only served to reinforce these views, as reflected by performance. Whereas world equities have struggled year to date, UK equities have been a relative bright spot. Within UK equity index exposures, indices that focus on dividends (with an inherent value bias), over size (market cap) have delivered best results. Our Smart-Beta UK Dividend Index [ticker ELSUKI Index] has delivered positive returns YTD ahead of more mainstream UK equity indices, driving the absolute and relative returns of the VT Munro Smart-Beta UK Fund, which is benchmarked to this index[1]. Read full article as pdf [1] Note & Commercial Interest Disclosure: Elston Indices is the benchmark administrator for the Freedom Smart-Beta UK Dividend Index, to be renamed the Elston Smart-Beta UK Dividend Index with effect from 1st March 2022. The VT Munro Smart-Beta UK Fund is benchmarked to this index.  [5 min read, open as pdf]
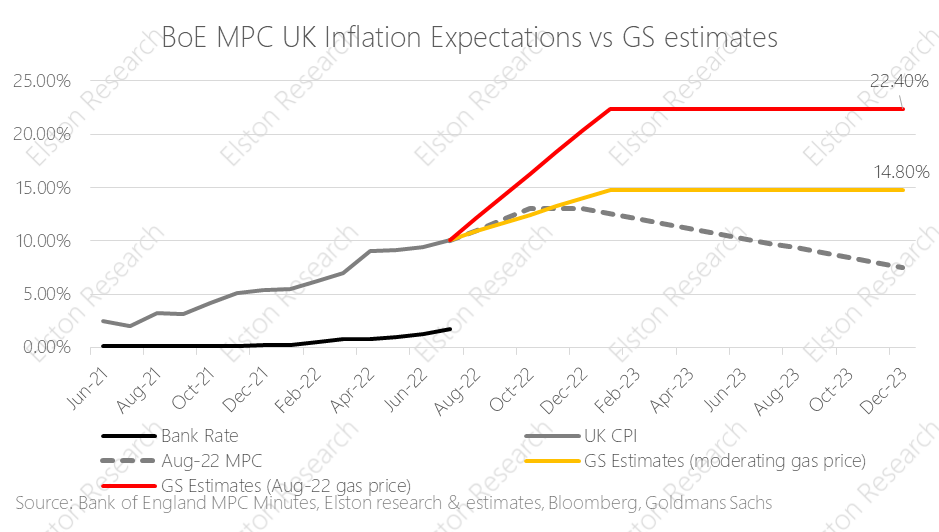
In our 2022 outlook, we explained why inflation will remain hotter for longer and will settle above pre-pandemic levels. Advisers should consider how to adapt portfolios for inflation across each asset class – equities, bonds and alternatives. Research demonstrates how different asset classes exhibit different degrees of inflation protection over different time-frames. Equities therefore provide a long-term inflation hedge.
In this article, we explore how to adapt portfolios for inflation within and across each asset class: Equities, Bonds and Alternatives. For full article, read as pdf  [3 min read, open as pdf]
2021 in review Our 2021 market roundup summarises another strong year for markets in almost all asset classes except for Bonds which remain under pressure as interest rates are expected to rise and inflation ticks up. Listed private equity (shares in private equity managers) performed best at +43.08%yy in GBP terms. US was the best performing region at +30.06%. Real asset exposures, such as Water, Commodities and Timber continued to rally in face of rising inflation risk, returning +32.81%, +28.22% and +17.66% respectively. 2022 outlook We are continuing in this “curiouser, through-the-looking glass” world. Traditionally you bought bonds for income, and equity for risk. Now it’s the other way round. Only equities provide income yields that have the potential to keep ahead of inflation. Bonds carry increasing risk of loss in real terms as inflation and interest rates rise. Real yields, which are bond yields less the inflation rate, are negative making traditional Bonds which aren’t linked to inflation highly unattractive. Bonds that are linked to inflation are highly sensitive to rising interest rates (called duration risk), so are not attractive either. How to navigate markets in this context? The big three themes for the year ahead are, in our view:
See full report in pdf Attend our 2022 Outlook webinar 
Inflation is proving more persistent than transitory. In an inflationary environment, Value style investing has the potential for continued outperformance relative to other factors. For UK fund investors, actively managed funds with a value-oriented philosophy, UK equity income funds with an inherent value bias and Value-factor index funds/ETFs offer ways of increasing allocation to Value within a portfolio. Read the article (5 min read) Watch the webinar 
The era of quantitative easing programmes have had a distorting effect on markets since the 2008 financial crisis has given value investors a torrid time in the past decade. The near-constant sugar-rush of liquidity has served to de-link valuations from underlying fundamentals prompting a huge bias towards growth. While pockets of investors have been braced for a long-expected correction that has never really materialised, the recent sharp increase in inflation may constitute an inflection point of sorts. In inflationary periods and when interest rates rise, the time horizon for future discounting shrinks, leaving equities exposed. Income-yielding shares have an inherent value-bias, owing to the types of company that pay steady dependable dividend). This provides a measure of inflation protection both in absolute terms and relative to nominal bonds. Read the full article Watch the webinar  [10 min read, open as pdf]
 [3 min read, open as pdf] Inflation is on the rise: equities provide long-term inflation protection Inflation risk means greater focus on intrinsic value such as dividends UK equities with value and/or income bias are attractive Inflation is on the rise, and whilst it’s broadly accepted that equities can provide a long-term inflation hedge, which kind of equities are best positioned to provide this. Since the financial crisis, Value investors have been jilted by a market love affair with Momentum. The switch back to Value was already being called on purely a valuation basis since late 2019. But the rekindling of inflation risk in the market is only making companies with a Value-bias and a progressive quality income stream back in the spotlight. What is quality income? Quality means persistency, focusing on companies that regularly pay a stable or increasing dividend, whilst mitigating dividend concentration risk. “One of the most persuasive tests of high quality is an uninterrupted record of dividend payments going back many years.” Benjamin Graham Indeed, research suggests that Dividends are a key anchor of Total Returns, although this differs from market to market. 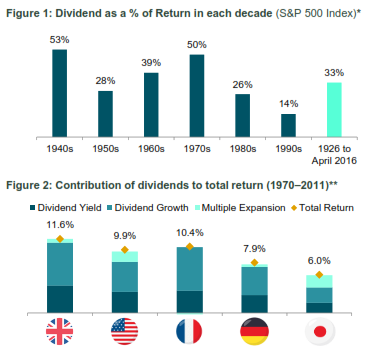 Figure 1: Source: S&P Dow Jones Index Research August 2016
Figure 2: Source: JP Morgan, The Search for Income: A Global Dividend Strategy, 2012 How then to screen for companies that can deliver this type of strategy? Is it just about yield? We don’t think so. High yield is not high quality Screening for high dividend yield alone can lead to “value-traps” that negatively impact performance. The poor performance is because those high-yielding companies might be poor businesses with unstable dividends. Market cap weight or Dividend contribution weight Traditional equity indices are market-capitalisation weighted. The resulting dividend income for an index is therefore a function of each company’s size. An alternative approach is to weight the holding in each company by its contribution to overall dividends. This way the index is focused on the biggest dividend payers, rather than the biggest companies by size. This creates a direct bias towards Yield, and an indirect bias towards Value, from a factor-exposure perspective. Forward- or backward-looking Active equity income managers typically look at forward-looking dividend estimates. Index-based “passive” equity income strategies often look at historic dividend yield for ranking purposes. This is sub-optimal. We believe that index strategies that focus on equity income should use forward-looking estimates, to systematically capture upswings in earnings and dividend estimates. Equities as an inflation hedge It’s broadly accepted that equities can provide a long-term inflation hedge. But what kind of equities are likely to perform well in an inflationary regime? We believe there are three characteristics:
Why the Value focus in inflationary environment? When the two major styles of investing are compared, i.e., growth and value investing, the latter style rejects the efficient market hypothesis and choses an equity with lower expectations, which is often undervalued and would profit quickly when the market adjusts itself. During an inflationary environment, economic concepts direct that the ‘time value of money’ has a major role to play. Thus, an equity today, becomes of greater value, when compared to its worth tomorrow. Hence, value investing seems attractive in an inflationary world since the investors are less willing to pay up for future earnings and can regain their money sooner rather than later, when compared to growth investing. (Murphy, 2021) With a global pandemic, many predicted deflation as a threat; however, with the counter-balancing forces, investors soon realized inflationary threat. (Baron, 2021). Rising inflation is good for value investing for a number of reasons. In general, equity markets are dynamic and display a stronger corelation to inflationary environment, this lays a very strong premise that higher inflation and stronger earnings are co-dependent. Financially speaking, Sectors such as energy, financial are major drivers of the major economic growth. A rise in these value stocks tends to pace up the overall economic growth, thus outperforming others. (Lebovitz,2021) According to JP Morgan’s chief strategist, the change in investing style, this time around could be a more impactful due to several factors such as the failure of monetary and fiscal policies whilst recovering from a pandemic. (Ossinger, 2021) Dividends, dividends, dividends: a tried and tested approach The most fundamental explanation, by John Kingham, a value investor, states that a dividend discount model, attempts to find the true value of the stock, under any market circumstances and focuses on the dividend pay-out factors and the market expected returns. Historically, the companies with dividend have generated higher returns when compared to companies which either have no dividend or eliminated the dividend. (Park and Chalupnik, 2021) This means that dividends hold value when it comes to the total return of the portfolio. Moreover, with the market getting more and more inflationary, and equities getting exposed. Adding companies which can provide returns even in a low growth environment can create a sustainable portfolio. Government bonds have not performed well with rising inflation (Baron,2021) High yielding corporate bonds offered better protection compared to government gilts since these inflations linked bonds add value in-line with RPI Inflation according to Barclays Equity Guilt Study and can protect investors from unexpected inflation, yet they are still not considered as a safe haven like government gilts. (Dillow,2021) Investment manager of Iboss Chris Rush recently told Portfolio Adviser that in order to reduce the inflationary shock the firm had already reduced its positions from treasures and gilts and incorporated strategic bonds They also plan on holding a short duration fixed income. (Cheek, 2021) Although, it might have not been the fundamental goal, over the past several decades until 2017 dividends reported 42% of the S&P 500 Index’s total return. The global recession and now pandemic have created a lack of stability for the layer of support for future returns, however, analysts have assured there is room for recovery. (Markowicz, 2021) Summary Whether transitory or persistent, with inflation on the rise, there is a strong rationale for having an allocation to Value from a factor-exposure perspective. Those value-type firms that generate and pay a progressive dividend policy provides a level of inflation protection both in absolute terms and relative to bonds that is more than welcome, and potentially essential. Henry Cobbe & Aayushi Srivastava  [7 min read, open as pdf] [See CPD webinar on introduction to factor-based investing]
Stellar performance If there’s one word to describe the performance of Terry Fundsmith’s Fundsmith Equity Fund, it would be “stellar”. Beloved by retail investors and advisers alike, it’s a key holding in many of the portfolio we see that are run by financial advisers. The firm’s values are clearly set out “No performance fees, no nonsense, no shorting, no market timing, no index hugging, no hedging" and so on. All this combined with great results, and it’s a compelling proposition. But in this article, we set out to answer four questions:
In summary, the answers are, respectively: Possibly, Sector Allocation, Definitely Not, and Yes. What is Momentum investing? MSCI defines momentum factor as referring to “the tendency of winning stocks to continue performing well in the near term. Momentum is categorized as a “persistence” factor i.e., it tends to benefit from continued trends in markets”[1]. Following the lows of the Global Financial Crisis, it’s been a great time to be a Momentum investor. Indeed, it has been the best performing style factor, much to the chagrin of many “purist” factor-based investors who focus only on the original Fama-French framework of Size and Value factors. Question 1: Is Fundsmith a Momentum investor? What’s the right comparator? The Fundsmith Equity fund quite rightly uses MSCI World Index as a performance comparison on its factsheet. Comparisons against UK equity funds or indices would not be appropriate. In our research around factor-based investing, we thought it would be interesting to plot how the performance of a popular global equity fund like Fundsmith Equity fared against the various factor-based world equity indices. We were astonished to see that the overall performance was almost identical to the iShares EDGE MSCI World Momentum Factor UCITS ETF (the “Momentum ETF”) which tracks the MSCI World Momentum Factor index (the “Momentum Index”). Fig.1. Close call between Fundsmith & Momentum factor for trouncing MSCI World 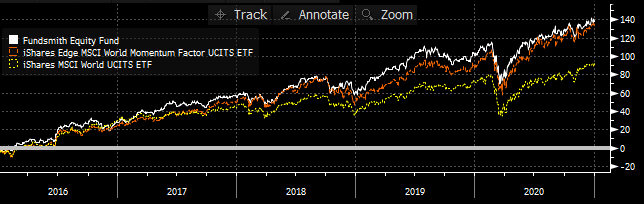 Source: Elston research, Bloomberg data. Total Return in GBP terms as at 31-Dec-20 Indeed, over the last 5 years from Dec-15 to Dec-20, Fundsmith has delivered a cumulative total return of +137.39%, compared to the Momentum ETF’s return of +132.77% and +90.23% for iShares MSCI World Equity ETF (the "World Equity ETF"). In annualised returns this translates to +18.85%, +18.39% and +13.71% respectively[1]. [1] As at 31st December 2020 To be clear, Fundsmith Equity is not managing the fund to this benchmark, so could argue it’s not an appropriate comparison, and technically, that’s right. But we thought nonetheless a comparative analysis would be informative, not least to show that Fundsmith-like returns were achievable with a Momentum-style investment approach. How about 2020 performance? In 2020, Momentum ETF returned +24.85% in GBP terms, compared to Fundsmith Equity’s +18.23% and the World Equity ETF +11.81%, possibly helped by its rebalancing in what very much a year of two halves.. Fig.2. Fundsmith vs Momentum in 2020 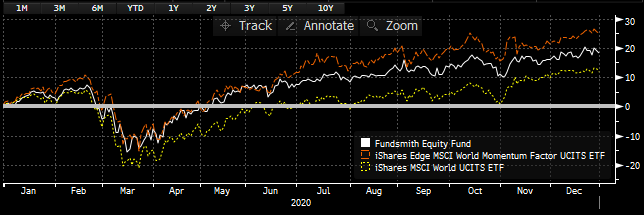 Factor investing: between active and passive? Factor-based index investing has sometimes been described as being somewhere between passive (cap-weighted index beta) investing and active (non-index) investing. Indeed factor-based investing became mainstream when Ang, Goetzmann and Schaefer (2009) conclude that the bulk of the apparent manager alpha within the Norwegian Sovereign Wealth Fund was explained by macro factors and style factors. Factors therefore explain a large part of the difference between market beta and active returns, that were previously attributed to manager alpha. In the chart below, we compare the annualised performance over 5 years of the world equity ETF (beta), the Momentum ETF (style factor) and the residual difference (Alpha) between Momentum and Fundsmith. Effectively we are using the Momentum ETF as a benchmark for Fundsmith’s style. Fig.3. Relative Return Comparison: Fundsmith Equity vs iShares EDGE MSCI World Momentum Factor ETF 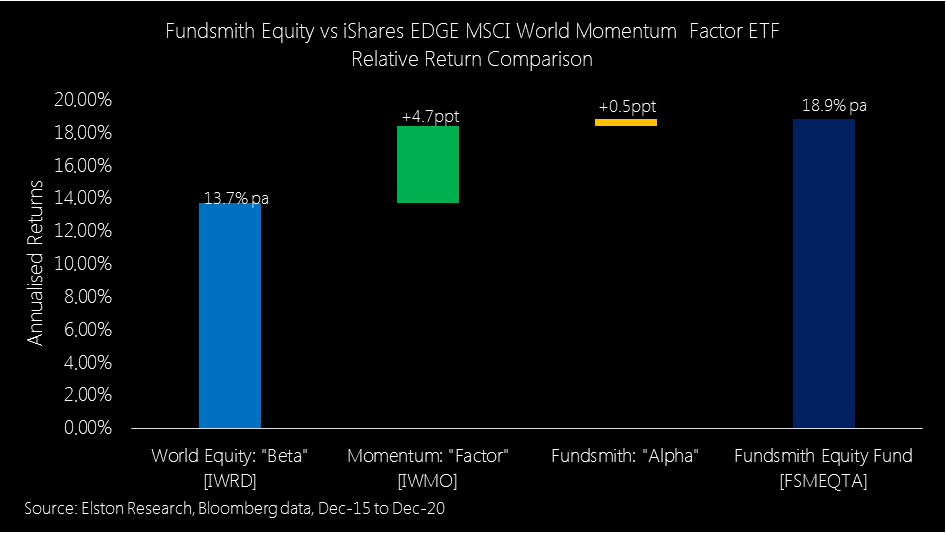 So for evaluating manager skill: which is the right benchmark? A) World Equities against which both Fundsmith Equity and a low cost Momentum ETF look great; or B) if Fundsmith is indeed a Momentum-style investor – a Momentum benchmark, against which Fundsmith has still outperformed – but only marginally? Applying a factor lens to active managers What we like about the Fundsmith Equity fund is that it is a “true active” fund using high conviction, and high concentration, and see it as a powerful addition to portfolios. Fundsmith describes his process as “Quality focused” and yet performance is very different to a Quality factor and almost identical to a Momentum factor. We are not saying that Fundsmith is not properly describing their investment process. We are just noting the outcome of its results and similarity to the Momentum factor. By applying this factor perspective to traditional active managers, we can see what factors those managers are knowingly or unknowingly allocating to, and hence to what extent their performance relates to a particular style factor. Both Fundsmith and Momentum Index have had a high concentration to Information Technology, Health Care and Consumer Staples. Fundsmith’s fund is not constrained and his more concentrated approach means that this sector concentration is even more extreme than the Momentum index. Naturally there is significant overlap in the underlying stock within both Fundsmith and the Momentum ETF, but with Fundsmith able to take larger security weights than a rules-based index. Question 2. Where and how has Fundsmith added value? Performance Attribution We ran an attribution analysis comparing the Fundsmith Equity fund to the Momentum ETF for the period from June 2016 to December 2019, a period where all look-through data is available. For this period, Fundsmith returned +75.76% outperforming the Momentum ETF which returned +69.48%. In terms of Total Returns, Fundsmith’s picks in the Information Technology sector delivered +145.22%, compared to Momentum ETF’s +156.32%, an underperformance of -11.1%. This was offset by Fundsmith’s picks in the Health Care sector which returned +77.66%, compared to +67.58% for the Momentum ETF. An outperformance of +10.08%. Fundsmith’s picks in the Consumer Staples sector generated +35.62%, compared to +35.12% for the Momentum ETF. After adjusting each sector for average weights, the large relative overweight in Information Technology – an advantage of a more concentrated approach – meant that technology was the largest relative contributor to overall return deliver 35.82ppt of the +75.76% return. Similarly, for Momentum, information technology delivered 26.5ppt of the +69.48% return. In summary for the time period under review Fundsmith has been excellent at sector selection. Good in stock selection within the Health Care sector was offset by poor stock selection in the Information Technology sector. Stock selection in the Consumer Staples sector added almost no value. Fig.4. Sector-level Contributions To Return 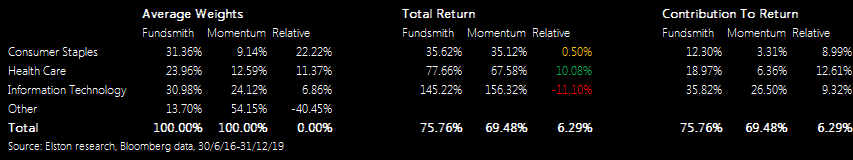 Taking this further into an attribution analysis, the conclusion is that Fundsmith added greatest value by selecting the best performing sectors, where share price momentum was greatest. There was moderate additional value from fund selection, and some detraction from currency effect. Fig.5. Attribution analysis 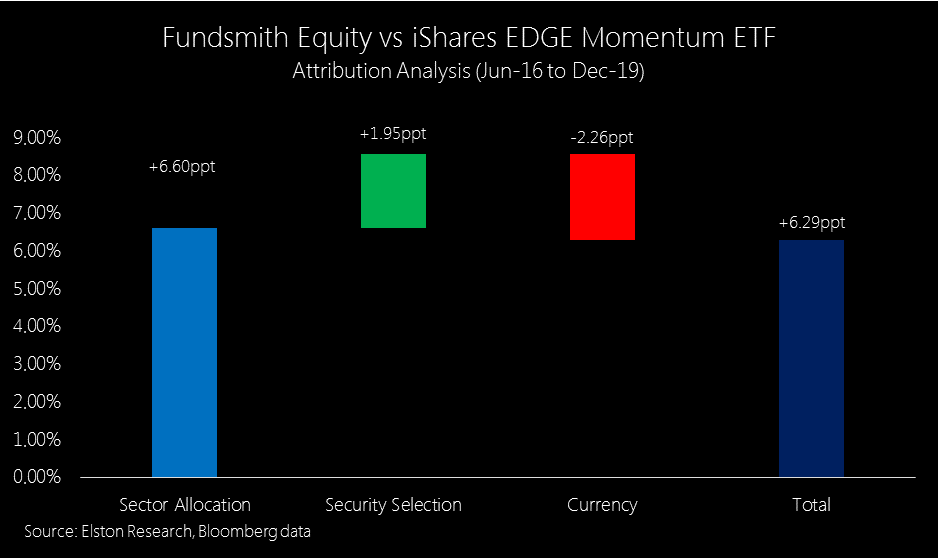 Holdings analysis We also looked at the average largest relative overweights for the Fundsmith Equity fund relative to the Momentum ETF, to look at security-level Contribution to Total Return. During the period under review, Paypal, Idexx and Amadeus were the largest contributors to returns. Fig.6. Security-level Contribution To Return 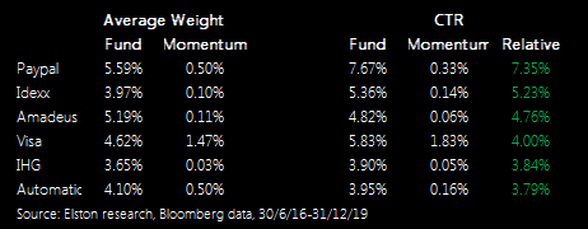 Fundsmith is “true active” because he is taking large absolute and relative bets relative to securities’ index weights be - that in a traditional cap-weighted index which is his benchmark, or in the Momentum factor-weighted index. which is not. Fundamentals Interestingly, looking at aggregate valuations, the overall Price Earnings Ratio (PER) for Fundsmith and for Momentum is not dissimilar, whilst Price Book Value (PBV) ratios – a traditional value metric – and debt levels were far higher for Fundsmith than Momentum. Fig.7. Valuation Comparison 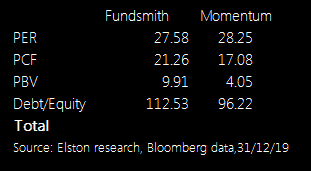 Question 3: Is Fundsmith Equity hugging the Momentum index? No. Not at all. As a far more concentrated portfolio there are high levels of active weights relative to the much more diverse Momentum Index. The correlation between the strategies from December 2015 to December 2020 is high at 84.3%, but not too high Fig.8. Top 5 relative weights 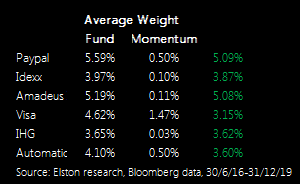 Question 4: Are Fundsmith-like returns replicable by lower cost index strategies?
The most interesting element of our analysis is this: usually when comparing actively managed funds, you can often find two strategies that take a similar approach, but have led to very different outcomes. In this case, comparing an actively managed fund with a Momentum index fund, we have two strategies that take a different approach, but reach a very similar outcome. This is consistent with the concept of factors being the underlying drivers of returns. Fundsmith is and remains a vindication of the potential value add of active management, and the ability to deliver returns well in excess of the market (cap-weighted) beta. As such, we expect advisers to continue to want to include Fundsmith as a core holding within their equity allocation. But we would note decompising returns to what is attributable to Factors provides additional insight. However, if the question is are those type of returns accessible using index funds, the answer is emphatically yes. An equal weight allocation across Consumer Staples, Health Care and Information Technology ETFs, or a single allocation to a Momentum ETF would have delivered similar returns to Fundsmith, but with TERs of 0.30% or so, instead of 0.95%. So if you are looking for growth, being fully allocated to equities, and backing "winning" business: then you can implement that approach with active funds like Fundsmith, or index exposures like Momentum. The holdings or “ingredients” might be different, but the factors or “nutrients” might be the similar. Similarities and Differences So, apart from the obvious, what are the similarities and differences between methodologies? Similarities
Summary Fundsmith’s performance is undeniably excellent. We would note that it is consistent with that of a Momentum-style investment strategy. Fundsmith’s “Alpha” can be measured not just against MSCI World, but against the MSCI World Momentum Index. Using the standard MSCI World as a comparator implies Fundsmith’s Alpha is a phenomenal 5.14ppt pa over the last 5 years. Using the MSCI World as a comparator implies Fundsmith’s Alpha is just 0.46ppt pa. Incorporating factor-based exposures as a hybrid on the spectrum between traditional cap-weighted passive, and true active, creates more options for portfolio managers looking to isolate and capture specific styles and exposures without having to materially increase either the risk budget or the fee budget. [1] MSCI factsheet as at December 2020 for last 12 months  [5 min read, open as pdf]
Tech performance is skewing cap-weighted indices The run up in technology stocks and the inclusion of Tesla into the S&P500 has increased both sector concentration and security concentration. The Top 10 has typically represented approximately 20% of the index, it now represents 27.4%. The chart below shows the Top 10 holdings weight over time. 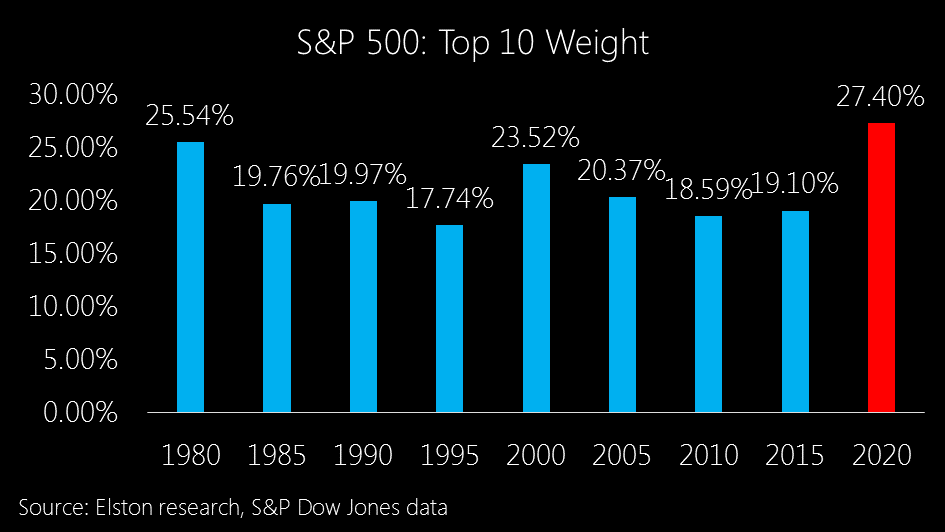 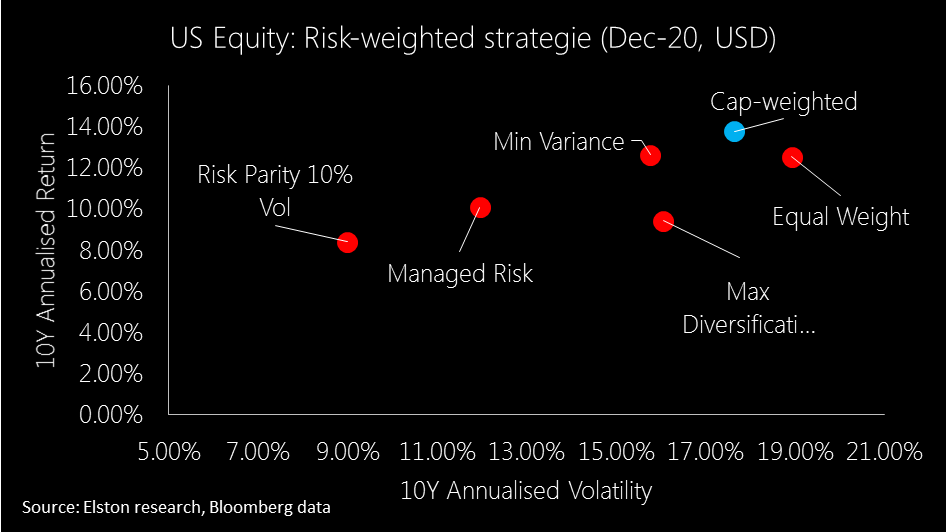 Rather than looking just at Risk vs Return, we also look at Beta vs Correlation to see to what extent each strategy has 1) not only reduced Beta relative to the market, but also 2) reduced Correlation (an indication of true diversification). Strategies with lower Correlation have greater diversification effect from a portfolio construction perspective. Ironically, the last time the index was anything close to being this concentrated was back in 1980 when IBM, AT&T and the big oil majors ruled the roost. From a sector perspective, as at end December 2020, Information Technology now makes up 27.6% of the index. Increased concentration reduces diversification This level of concentration is indeed skewing indices that rely on a traditional market capitalisation-weighted (cap-weighted) methodology, and does therefore reduce diversification. But the issue of the best performing stocks getting a larger weighting in the index, is not an accident of traditional index design. It’s its very core. Cap-weighted indices reflect the value placed on securities by investors, not the other way round. We should not therefore conflate the debate around “active vs passive” investment approaches, with the debate around index methodology. If portfolio managers are concerned about over-exposure to particular company or sector within a cap-weighted index, they can either chose an active, non-index fund, that is not a closet-tracker. Or they can access the target asset class through an alternatively weighted index, which uses a security weighting scheme other than market capitalisation. Using cap-weighted indices is an active choice The decision to use a fund that tracks an cap-weighted index is an active choice. And for those seeking differentiated exposure, there is a vast range of options available. We categorise these into 3 sub-groups: Style, Factor-based and Risk-based.
How have US equity risk-based strategies fared? Risk-based strategies have been in existence for some time, so we are able now to consider 10 year data (to December 2020, in USD terms). In terms of risk-adjusted performance, Managed Risk index strategies have fared best, whilst Min Variance has delivered higher returns for similar levels of risk of a Max Diversification strategy. Meanwhile Equal Weight has actually exhibited greater risk than traditional cap-weighted approach. 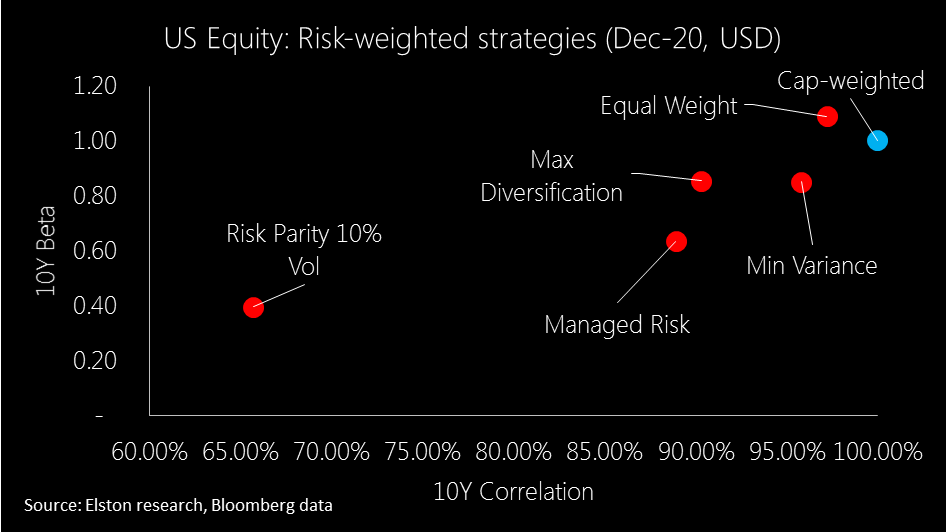 In this respect, Equal Weight (Max Deconcentration), also disappoints delivering higher beta and >95% correlation. Likewise Min Variance, whilst delivering on Beta reduction, does not deliver on decorrelation. Max Diversification delivers somewhat on decorrelating the strategy from the S&P500, but only modestly, whilst Managed Risk achieves similar decorrelation, reduced beta and better returns. Finally Risk Parity 10% Volatility cap has delivered most decorrelation as well as beta reduction.
For more information about the indices and funds used to represent these different strategies, please contact us. Summary There are a broad range of alternatives to cap-weighted index exposures. But consideration of style-, factor- or risk-based objectives will necessarily inform portfolio construction.
Find out more For more insights and information on research, portfolios and indices, visit: www.elstonsolutions.co.uk or NH ETF<Go>  [2 min read, open as pdf]
A Factor-based approach to investing Factor-based investing means choosing securities for an inclusion in an index based on what characteristics or factors drive their risk-return behaviour, rather than a particular geography or sector. Just like food can be categorised simply by ingredients, it can also be analysed more scientifically by nutrients. Factors are like the nutrients in an investment portfolio. What are the main factors? There is a realm of academic and empirical study behind the key investment factors, but they can be summarised as follows The different factors can be summarised as follows:
Which has been the strongest performing factor? Momentum has been the best performing factor over the last 5 years. Value has been the worst performing factor. Fig.1. World equity factor performance 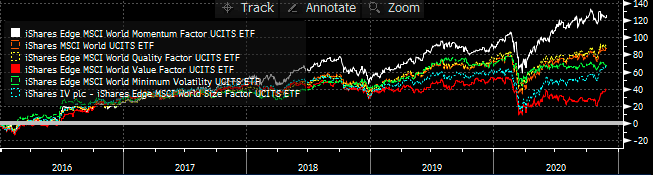 Source: Elston research, Bloomberg data A crowded trade? Data points to Momentum being a “crowded trade”, because of the number of people oerweighting stocks with momentum characteristics. This level of crowdedness can be an indicator of potential drawdowns to come. Fig.2. Momentum Factor is looking increasingly crowded 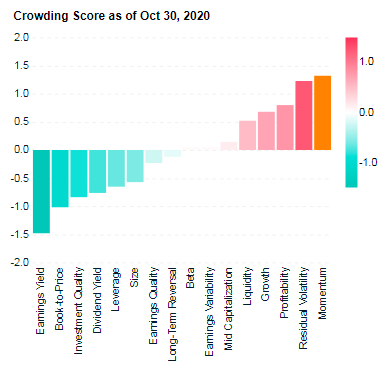 Source: MSCI Factor Crowding Model The best time to buy into a Momentum strategy has been when it is uncrowded – like in 2001 and 2009, which is also true of markets more generally. MSCI’s research suggests that with crowding scores greater than 1 were historically more likely to experience significant drawdowns in performance over subsequent months than factors with lower crowding scores. Fig.3. Factors with higher crowding score can be an indicator of greater potential drawdowns, relative to less crowded factors 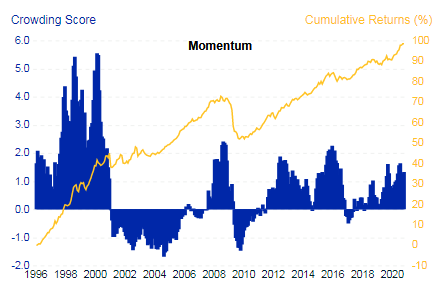 Source: MSCI Factor Crowding Model
Rotation to Value The value-based approach to investing has delivered lack lustre performance in recent times, hence strategists’ calls that there may be a potential “rotation” into Value-oriented strategies in coming months as the post-COVID world normalises. But can factors be timed? Marketing timing, factor timing? Market timing is notoriously difficult. Factor timing is no different. To get round this, a lot of fund providers have offered multi-factor strategies, which allocate to factors either statically or dynamically. Whilst convenient as a catch-all solution, unless factor exposures are dynamically and actively managed, the exposure to all factors in aggregate will be similar to overall market exposure. This has led to a loss of confidence and conviction in statically weighted multi-factor funds. Summary Factors help break down and isolate the core drivers of risk and return.
For more on Factor investing, see https://www.elstonsolutions.co.uk/insights/category/factor-investing https://www.msci.com/factor-investing |
ELSTON RESEARCHinsights inform solutions Categories
All
Archives
July 2024
|
 RSS Feed
Company |
Solutions |
|