|
Following our initiation of overage of the UK Equity Income Index/ETF universe (data to 4q17), we have updated the data for 1q18 performance update for selected indices.
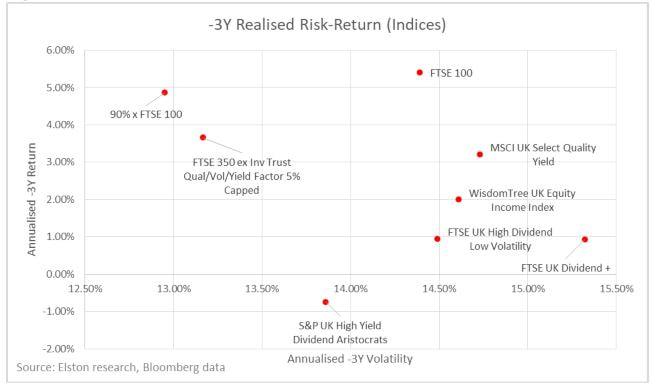
Returns For 1q18, the most defensive UK Equity Income index was the MSCI UK Select Quality Yield, tracked by ZILK, at -5.49% compared to -7.21% for the FTSE 100. On a 1Y basis, 90%xFTSE 100 returned +0.2% tracked by ZWUK, followed by -0.24% MSCI UK Select Quality Yield tracked by ZILK has performed best. On a 3Y basis our proxy benchmark for ZWUK, which takes 90%xFTSE100, returned +15.4%,, followed by +11.4% for FTSE 350 ex Inv Trust Qual/Vol/Yield Factor 5% Capped tracked by DOSH. Risk Adjusted On a 3Y basis, 90%xFTSE 100 as a proxy for the benchmark tracked by ZWUK, followed by FTSE 350 ex Inv Trust Qual/Vol/Yield Factor 5% Capped tracked by DOSH, have delivered best risk-adjusted returns. Correlation On a 3Y basis, the FTSE UK High Dividend Low Volatility Index tracked by UKHD offers most differentiated returns relative to the FTSE 100 (lowest beta and correlation). Gross Dividend Yield Over the last year WUKD has offered the highest historic dividend yield. View Report Learn about ETF Research Visit SEARCH ETF<Go> on the Bloomberg Terminal
Risk-based indices are different to factor-based indices, as they focus on the interaction between securities, not the characteristics within securities. Put simply, it's an alternative, systematic approach to asset allocation and risk management.
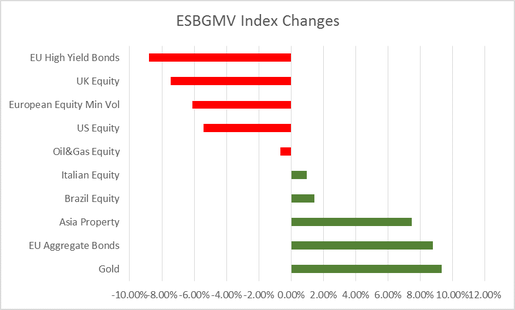
The Elston Multi-Asset Min Volatility Index (ESBGMV) launched in 2014 represents the minimum variance multi-asset portfolio for GBP investors. As it takes a systematic approach, it's always interesting to see the asset-class switches that this methodology triggers via its monthly readjustments. Comparing the index composition from 4q17 to 1q18, the biggest switches have been cutting back European High Yield Bonds and UK Equity, whilst adding to European Aggregate Bonds and Gold. View Factsheet Learn about Elston Indices Visit ESBGMV Index <Go> on the Bloomberg Terminal Source: FTSE Russell
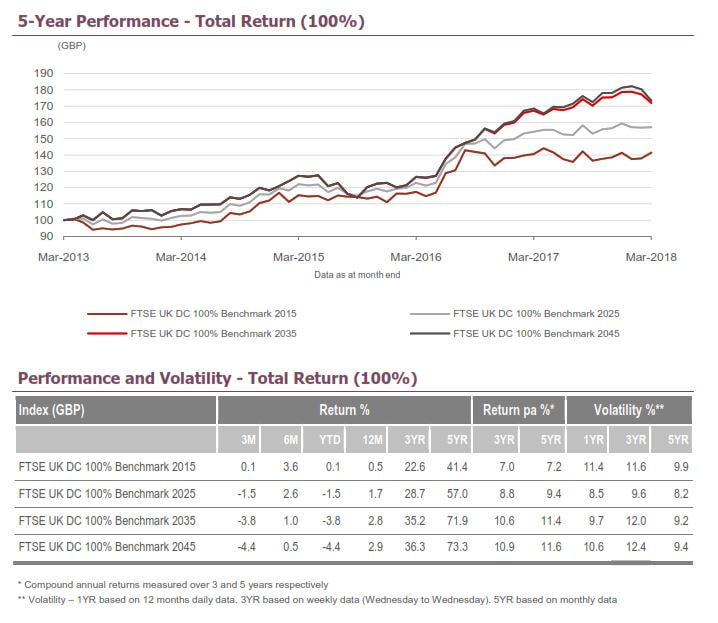
Evaluating DC pension scheme performance should be done on a cohort-by-cohort basis. The standard FTSE UK DC Benchmark Indices provide a helpful reference index for a simple equity/bond allocation. But DC schemes could consider creating an independently calculated custom benchmark to match their "glidepath". FTSE UK DC Benchmark Index Performance 1q18 performance: +0.1% 2015 Retirees, -1.5% 2025 Retirees, -3.8% 2035 Retirees, -4.4% 2045 Retirees. Annualised 3 year performance to end March 2018: +7.7% 2015 Retirees, +8.8% 2025 Retirees, +10.6% 2035 Retirees, +10.9% 2045 Retirees View Factsheet Learn about FTSE UK DC Indices Visit 1UKDC025 Index <Go> on the Bloomberg Terminal We have published the quarterly index factsheet for the Elston Strategic Beta Global Minimum Volatility Index: a multi-asset risk-based strategy. The index strategy is designed to allocate to a diverse range of asset classes so as to minimise the volatility of the overall strategy.
View Factsheet Learn about Elston Indices Visit ESBGMV Index<Go> on the Bloomberg Terminal |
ELSTON RESEARCHinsights inform solutions Categories
All
Archives
July 2024
|
Company |
Solutions |
|


 RSS Feed