
|
Elston's ESG Specialist, Andrea Acimovic, outlines how new disclosure rules around ESG funds will impact decision-makers.
Read in full  [5 min read]
1. Yield is back: for equities, bonds and alternatives - the yield drought is over 2. Selectivity matters more: within and across asset classes 3. Inflation is getting stickier: getting past the peak, but still a problem Read the summary article Find out more:
 [3 min read, open as pdf]
In this article for IG, Elston's Andrea Acimovic explores the paradox of the clean energy revolution.
Read in full In this article for IG, Elston's Andrea Acimovic explores opportunities in the ESG space.
Read in full  [3 min read, open as pdf]
 [3 min read, open as pdf]
2021 in review Our 2021 market roundup summarises another strong year for markets in almost all asset classes except for Bonds which remain under pressure as interest rates are expected to rise and inflation ticks up. Listed private equity (shares in private equity managers) performed best at +43.08%yy in GBP terms. US was the best performing region at +30.06%. Real asset exposures, such as Water, Commodities and Timber continued to rally in face of rising inflation risk, returning +32.81%, +28.22% and +17.66% respectively. 2022 outlook We are continuing in this “curiouser, through-the-looking glass” world. Traditionally you bought bonds for income, and equity for risk. Now it’s the other way round. Only equities provide income yields that have the potential to keep ahead of inflation. Bonds carry increasing risk of loss in real terms as inflation and interest rates rise. Real yields, which are bond yields less the inflation rate, are negative making traditional Bonds which aren’t linked to inflation highly unattractive. Bonds that are linked to inflation are highly sensitive to rising interest rates (called duration risk), so are not attractive either. How to navigate markets in this context? The big three themes for the year ahead are, in our view:
See full report in pdf Attend our 2022 Outlook webinar 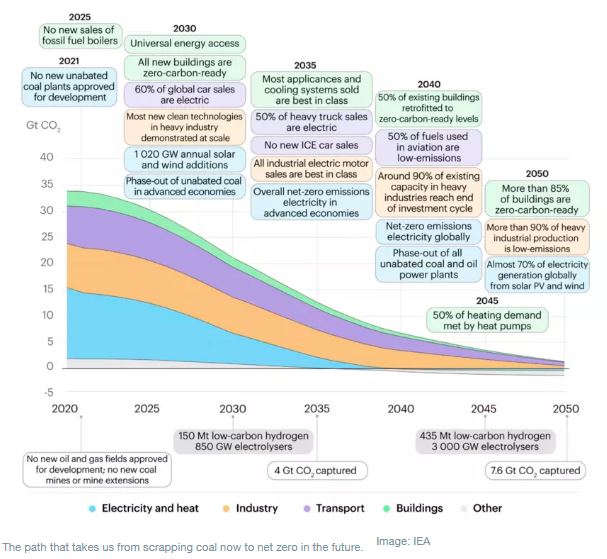 [7 min read, Open as pdf]
“A code red for humanity. The alarm bells are deafening and the evidence is irrefutable.” UN Secretary General Antonio Guterres discussing the most recent Inter-Governmental Panel on Climate Change (IPCC) report published in August 2021. For advisers looking to incorporate a Net Zero approach into a client portfolio, where ESG preferences are high, we would advocate a three-step approach. 1.Understand the Carbon footprint of your existing portfolio 2.Consider how substitutions of traditional with ESG-screened funds could reduce that Carbon footprint 3.Consider whether, and to what extent, an allocation towards climate solutions, which by their nature may be higher risk investments, will actively contribute to achieving the path to net zero. A bias towards ESG and a moderate investment in climate solutions, can help achieve those objectives for those clients who seek climate-oriented values in their investment portfolio, as well as their day-to-day living, For full article, Open as pdf 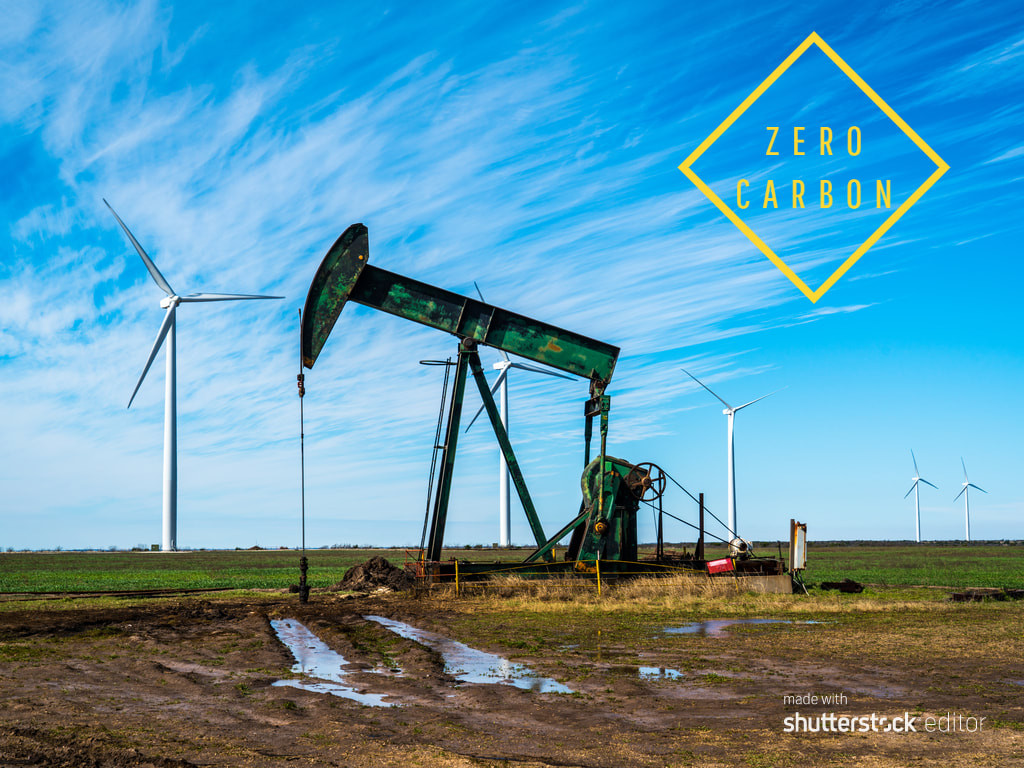 [5 min read, open as pdf]
What is Zero Carbon investing The Zero Carbon Society at Cambridge University is one of many campaign groups calling for university endowment funds to divest from all fossil fuels. This has been termed “Zero Carbon” investing. The divestment trend started in the US in 2012 when the city of Seattle divested from fossil fuels. In 2014, Stanford University followed suit. Campaigns across the US and UK led to other universities following suit. Some of the reasons universities found it hard to ensure that their investments were “fossil free” is because:
The challenge When set this challenge by a university college, we proposed to do two things. Firstly to create a Zero Carbon SRI benchmark to show how Zero Carbon investing could be done whilst also focusing on other ESG considerations. Secondly, to create a Zero Carbon portfolio to deliver on the primary aim of full divestment. Creating a Zero Carbon SRI benchmark We wanted to create a benchmark for the endowment’s managers that not only screened out fossil fuels, but went further to screen out one of the main consumer of fossil fuels, the Utilities sector, as well as other extractive industries – namely the Materials sector. We also wanted to screen in companies with high ESG scores and low controversy risk and cover the global equity opportunity set. We worked with MSCI to create a custom index, the catchily-named (for taxonomy reasons) the MSCI ACWI ex Energy ex Materials ex Utilities SRI Index (the “Custom Index”, please refer to Notice below). Creating a Zero Carbon portfolio The second part of the project was to create an implementable investment strategy that maintained a similar risk-return profile to World Equities, but fully excluded the Energy, Materials and Utilities sectors. Rather than creating a fund which introduces additional layer of costs, this was achievable using sector-based ETF portfolio. This portfolio meets the primary objective of creating a Zero Carbon, fully divested, world equity mandate. In the absence of ESG/SRI sector-based ETFs, it is not yet possible to create a sector-adjusted ESG/SRI ETF portfolio. But we expact that to change in the future. Custom Index Performance The back-test of both the custom index could deliver similar risk-return characteristics to global equities. The concern was would those back-test results continue once the index and portfolio went live. The answer is yes. Whilst the custom index has shown outperformance, that was not the objective. The objective was to access the same opportunity set, but with the fossil-free, ESG and socially responsible screens in place. Fig.1. Custom Index performance simulation from June 2012 & live performance from June 2018 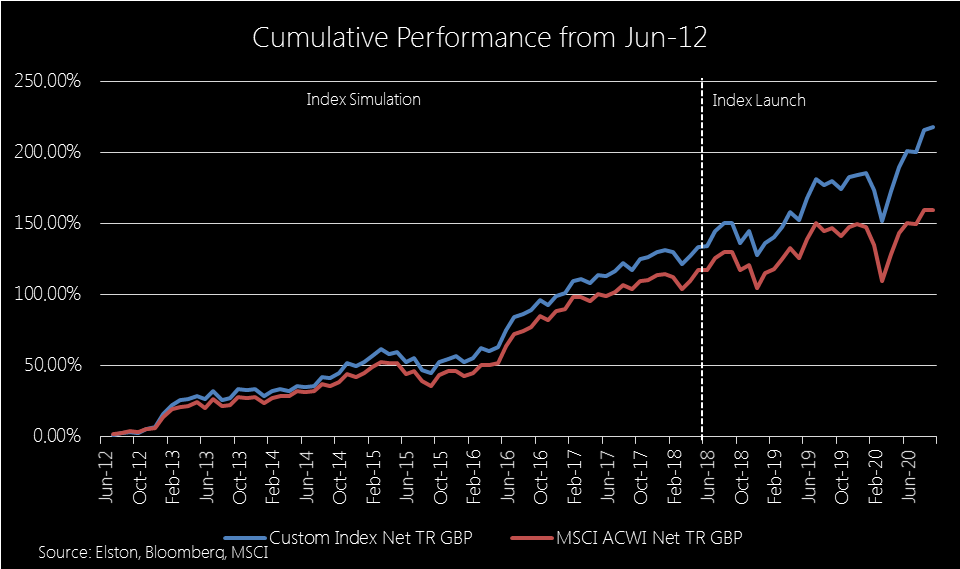 Zero Carbon Portfolio performance Similarly, the Zero Carbon portfolio has delivered comparable performance to MSCI World – hence no “missing out” on the opportunity set whilst being fully divested from fossil fuels. Although not intentional, the exclusion of Energy, Materials & Utilities has benefitted performance and meant that the performance, net of trading and ongoing ETF costs, is ahead of the MSCI World Index. Fig.2. Zero Carbon ETF portfolio performance from June 2018 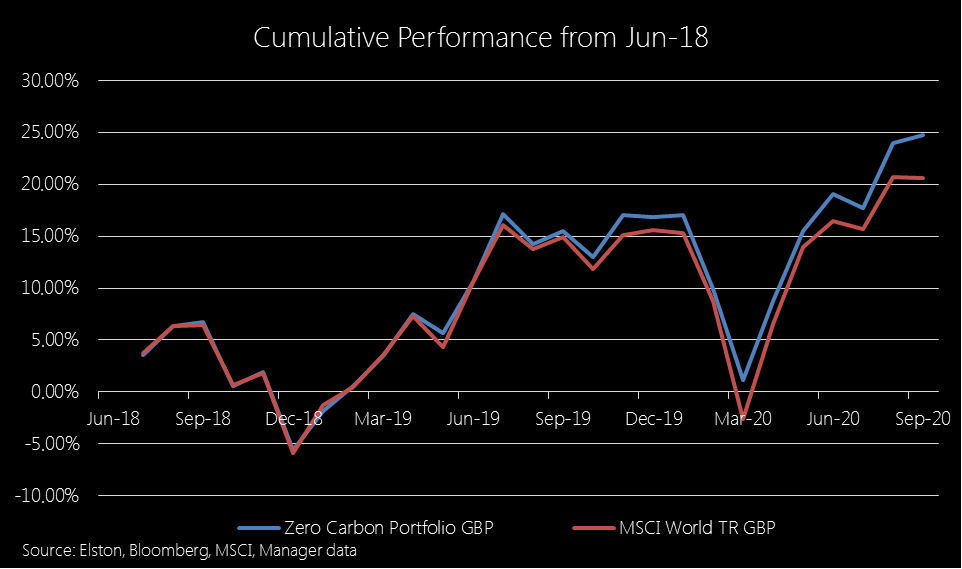 Summary
Whatever your views on the pros and cons of divestment, Zero Carbon investing is not an insurmountable challenge, and the combination of index solutions and ETF portfolios solutions creates a range of implementable options for asset owners and asset managers alike. IMPORTANT NOTICE ABOUT THE CUSTOM INDEX With reference to the MSCI ACWI ex Energy ex Materials ex Utilities SRI Index (“Custom Index”). Where Source: MSCI is noted, the following notice applies. Source: MSCI. The MSCI data is comprised of a custom index calculated by MSCI, and as requested by, Queens’ College Cambridge. The MSCI data is for internal use only and may not be redistributed or used in connection with creating or offering any securities, financial products or indices. Neither MSCI nor any third party involved in or relating to compiling, computing or creating the MSCI data (the “MSCI Parties”) makes any express or implied warranties or representations with respect to such data (or the results to be obtained by the use thereof), and the MSCI Parties hereby expressly disclaim all warranties of originality, accuracy, completeness, merchantability or fitness for a particular purpose with respect to such data. Without limiting any of the foregoing, in no event shall any of the MSCI Parties have any liability for any direct, indirect, special, punitive, consequential or any other damages (including lost profits) even if notified of the possibility of such damages.  [2 minute read, open as pdf] Sign up for our upcoming webinar on incorporating ESG into model portfolios Summary
Defining terms With a growing range of ethical investment propositions available to portfolio designers, we first of all need to define and disambiguate some terms.
Criteria-based approach works well for indices Applying ESG criteria to a universe of equities acts as a filter to ensure that only investors are only exposed to companies that are compatible with an ESG investment approach. Creating a criteria-based approach requires a combination of screening, scoring and weighting. Looking at the MSCI World SRI 5% Capped Index, for example, means:
Indices codify criteria An index is “just” a weighting scheme based on a set of criteria. A common, simple index is to include, for example, the 100 largest companies for a particular stock market. SRI indices reflect weighting schemes, albeit more complex, but importantly, represent a systematic (rules-based) and hence objective approach. However, the appropriateness of those indices is as only as good as their methodology and the quality of the screening, scoring and weighting criteria applied. Proof of the pudding To mix metaphors, the proof of the pudding is in the making of performance that is consistent with the parent index, whilst reflecting all the relevant scoring and screening criteria. This allows investors to have their ESG cake, as well as eating its risk-return characteristics. Contrast, for example, the MSCI World Index with the MSCI World Socially Responsible Investment 5% Issuer Capped Index. The application of the screening and scoring reduces the number of companies included in the index from 1,601 to 386. But the weightings adjustments are such that the relative risk-return characteristics are similar: the SRI version of the parent index has a Beta of 0.98 to the parent index and is 99.4% correlated with the parent index. Fig.1. Comparative long-term performance 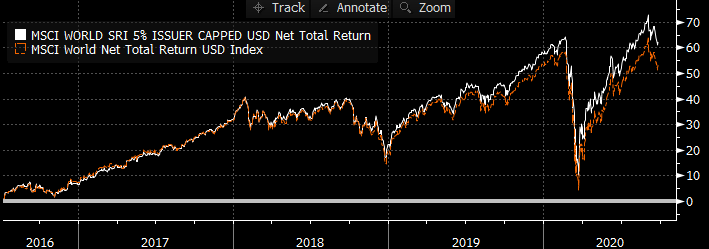 Source: Bloomberg data Fig.2. Year to Date Performance 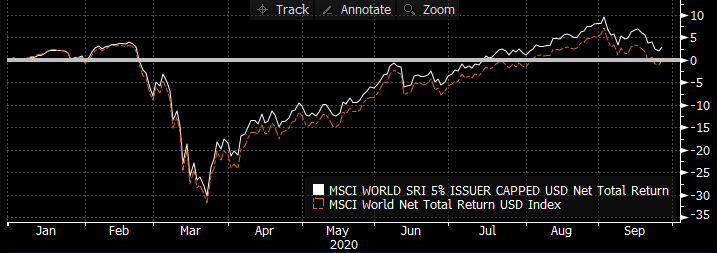 Source: Bloomberg data,
Focus on compliance, not hope of outperformance Indeed pressure on the oil price and the performance of technology this year (technology firms typically have strong ESG policies) means that SRI indices have slightly outperformed parent indices. However, our view is that ESG investing should not be backing a belief that performance should or will be better than a mainstream index. In our view, ESG investing should aim to deliver similar risk-return characteristics to the mainstream index for a given exposure but with the peace of mind that the appropriate screening and scoring has been systematically and regularly applied. [1] For more on this ratings methodology, see https://www.msci.com/esg-ratings |
ELSTON RESEARCHinsights inform solutions Categories
All
Archives
July 2024
|
 RSS Feed
Company |
Solutions |
|