Trump is putting reciprocal tariffs on world trade to start negotiations on steps to rebuild US manufacturing. Reciprocal tariffs means putting tariffs on imports from those countries which put tariffs on US imports. What does it mean for markets. What does it mean for the global economy. Will tariffs make America great again?
We explore Reeves Spring Statement 2025 and what it means for UK Growth, Inflation and Rates.
Subscribe to our weekly newsletter to get all our insights to your inbox (for UK financial advisers only)
Watch our 2025 Outlook in full What do we mean by "Zombie Inflation"? “Zombie” inflation means it is down but not dead. Inflation is past its peak and settling at or above the 2% target which is now a “floor,” not a “cap”. Wage growth pressure, trade friction and energy market volatility means that inflation is down but not dead. Inflation is past the peak but has not gone away Inflation has moderated from its peaks, but we believe it remains a very real risk. The 2% inflation target increasingly functions as a floor rather than a ceiling. Wage growth, energy volatility and geopolitical tensions could drive renewed inflationary pressures. Looking at rolling inflation for historic performance hurdles We look at rolling 5 year inflation (UK CPI) as smoothed measure to set hurdle rates for portfolios for past performance evaluation. The rolling 5 year data has not peaked yet (see chart) - it will take time for the inflation shock to wash out. Looking at breakeven inflation rates for expected return hurdles We look at 5 year breakeven inflation rates (UK BEIR) to set hurdle for target returns for UK investors. The long-term average for 5 year BEIRs is approximately 3%. In this respect forward-looking inflation expectations are also down from their peak >4%, but still high at 3.6%. How can advisers build in inflation resilience to portfolios To address this risk, portfolios should incorporate inflation-resilient asset classes, such as a tilt to yield within equities, and moderate exposure to liquid real assets, as well as short- to medium-term inflation-linked bonds. How can advisers find out more about investing in inflationary times? To find out more see all our Insights on inflation investing https://www.elstonsolutions.co.uk/insights/category/inflation [5 min read, read as pdf]
As we look forward to 2025, it is worth revisiting the themes and predictions of our 2024 outlook “turning the corner” to get a sense of what we anticipated at the time, how this informed our recommendations to UK adviser firms’ investment committees. Asset class performance for 2024 is summarised in the chart above. Our 2025 outlook is published separately. Subscribe to our weekly newsletter to get all our insights to your inbox (for UK financial advisers only) Steady as she slows In 2024, we anticipated a gradual deceleration in the U.S. economy, with markets pricing in the likelihood of a slight recession. In the event, the U.S. economy surprised on the upside. Growth forecasts were upgraded from 1.15% at the start of the year to an impressive 2.6% by year-end. This revision supported robust equity market returns and served as a reminder of the resilience of U.S. economic fundamentals. In summary, a resilient US economy defied expectations. What did we recommend to our clients at the outset and during the year? We took a balanced view between accepting concentration risk (traditional S&P 500) and diversified (active, sector exposures). We also recommended clients lean in to broader US equity corporate landscape via 1) Equal Weight and 2) US Small Caps exposures. By contrast, the UK had that shrinking feeling as regards economic growth, and although out of a technical recession, we are not confident of its prospects relative to the US. Pause before pivot At the close of 2023, we were focused on the Federal Reserve’s pause in interest rate hikes, noting that a rate cut was a question of when, not if. While the consensus view was that the first cut would be announced by mid-2024, we anticipated that the timing would hinge on the performance and strength of the U.S. economy. Indeed, the economy’s resilience delayed the start of what we anticipate to be a rate-cutting cycle to September 2024, when the Federal Reserve finally delivered a significant 50-basis-point cut. In fact, the eventual BoE Fed pivot came a month or two later than we had estimated at the start of the year, but we recommended our clients remain dynamic with regards to duration management. We recommended clients go strongly overweight duration in June as a good time to extend duration ahead of BoE cuts, with Fed following suit, and we saw the additional duration deliver returns on the bond side of the portfolio before attention shifted to debt supply and the UK budget later in the year, which led us to recommending to move back to neutral. The importance of portfolio resilience Our focus on resilience proved vital when it came to navigating the key macro factors in 2024: Growth, Inflation and Interest Rates. For Growth, anticipating a soft landing for the US economy, we highlighted the potential outperformance of cyclical sectors, and momentum, yield and size factors. In the event, momentum emerged as the best-performing factor, with yield and size also delivering strong returns. For Rates, we adjusted duration exposure mid-year to capture the effect of falling policy rates, aligning portfolios with a changing interest rate environment. For Inflation, which remained above target, the inclusion of liquid real assets (but to a lesser extent than in 2022) and shorter duration inflation-linked bonds, ensured continued portfolio resilience. We continue to emphasise the importance of a diversified alternatives exposure from a correlation perspective, not just in name. Our recommendation to consider Private Market Managers and Gold & Precious Metals paid off during the year – as these were the best performing asset classes for the year, outperforming world and US equities. Political and Geopolitical risks In a year of elections, we saw a change in government in the UK and in the US following Trump’s Presidential win. Both have a greater impact on bond yields and currency dynamics than equity markets, in our view. Geopolitical risks remain elevated with the Russia-Ukraine war continuing to grind, escalating conflict and contagion in the Middle East – all at tragic human cost. Conclusion Markets did indeed turn a corner in 2024, with economic growth, earnings and equity market returns outperforming expectations. With 2024 in the rear-view mirror, it’s time to look ahead to 2025. Our 2025 outlook is published separately. Henry Cobbe, CFA Head of Research, Elston Consulting [5 min read, open as pdf]
Why does the UK equity allocation decision matter so much The difference between the best performing and worst performing multi-asset discretionary investment managers has largely been a function of one key decision: to what extent have they had a UK equity home bias? Home bias means having an above index-weight in your domestic market. Academic research on home bias tends to be written from a US perspective, so its conclusions are less relevant for UK asset allocators. Within equities, the performance differential between the US and UK has been so extreme over the last decade or so , that this has been the singlemost important decision that has impacted portfolio performance – far more so than any active or passive debate, or active fund selections. For financial advisers that rely on third party asset allocation providers, the decision has been made for you, and your clients’ portfolio performance becomes a function of your chosen risk profiling tool. For the last decade or so, multi-asset portfolios that have had a low or no UK equity home bias have performed best. Those that have a high bias have performed worst. Choose your strategic asset allocation carefully To show this, see the chart below which shows the “Capital Allocation Line” linking the UK Risk Free Rate (SONIA) to a) world equity risk-return (represented by an index-tracking ETF), b) UK equities risk-return (represented by an index-tracking ETF), and c) a 80/20 allocation between the two. The risk-return for a 20%, 40%, 60%, 80% and 100% equity/cash portfolio would sit on each Capital Allocation Line with increasing increments of volatility (as percentage equity risk broadly translates to the proportion of annualised equity volatility). Portfolio performance is broadly a function of which Capital Allocation Line a portfolio’s Strategic Asset Allocation has been constructed around. When reviewing multi-asset managers, it makes sense to do so relative to these Capital Allocation Lines. Fig.1. Multi-asset portfolios are built with no, partial, or high home bias [see pdf version] Given the stark relative performance between portfolios built with a high bias and those built with no bias, it’s no surprise that UK institutional investors and UK wealth managers have been gradually deallocating from their home market. Adding to the UK market’s woes, its weight in global equity indices has also been shrinking. UK equities in a multi-asset portfolio The gradual relative shrinkage of UK equities within global equity indices is well documented. The decline has become more noticeable since December 2019 as the tech rally started to gain pace. UK listed companies now make up approximately just 4% of the global equity benchmark. Put differently, the largest US technology company is today worth almost the same as the entire FTSE 100. It wasn’t forever so. UK equities have shrunk from representing about 10% of global equities (developed and emerging markets combined) as recently as 2011. The shrinkage is a function of simple maths. A far greater number of the rest of the world’s listed companies (predominantly the US) have grown their earnings (and hence market capitalisation) far more than the UK’s listed companies. As a result, the UK’s relative size has shrunk. The problem is now being compounded by the number of large, listed companies shrinking further as some move their listings to the US to obtain a better valuation, and others being acquired and becoming privately owned. To reverse this trend, London needs to remain an attractive destination to base, list and grow companies from around the world. UK wealth managers have been de-allocating gradually UK discretionary investment managers have been deallocating from UK equities as they removed their “home bias.” In 2000, approximately 70% of a “balanced” portfolio’s equity allocation was in UK equities based on MSCI PIMFA (formerly FTSE APCIMS data[1]), compared to 33% today. This allocation is determined to be reflective of PIMFA’s member firms by an index committee including representatives from leading UK wealth managers[2]. The chart below shows the UK equity proportion or “home bias” used in UK wealth management benchmarks based on MSCI PIMFA and FTSE APCIMS data, and an estimate of the UK equity allocation within global equity index funds. Fig.2. UK wealth managers have gradually reduced their home bias over time [see pdf version] How much is enough? In our work with UK financial advisers and wealth managers, we found a range of opinions. We have always considered a UK equity allocation of 30-50% to be too high, even though that was often the existing default for firms using third party asset allocation models and the largest UK wealth managers that govern the reference benchmarks above. Whilst intellectually we can (and did) make the case for no home bias[3] (consistent with other institutional investors and consultants), we found that adviser firms in the retail market (and indeed their end clients) would be more focused on the FTSE 100 and would want and expect to see a range of UK-focused funds in a portfolio. Furthermore, whereas the well-known SPIVA®[4] studies evidence that in highly efficient markets (such as the US) it is challenging for active managers to persistently outperform the index, the same studies show that in less efficient markets (such as UK small-caps), active managers can persistently outperform the index[5]. On this basis, we alighted on a target 20% UK equity allocation as a mid-point between a high bias of 40% and no bias (index weight). Twenty’s plenty Deciding what UK equity allocation to have is a key part of a strategic asset allocation discussion for investment committees of wealth management firms and financial adviser firms alike. For those that rely on third-party asset allocation models, the decision is made for you. A benchmark where the strategic asset allocation is constantly changing can be a challenge to evaluate long-run performance as the framework is always changing. In our multi-asset indices for GBP-based investors[6], we therefore use this static 20% UK home bias equity allocation as a “neutral” for the entire index history and going forward. This means that our benchmark has a consistent (unchanging) framework, that creates a theoretical “neutral” allocation, which UK managers and advisers can either adopt or allocate against. Whilst customising an index to reflect one view won’t keep everybody happy, the failure to cutomise an index to incorporate a UK equity home bias could create even greater controversy as some managers have found out[7]. Interestingly the proposed £5,000 UK ISA Allowance would make up 20% of a total £25,000 ISA contribution, so we remain comfortable with a 20% UK equity allocation within our multi-asset indices. UK equities as a diversifier Whilst US and World Equities have persistently outperformed the UK equity market, we think the UK equity market is looking interesting once again not just from a valuation perspective, and not necessarily from a returns perspective, but primarily as an equity portfolio diversifier owing to its decorrelation from the US. The structure of the UK equity market (low valuation, value/yield bias, old-world defensive sectors such as energy, mining, healthcare) is so different to the structure of the US equity market (high valuation, growth bias, new-world technology sector concentration), that they complement each other rather well as a diversifier. Recall 2022, the inflation shock from the Russia/Ukraine war and related sanctions meant that the UK equity market was up, when the US and hence world equities were down. Similarly this year, the UK equity market has frequently moved inversely to the US and World equities. Fig.3. US and World Equities move lock-step, UK equities do not [see pdf version] Whilst US and World equities move lock-step, the different return “pattern” for UK equities makes it an interesting diversifier from a portfolio construction perspective: The measure of “true diversification” is correlation. By combining lower correlated assets, the risk of the whole can be less than the sum of parts. Long-term and short-term correlations both matter When building long-term strategic asset allocation models, asset allocators look at long-term risk, return and correlation structure (either forward-looking estimates or historical data) and refresh this every few years. Using 10 year historic data as at end 2023, the US and UK correlation to world equities is 0.97 and 0.80 respectively. However to understand current market conditions and how portfolios are actually behaving, it is also important to look at short-term correlations. Using rolling 1 year correlation data, the US and UK correlation to world equities is 0.97 and 0.61 respectively. Hence a portfolio built using long-run estimates will look very different to one built using short-run estimates. This is why we believe in an adaptive approach to asset allocation that considers both long-run and short-run, risk and correlation structure. Fig.4. Long-run and short-run correlations are similar for the US but different for the UK [see pdf version] The changing nature of UK equity correlation As US equities make up a growing concentration of world equity indices, it is unsurprising that the short-run rolling 1 year correlation between US and World Equities remains consistently high (they move lock-step, as discussed above) and in line with its long-run figure. By contrast, the short-run 1 year correlation of UK vs World Equities is not stable. We can see two clear periods of material disconnect. One following Brexit and the second following Covid and subsequent related inflation shock and the marked by divergence between tech-oriented US market and value-oriented UK market. The chart below is why we are currently positive on the UK equity market. Not just on valuation grounds, not just as a region- or sector-based diversifier, but as a genuinely less correlated market. Its lower correlation to World Equities, unlike the US, enables risk-based diversification within a portfolio’s equity allocation. Fig.5. UK Equity has become less correlated with world equities increasing its diversifier status [see pdf version] For a defensive approach, think dividends The UK equity market returns are underpinned by dividend generation. Looking at the returns of the FTSE All-Share Index Total Returns (which includes reinvested dividends) and the FTSE All-Share Price Index (which assumes dividends are paid out and not reinvested), we can see that reinvested dividends represent 41.6% of cumulative total return of the UK equity market from 2008 to 2023 (see below). This should prove even more defensive in challenging markets. Fig.6. FTSE All Share: Total and Price Return and reinvested income contribution to returns [see pdf version] Summary Whilst there have been significant recent outflows from UK equity funds, perhaps investors are missing one key consideration: that of decorrelation. Having more than one global equity fund provides no diversification from a risk perspective. They will likely move broadly in tandem, regardless of which active manager, and regardless as to whether its active or passively managed. But pairing a global or US equity fund with a UK equity fund introduces true (risk-based) diversification within the equity portion of a portfolio because of the UK’s low correlation and very different and sometimes opposite return pattern. [1] This is the current version of a long-standing index series currently called the MSCI PIMFA Private Investor Indices. The original FTSE APCIMS Indices were renamed FTSE WMA Private Investor Indices in 1q14. The WMA transferred its Private Investor Indices to MSCI from 1st March 2017, and they were renamed MSCI PIMFA Private Investor Indices on 1st June 2017, following the merger of the Wealth Management Association (WMA) and Association of Professional Financial Advisers (APFA). We have combined the asset allocation history of the above indices to create a single time-series. [2] The MSCI PIMA Private Investor Indices have an asset allocation determined by its index committee that aims to ensure that the asset allocation is reflective of its member firms. The index committee includes representatives from Canaccord Genuity Wealth, Investec Wealth and Investments, Rathbones, JM Finn, Brooks MacDonald, Killik & Co, Close Brothers, Evelyn Partners, Quilter Cheviot and others. For more information, see https://www.pimfa.co.uk/about-us/pimfa-groups/private-investor-indices-committee/ [3] See our July 2020 article https://www.elstonsolutions.co.uk/insights/home-equity-bias-is-irrational-and-has-been-penalised-uk-investors [4] See our October 2021 article https://www.elstonsolutions.co.uk/insights/understanding-spiva [5] See our December 2022 article https://www.elstonsolutions.co.uk/insights/are-active-managers-improving [6] See https://www.elstonsolutions.co.uk/our-indices.html for more information [7] https://www.peelhunt.com/news-insights/articles/selling-down-the-uk/ [5 min read, open as pdf]
[5 min read, open as pdf]
[5 min read, open as pdf]
[5 min read, open as pdf]
[5 min read, open as pdf]
[5 min, open as pdf]
[5min read, open as pdf]
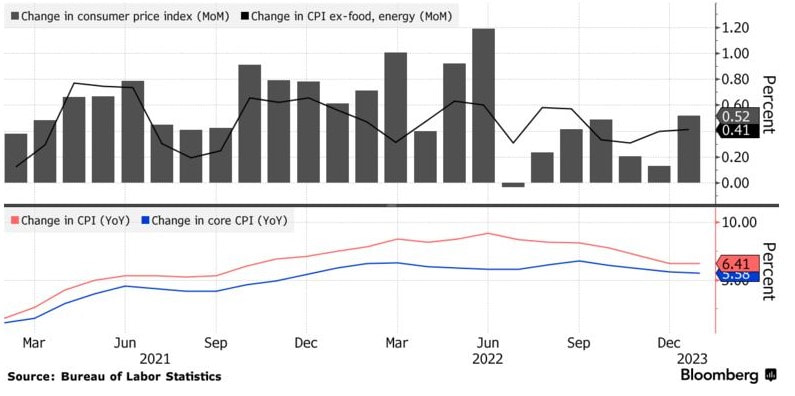
- This is in line with the survey estimate… - … and a decrease from 7.1%yy last month - Lessening inflation pressures means US is past the peak Open as pdf for full update including charts NMA speaks to investment consultant Henry Cobbe about positioning equities for higher inflation using sector and factor equity investing.
Listen to the podcast [5 min read]
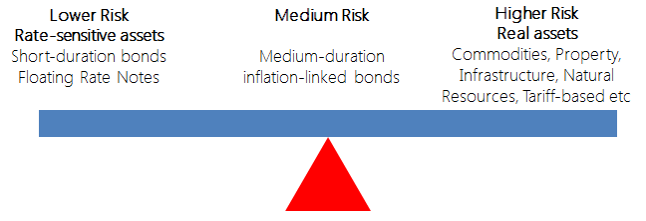
1. Yield is back: for equities, bonds and alternatives - the yield drought is over 2. Selectivity matters more: within and across asset classes 3. Inflation is getting stickier: getting past the peak, but still a problem Read the summary article Find out more:
UK inflation at 10.7%yy for Nov-22
This is lower than 10.9%yy survey estimate… … and an decrease from 11.1%yy last month Represents falling inflationary pressures For full update including charts, open as PDF US inflation at 7.1%yy for Nov-22
This is lower than the survey estimate… … and a decrease from 7.7%yy last month Represents lessening inflation pressures For full update including charts, open as pdf
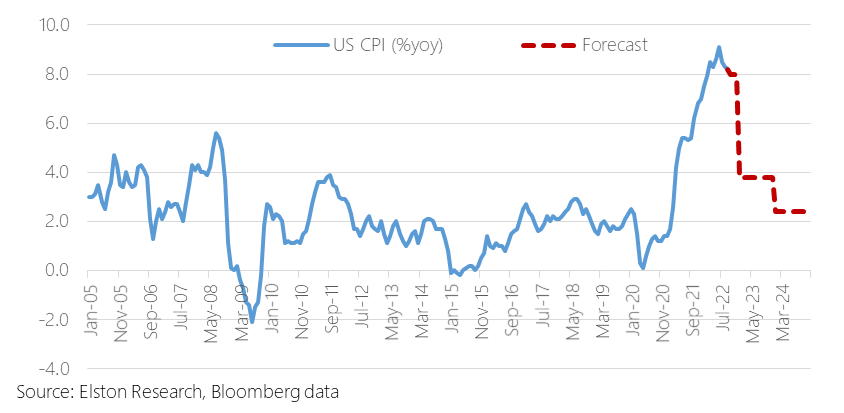
 [5 min read, open as pdf]
UK inflation at 11.1%yy for Oct-22
For full updates including charts, open as pdf |
ELSTON RESEARCHinsights inform solutions Categories
All
Archives
April 2025
|