
 Our head of fund research, Jackie Qiao, shares her desert island fund picks with Citywire.
Read in full  The purpose of including alternatives in a portfolio, is for one reason: diversification. But how can we be sure alternatives are doing their job?
Read the full article in FT Adviser or watch the CISI-endorsed CPD webinar  [3 min read, open as pdf]
Watch the CISI-endorsed CPD webinar on this topic  [5 min read, open as pdf]
 Central Banks' policy rates are expected to pivot towards cuts in 2024 with a material impact on asset class perspectives.
Read the full article in FT Adviser Wealth managers discuss the ongoing issues with property funds and explain how investors should get their exposure to the asset class going forward.
Read the full article in Trustnet.  [3 min read - open as pdf]
 [5 min read, open as pdf]
 [3 min read - open as pdf]
 [5 min read, open as pdf]
 [5 min read, open as pdf]
 [5 min read]
1. Yield is back: for equities, bonds and alternatives - the yield drought is over 2. Selectivity matters more: within and across asset classes 3. Inflation is getting stickier: getting past the peak, but still a problem Read the summary article Find out more:
 [5 min read, open as pdf]
A private market allocation is structurally hard to reverse if things go wrong with any of 1) the investor’s liquidity needs, 2) the private market fund’s underlying investments, or 3) the realised returns relative to risk-free investments (e.g. gilts) for a given term. As such, an allocation to private markets should be seen more like an irreversible decision, unlike almost all other investments available to institutional investors which can be sold at a day, week or month’s notice. In this brief note, we do not set out the case for investing in private markets – that has been set out extensively elsewhere. We do however raise some points of challenge to those stated advantages. [Read full paper as pdf]  [3 min read, open as pdf]
In this article for IG, Jackie Qiao, Head of Fund Research at Elston Consulting, discusses the value of holding gold in times of market stress.
Read in full  [3 min read, open as pdf]
 [3 min read]
 [5 min read, open as pdf]
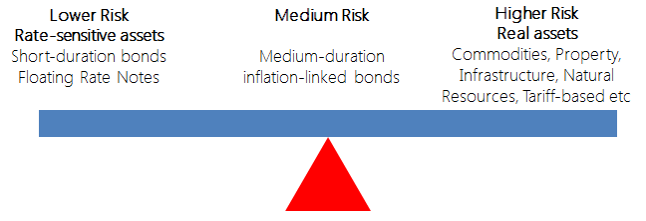
With low growth, soaring inflation and spiking interest rates, advisers need to rethink the definition of risk. Focus on volatility is focus on the “wrong problem”. Instead, advisers should focus on preserving purchasing power (mitigate inflation risk) to protect client outcomes. That requires a fundamental rethink around traditional definitions of risk, asset allocation and diversification. For full article including charts, open as pdf With inflation at current levels, nominal bonds will remain under pressure. We explore the more resilient alternatives within the bonds universe as well as property, infrastructure, liquid real assets and targeted absolute return funds.
For full article, see Trustnet.  [5 min read, open as pdf]
Read full article with charts |
ELSTON RESEARCHinsights inform solutions Categories
All
Archives
July 2024
|
 RSS Feed
Company |
Solutions |
|