Elston supports UK financial advisers CIP/CRP/MPS
  • WHO WE ARE
    • About
    • Our Journey
    • What Our Clients Say
  • WHAT WE DO
    • Elston Portfolios >
      • Our Portfolios
      • Adaptive Portfolios
      • Retirement Portfolios
      • Sustainable Portfolios
      • Smoothed Portfolios
      • All Weather Portfolio UK
      • Money Market Portfolio
    • Custom Portfolios >
      • Custom Portfolios
    • MINERVA
    • CGT Solutions >
      • Our CGT Solutions
      • Avastra Portfolios
      • Onshore Bonds
      • Direct Gilts
    • Adviser Support >
      • Our Adviser Support
      • CIRP
      • Investment Committee Support
      • Regulatory Support
      • Analytics, Factsheets & Reporting
      • CPD
    • Fund Solutions >
      • Our Funds
      • Custom Funds
    • Index Solutions >
      • Our Indices
      • UK Equity Income
      • Sector Equal Weight
      • Factor Equal Weight
      • Liquid Real Assets
      • Gold and Precious Metals
      • Permanent Portfolio UK
      • UK Multi-Asset Indices
      • Custom Indices
  • Insights
  • Subscribe
  • Contact

Asset Allocation Research for UK Advisers

2024 investment review

3/1/2025

 
Picture
[5 min read, read as pdf]
​
  • The US economy outperformed expectations
  • The long-awaited pivot came through
  • Portfolio resilience proved key

As we look forward to 2025, it is worth revisiting the themes and predictions of our 2024 outlook “turning the corner” to get a sense of what we anticipated at the time, how this informed our recommendations to UK adviser firms’ investment committees.  Asset class performance for 2024 is summarised in the chart above.  Our 2025 outlook is published separately.
Subscribe to our weekly newsletter to get all our insights to your inbox (for UK financial advisers only)

Steady as she slows
In 2024, we anticipated a gradual deceleration in the U.S. economy, with markets pricing in the likelihood of a slight recession. In the event, the U.S. economy surprised on the upside. Growth forecasts were upgraded from 1.15% at the start of the year to an impressive 2.6% by year-end. This revision supported robust equity market returns and served as a reminder of the resilience of U.S. economic fundamentals.  In summary, a resilient US economy defied expectations.
What did we recommend to our clients at the outset and during the year? We took a balanced view between accepting concentration risk (traditional S&P 500) and diversified (active, sector exposures).  We also recommended clients lean in to broader US equity corporate landscape via 1) Equal Weight and 2) US Small Caps exposures.
By contrast, the UK had that shrinking feeling as regards economic growth, and although out of a technical recession, we are not confident of its prospects relative to the US.

Pause before pivot
At the close of 2023, we were focused on the Federal Reserve’s pause in interest rate hikes, noting that a rate cut was a question of when, not if. While the consensus view was that the first cut would be announced by mid-2024, we anticipated that the timing would hinge on the performance and strength of the U.S. economy. Indeed, the economy’s resilience delayed the start of what we anticipate to be a rate-cutting cycle to September 2024, when the Federal Reserve finally delivered a significant 50-basis-point cut.
In fact, the eventual BoE Fed pivot came a month or two later than we had estimated at the start of the year, but we recommended our clients remain dynamic with regards to duration management.  We recommended clients go strongly overweight duration in June as a good time to extend duration ahead of BoE cuts, with Fed following suit, and we saw the additional duration deliver returns on the bond side of the portfolio before attention shifted to debt supply and the UK budget later in the year, which led us to recommending to move back to neutral.

The importance of portfolio resilience
Our focus on resilience proved vital when it came to navigating the key macro factors in 2024: Growth, Inflation and Interest Rates.
For Growth, anticipating a soft landing for the US economy, we highlighted the potential outperformance of cyclical sectors, and momentum, yield and size factors. In the event, momentum emerged as the best-performing factor, with yield and size also delivering strong returns. For Rates, we adjusted duration exposure mid-year to capture the effect of falling policy rates, aligning portfolios with a changing interest rate environment. For Inflation, which remained above target, the inclusion of liquid real assets (but to a lesser extent than in 2022) and shorter duration inflation-linked bonds, ensured continued portfolio resilience.  We continue to emphasise the importance of a diversified alternatives exposure from a correlation perspective, not just in name.
Our recommendation to consider Private Market Managers and Gold & Precious Metals paid off during the year – as these were the best performing asset classes for the year, outperforming world and US equities.

Political and Geopolitical risks
In a year of elections, we saw a change in government in the UK and in the US following Trump’s Presidential win.  Both have a greater impact on bond yields and currency dynamics than equity markets, in our view.
Geopolitical risks remain elevated with the Russia-Ukraine war continuing to grind, escalating conflict and contagion in the Middle East – all at tragic human cost.

Conclusion
Markets did indeed turn a corner in 2024, with economic growth, earnings and equity market returns outperforming expectations.  With 2024 in the rear-view mirror, it’s time to look ahead to 2025.  Our 2025 outlook is published separately.

Henry Cobbe, CFA
Head of Research, Elston Consulting

DIVIDENDS ARE KEY TO UK TOTAL RETURNS

16/2/2024

 
Picture
[3 min read, open as pdf ]
  • Since 2008, dividends represent 42% of UK equity total returns
  • Dividend oriented strategies could help underpin future returns
  • Dividend Yield factor equities typically outperform in falling rate regime
Read full article here

all eyes on the pivot

31/1/2024

 
Picture
Central Banks' policy rates are expected to pivot towards cuts in 2024 with a material impact on asset class perspectives.

Read More

Citywire PODCAST: IS YIELD BACK?

18/1/2023

 
Picture
Wealth Manager's Ross Miller chats to Elston Consulting's Henry Cobbe. They discuss the return of yield and how it plays out across equities, bonds and alternatives.
Listen to the podcast

Yield is back!

6/1/2023

 
Picture
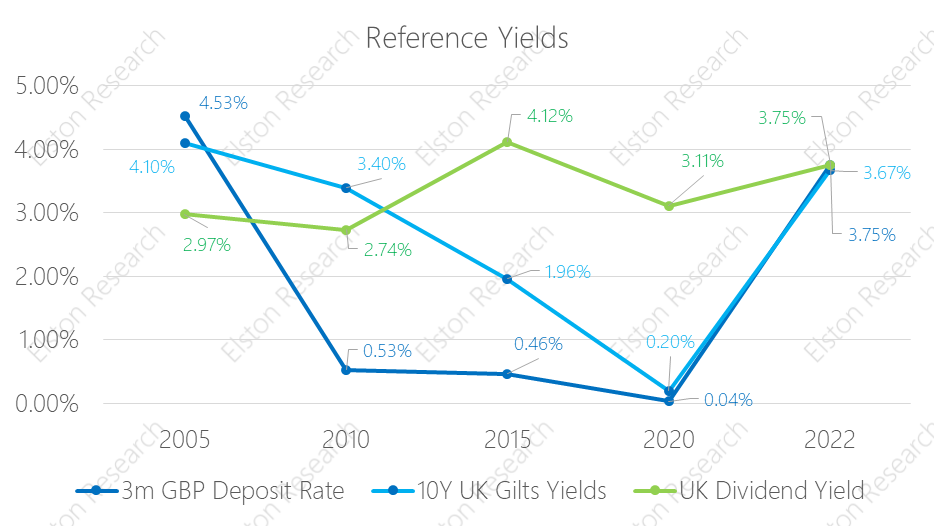
[5min read, open as pdf]

  • After a decade of suppression, yield is back
  • Return of nominal (and real) yields forces asset repricing
  • Yield can help underpin returns in uncertain times

Infrastructure in focus: building back better

16/9/2022

 
Picture
[3 min read, open as pdf]
  • Infrastructure spending to stimulate growth
  • Beyond the US, this is a global trend
  • Accessing the infrastructure beneficiaries
In this Insight we explore the increase in infrastructure spending and ways of accessing this exposure with index-tracking ETFs.

DIVERSIFYING INCOME GENERATION

14/1/2022

 
Picture
[3 min read, open as pdf]

  • Income from bonds can’t keep up with inflation
  • Multi-asset income enables a diversified income stream
  • Balance required between additional yield and higher level of risk

Through the looking glass: a curiouser new paradigm
Traditionally you bought bonds for income, and equity for risk.
Ironically, now it’s the other way round.

Read the full article
Watch the CPD webinar: Diversifying income risk
Find out more

2022 outlook: key themes

11/1/2022

 
Picture

[3 min read,  open as pdf]
​
  • Adapting portfolios for inflation
  • Income generation in a negative real yield world
  • Positioning portfolios for climate transition
 
2021 in review
Our 2021 market roundup summarises another strong year for markets in almost all asset classes except for Bonds which remain under pressure as interest rates are expected to rise and inflation ticks up.
Listed private equity (shares in private equity managers) performed best at +43.08%yy in GBP terms.  US was the best performing region at +30.06%.
Real asset exposures, such as Water, Commodities and Timber continued to rally in face of rising inflation risk, returning +32.81%, +28.22% and +17.66% respectively.

2022 outlook
We are continuing in this “curiouser, through-the-looking glass” world.  Traditionally you bought bonds for income, and equity for risk.  Now it’s the other way round.
Only equities provide income yields that have the potential to keep ahead of inflation.  Bonds carry increasing risk of loss in real terms as inflation and interest rates rise.
Real yields, which are bond yields less the inflation rate, are negative making traditional Bonds which aren’t linked to inflation highly unattractive.  Bonds that are linked to inflation are highly sensitive to rising interest rates (called duration risk), so are not attractive either.
How to navigate markets in this context?
The big three themes for the year ahead are, in our view:
  1. Adapting portfolios for inflation
  2. Income generation in a negative real yield world
  3. Positioning portfolios for climate transition
We explore each in turn, as well as reviewing updated Capital Market Assumptions for expected returns from different asset classes.

See full report in pdf
Attend our 2022 Outlook webinar

Getting ready for Negative Interest Rates in the UK

12/3/2021

 
Picture
[3 min read, open as pdf]
​
  • Negative Interest Rate Policy (“NIRP”) is a “last resort” policy tool
  • The UK is getting ready for “NIRP”
  • The hunt for yield and alternatives to cash
 
A “last resort” policy tool
Zero & Negative Interest Rate Policy are Non-Traditional forms of Monetary Policy is a way of Central banks creating a disincentive for banks to hoard capital and get money flowing.
Zero Interest Rate Policy (ZIRP) is when Central Banks set their “policy rate” (a target short-term interest rate such as the Fed Funds rate of the Bank of England Base Rate) at, or close to, zero.  ZIRP was initiated by Japan in 1999 to combat deflation and stimulate economic recovery after two decades of weak economic growth.
Negative Interest Rate Policy (NIRP) is when Central Banks set their policy rate below zero.  Japan, Euro Area, Denmark, Sweden are currently using a NIRP. US & UK are currently using a ZIRP, and are considering a NIRP.
​
Fig.1. Advanced economy policy rates
Picture
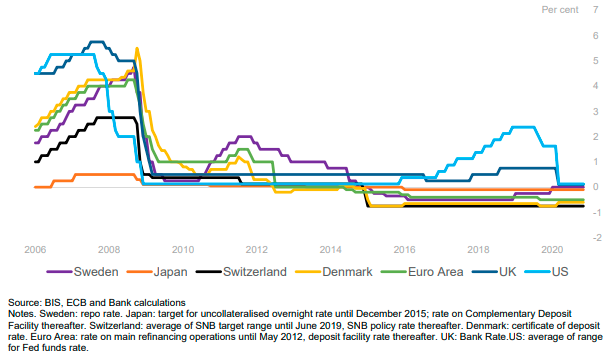
Whilst bond prices may imply negative real yield, or negative nominal yields, a NIRP impacts the rates at which the Central Bank interact with the wholesale banking system and is intended to stimulate economic activity by disincentivising banks to hold cash and get money moving.  A NIRP could translate to negative wholesale rates between banks, and negative interest rates on large cash deposits, but not necessarily retail lending rates (e.g. mortgages).

Ready, steady, NIRP
Negative Interest Rates were used in the 1970s by Switzerland as an intervention to dampen currency appreciation.  .  It was the subject of academic studies and was seen as a last resort Non-Traditional Monetary policy during the Financial Crisis of 2008 and during the COVID crisis of 2020. Sweden adopted NIRP in 2009, Denmark in 2012, and Japan & Eurozone in 2014.  The Fed started looking closely at NIRP in 2016.

According Bank of England MPC minutes of 3rd March 2021, wholesale markets are generally prepared for negative interest rates as have already been operating in a negative yield environment.  By contrast, retail banks may need more time to prepare for negative interest rates to consider aspect such as variable mortgage rates.

There are arguments for and against NIRP.  The main argument for is that NIRP is stimulatory.  The main argument against is that NIRP failed to address stagnation and deflation in Japan and can create a “liquidity trap” where corporates hoard capital rather than spend and invest.

The hunt for yield
With negative interest rates, there will be an even greater hunt for yield.    We look at the some of the options that advisers might be invited to consider.
  • Foreign Exchange: This is what drove many Japanese retail investors to open savings accounts in foreign currencies that – despite the exchange rate risk – paid a greater interest rate.
  • Structured Retail Products may offer high headline yields, these typically involve a complex return pay-off or conditionality linked to an index level such as the FTSE 100.  Return and risk cannot be created or destroyed.  Structured Products simply re-distribute the pay-offs between issuer and investor and – in aggregate – represent market returns less product costs and commissions.  We do not consider these as appropriate alternatives to Cash in a NIRP environment, or at all.
  • Mini-Bonds that offer too-good-to-be-true interest rates that lure investors in to speculative investment schemes have, thankfully, been banned for promotion to retail investors.
  • Up-risking: Alternative yield options necessarily require a modest “up-risking” relative to the zero-volatility and guaranteed (if paltry) return on cash deposits.  This up-risking could include money market funds (which will also come under interest rate pressure), longer dated bonds, and ultimately equities.

Getting the balance right between additional non-negative income yield and additional downside risk will be key for investors and their advisers when preparing for and reacting to a NIRP environment.

Dividend cuts force focus on the right kind of income

5/10/2020

 
Picture
[5 minute read, open as pdf]
Sign up for our upcoming CPD webinar on diversifying income risk

Summary
  • Dividend concentration risk is not new, just more visible
  • Quality of income, not quantity of yield, matters most
  • The advantage of a multi-asset approach

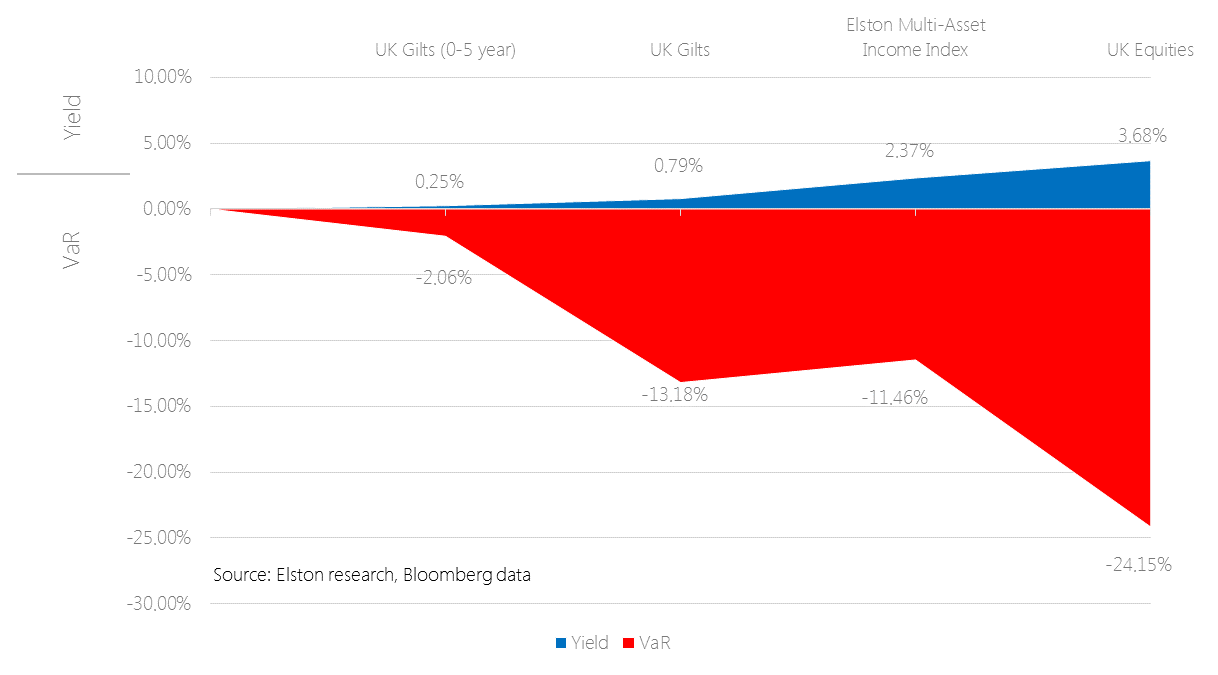
​Dividend concentration risk is not new, just more visible
A number of blue chip companies announced dividend reductions or suspensions in response to financial pressure wrought by the Coronavirus outbreak. This brought into light the dependency, and sometimes over-dependency, on a handful of income-paying companies for equity income investors.
For UK investors in the FTSE 100, the payment of dividends from British blue chip companies provides much of its appeal.  However a look under the bonnet shows a material amount of dividend concentration risk (the over-reliance on a handful of securities to deliver a dividend income).
On these measures, 53% of the FTSE 100’s dividend yield comes from just 8 companies; whilst 22% of its dividend yield comes from energy companies.  The top 20 dividend contributors provide 76% of the dividend yield.
We measure dividend concentration risk by looking at the product of a company’s weight in the index and its dividend yield, to see its Contribution to Yield of the overall index.

Fig.1. FTSE 100 Contribution to Yield, ranked
Picture
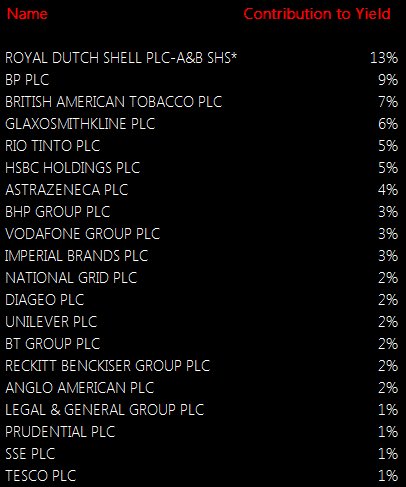
Source: Elston research, Bloomberg data, as at June 2020

Quality of Income

More important than the quantity of the dividend yield, is its quality.
As income investors found out this year, there’s a risk to having a large allocation to a dividend payer if it cuts or cancels its dividend. 
Equally, there’s a risk to having a large allocation to a dividend payer, whose yield is only high as a reflection of its poor value.
Screening for high dividend yield alone can lead investors into “value-traps” where the income generated looks high, but the total return (income plus capital growth) generated is low.
Contrast the performance of these UK Equity Income indices, for example.
​
Fig.2. UK Equity Income indices contrasted
Picture
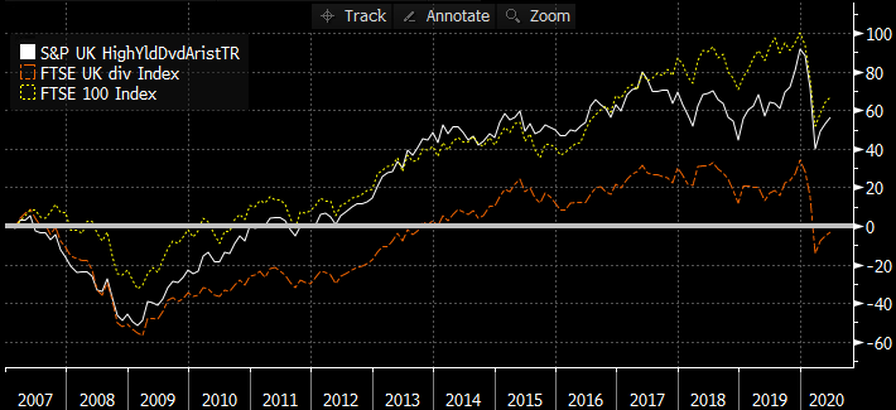
Source: Elston research, Bloomberg data. Total returns from end December 2006 to end June 2020 for selected UK Equity Indices.  Headline Yield as per Bloomberg data as at 30th June 2020 for related ETFs.

​The headline yield for the FTSE UK Dividend+, FTSE 100 and S&P UK Dividend Aristocrat Indices was 8.10%, 4.44%, and 4.07% respectively as at end June 2020.
However, the annualised long-run total return (income plus capital growth) 1.03%, 4.29% and 4.82% respectively.
Looking at yield alone is not enough.  The dependability of the dividends, and the quality of the dividend paying company are key to overall performance.
​
Mitigating dividend concentration risk: quality yield, with low concentration
The first part of the solution is to focus on high quality dividend-paying companies.  One of the best indicators of dividend quality is a company’s dividend policy and track record.  A dependable dividend payer is one that has paid the same or increased dividend year in, year out, whatever the weather.
The second part of the solution is to consider concentration risk and make sure that companies’ weights are not skewed in an attempt to chase yield.
This is evident by contrasting the different index methodologies for these equity income indices.
The FTSE 100 does not explicitly consider yield (and is not designed to).  The FTSE UK Dividend+ index ranks companies by their dividend yield alone.  The S&P UK Dividend Aristocrats only includes companies that have consistently paid a dividend over several years, whilst ensuring there is no over-dependency on a handful of stocks.
A look at the top five holdings of each index shows the results of these respective methodologies.
​
Fig.3. Top 5 holdings of selected UK equity indices
Picture
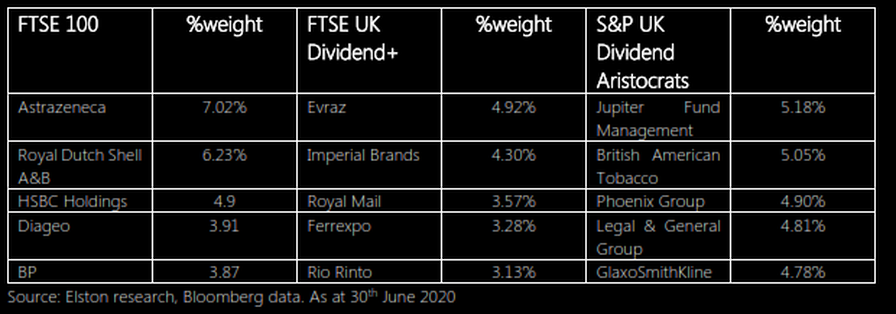
Put simply, the screening methodology adopted will materially impact the stocks selected for inclusion in an equity income index strategy.
​
What about active managers?
A study by Interactive Investor looked at the top five most commonly held stocks in UK Equity Income funds and investment trusts.
For funds, the most popular holdings were GlaxoSmithKline, Imperial Brands, BP, Phoenix Group & AstraZeneca.
For investment trusts, the most popular holdings are British American Tobacco, GlaxoSmithKline, RELX, AstraZeneca and Royal Dutch Sell.
Unsurprisingly, each of the holdings above is also a constituent of the S&P Dividend Aristocrats index, hence ETFs that track this index simply provide a lower cost way of accessing the same type of company (dependable dividend payers with steady or increasing dividends), but using a systematic approach that enables a lower management fee.
Understanding what makes dividend income dependable for an asset class such as UK equities, is only part of the picture of mitigating income risk.  Income diversification is enabled by adopting a multi-asset approach.
 
The advantage of a multi-asset approach
The advantage of a multi-asset approach is two-fold.
Firstly the ability to diversify equity income by geography for a more globalised approach, to benefit from economic and demographic trends outside the UK.
Secondly the ability to diversify income by asset class, to moderate the level of overall portfolio risk.
For investors who never need to dip into capital, have a very high capacity for loss, and can comfortably suffer the slings and arrows of the equity market, equity income works well – so long as the quality of dividends is addressed, as above.
But for anyone else, where there is a need for income, but a preference for a more balanced asset allocation, a multi-asset income approach may make more sense.  The rationale for a multi-asset approach is therefore to capture as much income as possible without taking as much risk as an all-equity approach.

Value at Risk vs Income Reward
There is always a relationship between risk and reward.  For income investors, it’s no different.  To be rewarded with more income, you need to take more risk with your capital.  This means including equities over bonds, and, within the bonds universe, considering both credit quality (the additional yield from corporate and high yield bonds over gilts), and investment term (typically, the longer the term, the greater the yield).
This overall level f risk being taken can be measured using a Value at Risk metric (a “worst case” measure of downside risk).
If you want something with very low value-at-risk, shorter duration gilts can provide that capital protection, but yields are very low.
Even nominally “safe” gilts, with low yields, nonetheless have potential downside risk owing to their interest rate sensitivity (“duration”).
UK Equities offer a high yield, but commensurately also carry a much higher downside risk.
The relationship between yield and Value-at-Risk (a measure of potential downside risk) is presented below.
​
Fig.4. Income Yield vs Value at Risk of selected asset classes/indices
Picture
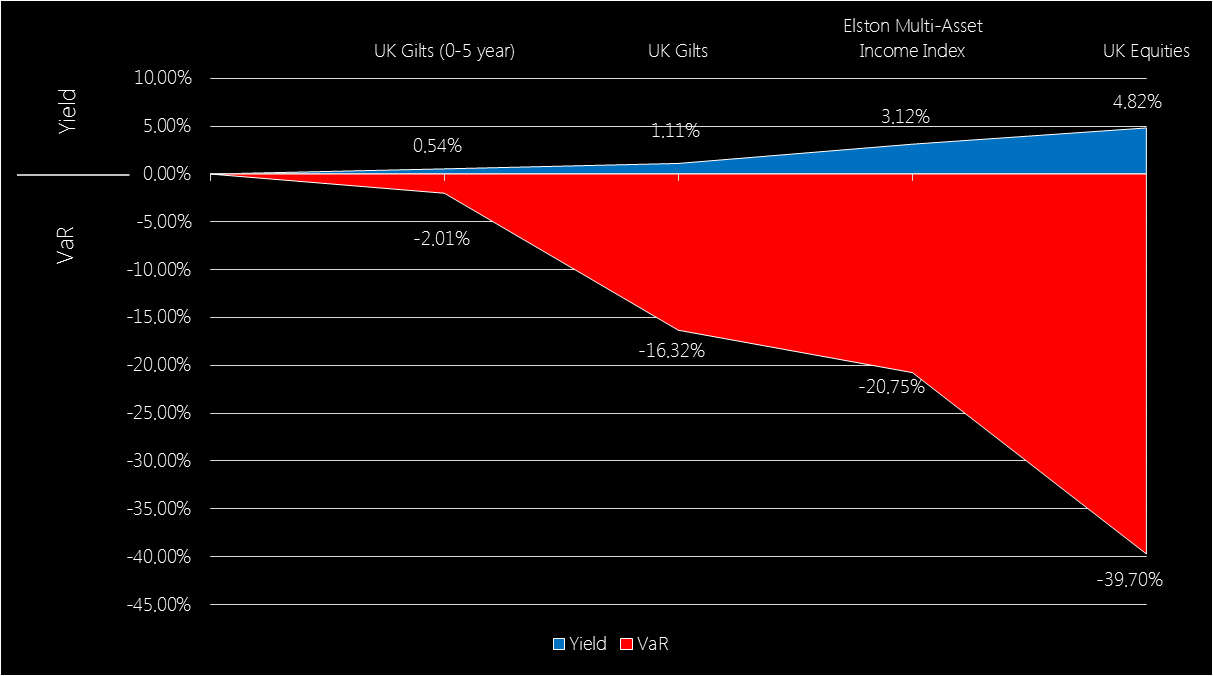
Source: Elston research, Bloomberg data, as at 30th June 2020.  Note: an investment with a Value at Risk (“VaR”) of -10% (1 year, 95% Confidence) means there is, to 95% confidence (a 1 in 20 chance), a risk of losing 10% of the value of your investment over any given year.  Asset class data reflects representative ETFs.

Our Multi-Asset Income index has, unsurprisingly, a risk level between that of gilts and equities, and captures approximately 65% of the yield, but with only 52% of the Value-at-Risk.
​
Summary
How you get your income – whether from equities, bonds or a mix – is critical to the amount of risk an investor is willing and able to take, and is a function of asset allocation.  Understanding the asset allocation of an income funds is key to understanding its risks (for example, Volatility, Value at Risk and Max Drawdown).

The dependability of dividend income you receive - whether from value traps or quality companies; whether concentrated or diversified – is a function of security selection.  This can be either manager-based (subjective), or index-based (objective).

For investors requiring a dependable yield, a closer look at how income is generated – through asset allocation and dividend dependability – is key.

    ELSTON RESEARCH

    insights inform solutions

    Get our weekly newsletter

    Categories

    All
    All Weather Portfolio
    Alternative Assets
    Alternative Strategies
    Bonds
    Business Practice
    Capital Market Assumptions
    CPD
    Digital Assets
    Direct Gilts
    Equities
    Equity Income
    Equity Sectors
    ESG
    ETFs
    Evidence Based Investing
    Factor Investing
    Geopolitics
    Gold & Precious Metals
    Guide To Investing
    Index Investing
    Inflation
    Investment Trusts
    Macro
    MULTI ASSET
    Multi Asset Income
    Net Zero
    Outlook
    Permanent Portfolio
    Podcast
    Portfolio Construction
    Private Markets
    Real Assets
    Retirement Investing
    Risk Parity
    Smoothed Portfolios
    Thematic Investing
    Value Factor
    Video
    Webinar

    Archives

    January 2026
    December 2025
    November 2025
    October 2025
    September 2025
    August 2025
    July 2025
    June 2025
    May 2025
    April 2025
    March 2025
    February 2025
    January 2025
    December 2024
    November 2024
    October 2024
    September 2024
    August 2024
    July 2024
    June 2024
    May 2024
    April 2024
    March 2024
    February 2024
    January 2024
    December 2023
    November 2023
    October 2023
    September 2023
    August 2023
    July 2023
    June 2023
    May 2023
    April 2023
    March 2023
    February 2023
    January 2023
    December 2022
    November 2022
    October 2022
    September 2022
    August 2022
    July 2022
    June 2022
    May 2022
    April 2022
    March 2022
    February 2022
    January 2022
    December 2021
    November 2021
    October 2021
    September 2021
    August 2021
    July 2021
    June 2021
    May 2021
    April 2021
    March 2021
    February 2021
    January 2021
    December 2020
    November 2020
    October 2020
    September 2020
    August 2020
    July 2020
    June 2020
    May 2020
    April 2020
    March 2020
    February 2020
    January 2020
    December 2019
    November 2019
    September 2019
    June 2019
    April 2019
    March 2019
    February 2019
    January 2019
    December 2018
    November 2018
    October 2018
    September 2018
    August 2018
    July 2018
    June 2018
    May 2018
    April 2018
    March 2018
    February 2018
    January 2018
    December 2017
    November 2017
    October 2017
    July 2017
    May 2017
    March 2017
    February 2017
    January 2017
    November 2016
    October 2016
    September 2016
    July 2016
    June 2016
    May 2016
    February 2016
    January 2016
    August 2015
    June 2015
    January 2014
    September 2013
    June 2012

    RSS Feed

Company
Home
About
​Our Journey
​​​Contact
Terms of Use
​Our Solutions
​​Insights
​Our Portfolios
Custom Portfolios
​Retirement Portfolios
Our CGT Solutions
Our Funds
Custom Funds
Our Indices
Custom Indices
​Adviser Support
CIRP
Investment Committee Support
Regulatory Support
Analytics, Factsheets & Reporting
CPD


By client type:
For Advisers
For Discretionary Managers


© COPYRIGHT 2012-25. ALL RIGHTS RESERVED.
 Elston Consulting Limited (Company Registration Number 07125478) is registered in
England & Wales, Registered address:  1 King William Street, London EC4N 7AF
  • WHO WE ARE
    • About
    • Our Journey
    • What Our Clients Say
  • WHAT WE DO
    • Elston Portfolios >
      • Our Portfolios
      • Adaptive Portfolios
      • Retirement Portfolios
      • Sustainable Portfolios
      • Smoothed Portfolios
      • All Weather Portfolio UK
      • Money Market Portfolio
    • Custom Portfolios >
      • Custom Portfolios
    • MINERVA
    • CGT Solutions >
      • Our CGT Solutions
      • Avastra Portfolios
      • Onshore Bonds
      • Direct Gilts
    • Adviser Support >
      • Our Adviser Support
      • CIRP
      • Investment Committee Support
      • Regulatory Support
      • Analytics, Factsheets & Reporting
      • CPD
    • Fund Solutions >
      • Our Funds
      • Custom Funds
    • Index Solutions >
      • Our Indices
      • UK Equity Income
      • Sector Equal Weight
      • Factor Equal Weight
      • Liquid Real Assets
      • Gold and Precious Metals
      • Permanent Portfolio UK
      • UK Multi-Asset Indices
      • Custom Indices
  • Insights
  • Subscribe
  • Contact