

 Mainstream platforms have been slow to adopt fractional trading. This has hampered the adoption of ETFs within MPS. With many more index funds available, it's become less of an issue, according to Henry Cobbe, Head of Research at Elston Consulting.
Read the full article in ETF Stream  [5 min read, open as pdf]
 Central Banks' policy rates are expected to pivot towards cuts in 2024 with a material impact on asset class perspectives.
Read the full article in FT Adviser Elston Consulting fund selector Jackie Qiao discusses how she sees active funds evolving over the next decade.
Read in full  [3 min read, open as pdf]
 [5 min read, open as pdf]
 [5 min read, open as pdf]
 [5min read, open as pdf]
 [5 min read, open as pdf]
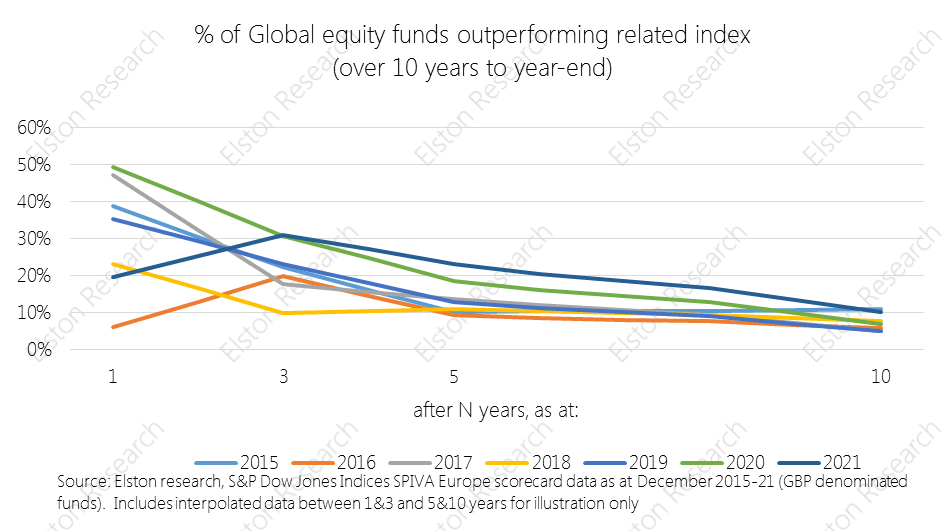
CPD Webinar: Is Active Management a Zero-Sum Game?  [5 min read, open as pdf]
 [3 min read, open as pdf]
 [5 min read, open as pdf for full article]
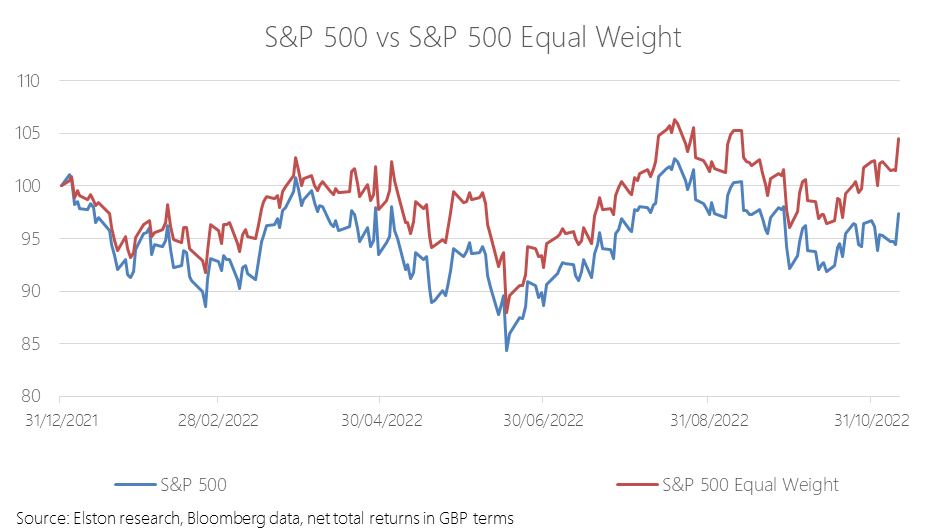
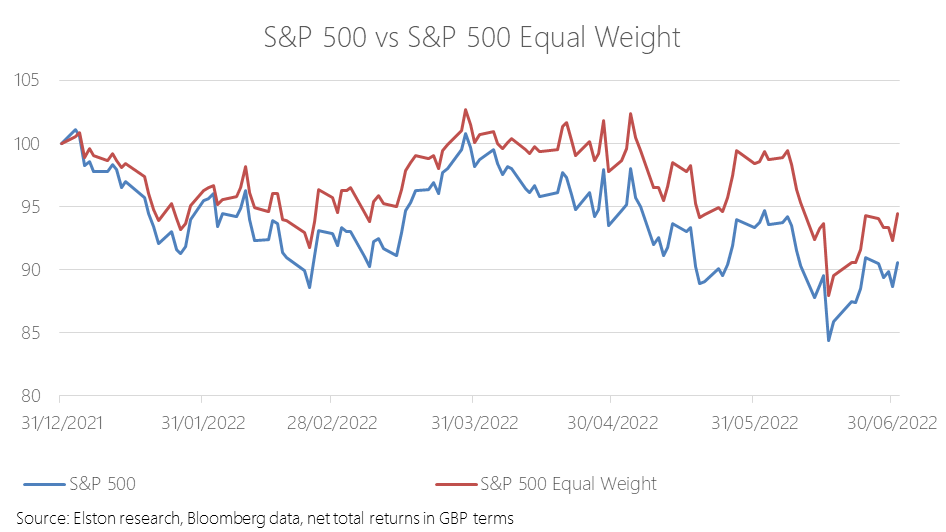
Critics of tracker funds often flagged concentration risk or the “big get bigger” approach of passive investing as a structural flaw to index investing. But concentration risk is a choice, not an obligation for the index investor. As would be expected, an equal weight approach has proved relatively more defensive in the down-market year-to-date. The S&P500 Equal Weight index has returned -5.2% against the traditional S&P 500’s -9.3% YTD, in GBP terms. For more on this topic, please see our CISI-endorsed CPD webinar: The curious power of equal weight, with guest speaker Tim Edwards, Managing Director, Index Investment Strategy, S&P Dow Jones Indices The costs of investing compound and have a negative impact on your ultimate return. Henry Cobbe is interviewed by Investor's Chronicle.
Read in full 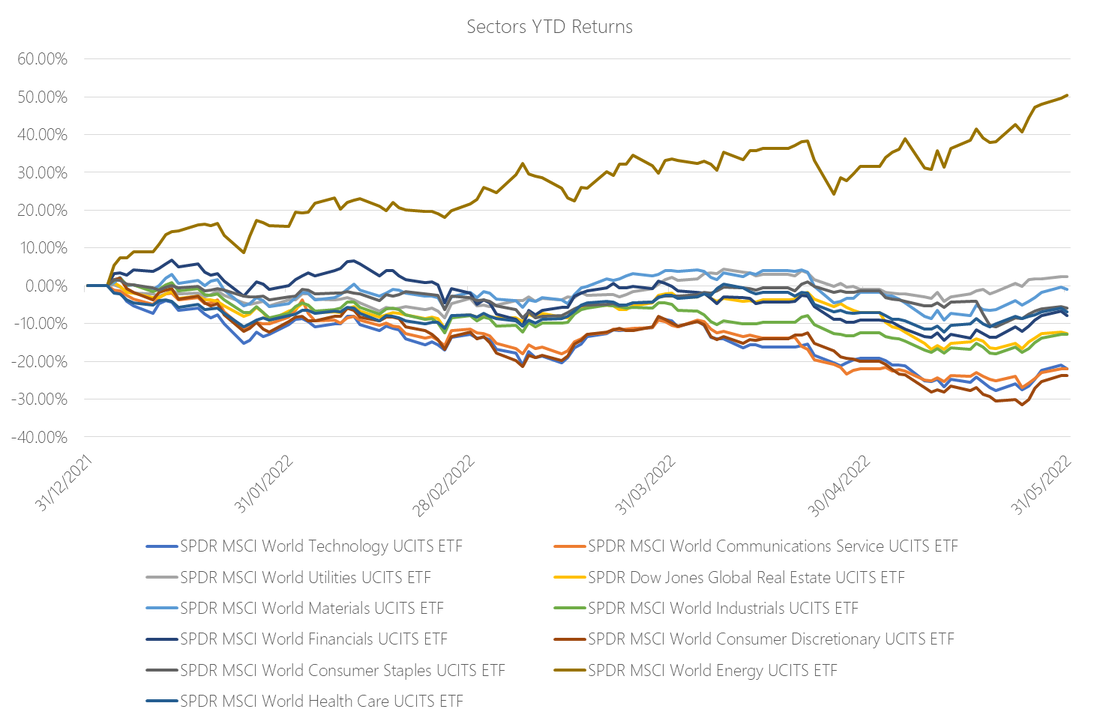 [5 min read, open as pdf]
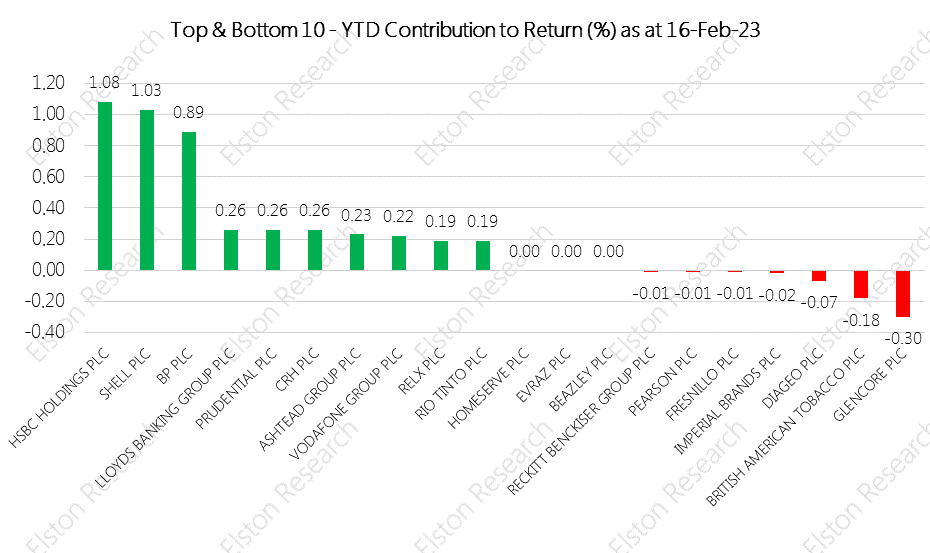
The uncertainty of the current market environment is prompting a pivot away from sectors that have served investors well, in many cases since the financial crisis but particularly during the Covid-19 pandemic. With inflation rampant, commodity prices spiralling, supply chains choked and the much relied-on ‘Fed Put’ (whereby central banks rescue markets by flooding them with liquidity) a thing of the past, investors are rotating away from Technology and Real Estate and into traditionally “boring”, but dependable sectors like Industrials, Materials and Energy. For full article, see pdf 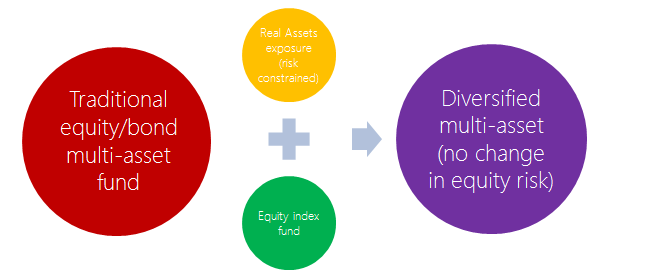 [5 min read, full article in pdf]
In theory, through 2021 we have argued that bonds would remain under pressure against the twin pressures of rising interest rates and rising inflation. In practice, market dislocations of 1q22 evidenced this as bonds provide no place to hide in a time of market stress, and lost both their diversification and their protection characteristics. Indeed, the losses sustained on the bond side of a traditional multi-asset equity/bond portfolio were more extreme than the losses sustained on the equity side. The pressure on bonds will continue so long as we are in an inflationary regime. And that may be for the medium-term (e.g. 5 or more years based on market implied inflation rates). This is forcing a rethink for advisers reliant on equity/bond multi-asset funds to deliver a core investment strategy for their clients. [Read full article in pdf] Find out more about our Liquid Real Assets index strategy 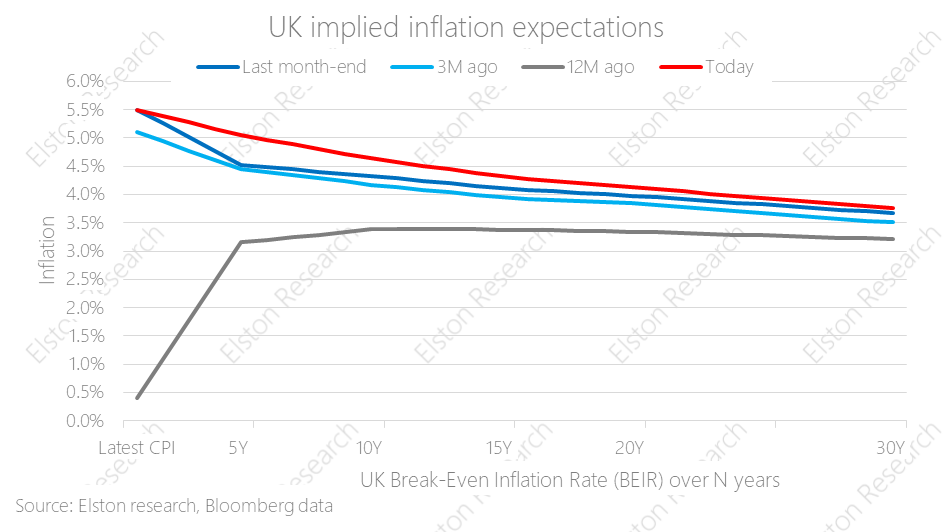 [5 min read, open as pdf]
Nominal bonds suffer in an inflationary regime. Real assets provide resilience in an inflationary regime, but have higher volatility. Our Liquid Real Assets index combines rate-sensitive assets and inflation-sensitive assets to capture real asset return patterns, with bond-like volatility. Underlying exposures to Gold, Energy, Precious Metals, Agriculture and Industrial Metals have all driven performance of the index year-to-date. The Liquid Real Assets index has outperformed gilts by 8.91ppt with similar risk characteristics. Portfolio managers and advisers who are looking to 1) reduce or remove nominal bond exposure, 2) want real asset exposure for inflation protection, and 3) want to maintain volatility budget can consider a lower-risk real assets strategy as an alternative. For full article with charts, open as pdf 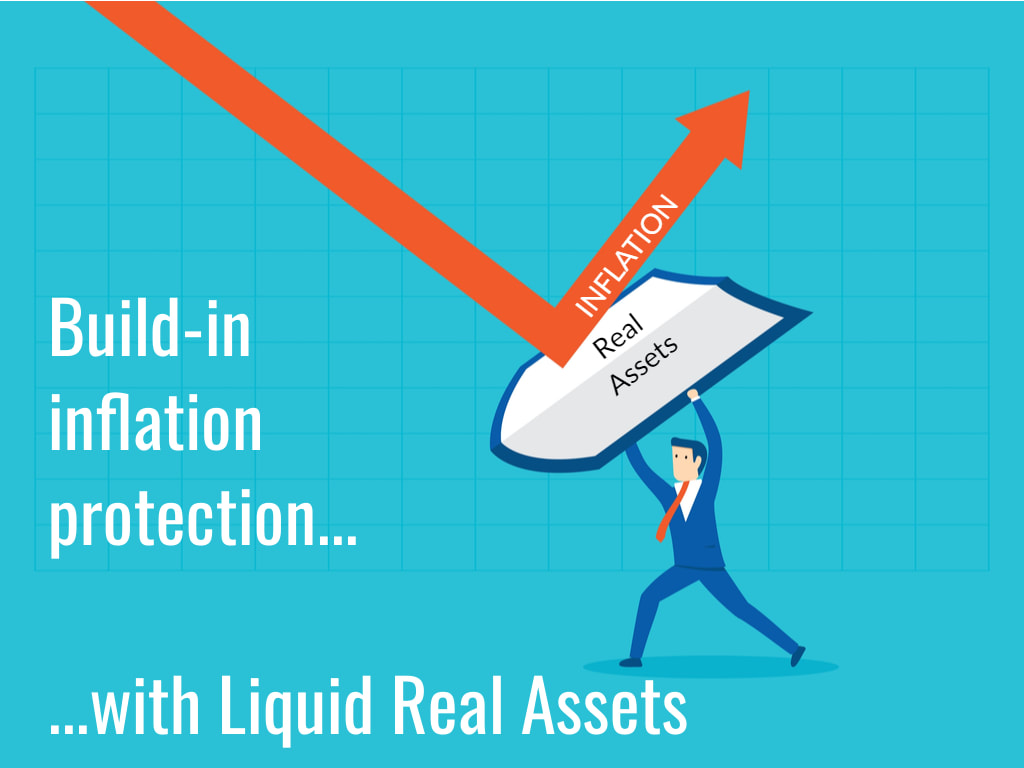 [5 min read, open as pdf]
Even before the Russia/Ukraine war and sanctions, Covid policy stimulus, rapidity of the post-Covid restart, supply-chain disruptions and the energy crisis have stoked up inflationary pressure and we are in for a bumpy ride. While we are not yet past the peak, it takes years, not months, to tame inflation, so it makes sense to adapt portfolios for an inflationary regime. To understand asset class behaviour there is not much use looking at the last 10 or 20 years. That era has been characterised by falling interest rates and low inflation. Instead we have to go back to the history books and understand how asset classes behaved in the 1970s inflation shock and the subsequent period of rising interest rates and rising inflation. From studying academic research on that era, we draw three key conclusions: firstly, inflation protection can be achieved by owning the assets that benefit, rather than suffer, from inflation. Secondly, that different asset classes have different inflation-protective qualities over time. Finally, that liquidity is key so that there is flexibility to alter and adjust your portfolio. Equities: the long-term inflation hedge Equities provide the ultimate “long-term” inflation hedge – companies that make things that you always need and have pricing power can keep pace with or beat inflation. Within equities, studies show that a bias towards value, away from growth, outperforms during an inflationary regime. This is because of something known as “equity duration”, which basically means that companies that deliver earnings and dividends on a “jam today” basis, are more valuable than companies that are expected to deliver earnings and dividends in the very distant future on a “jam tomorrow” basis. You can access a Value ETF very simply by using factor-based ETFs, such as IWFV (iShares Edge MSCI World Value Factor UCITS ETF). But given that investors are likely to have equities in their portfolios already and therefore have long-term protection in place, how do you achieve inflation-protection for the bumpy ride over the short- and medium-term? Owning the problem Inflation-hedging can be described as “owning the problem”. Worried about rising oil, gas and petrol prices? Own an Energy ETP like AIGE (WisdomTree Energy ETP). Worried about rising wheat prices? Own an Agriculture ETP like AIGA (WisdomTree Agriculture ETP). Worried about rising rail-fares? Own an infrastructure ETF like GIN (SPDR Morningstar Multi-Asset Global Infrastructure UCITS ETF). Worried about rising rents? Own a property ETF like IWDP (iShares Developed Markets Property Yield UCITS ETF). Worried about rising household bills? Own a Utilities ETF like UTIW (Lyxor MSCI World Utilities TR UCITS ETF). By owning the assets that benefit, rather than suffer, from inflation, you can incorporate inflation-protection into your portfolio. These assets are referred to as “liquid real assets” as their value is positively related to inflation. They can be accessed in liquid format by using exchange traded products (ETPs) keeping your portfolio flexible to enable future adjustments as time goes on. Interestingly, real assets respond to inflation in different ways over different time frames. The study from the 1970s looked at the correlation of asset classes over time from the start of an inflation shock. It found that Commodities provided near-term inflation protection for the initial five or so years of inflation shock, but then moderated as supply-side solutions came-through. Infrastructure and Property provided medium- to long-term inflation protection but were vulnerable in the near-term to rising market risk associated with the break-out of inflation. Inflation-linked bonds – as the name suggests – provide inflation protection, if held to maturity. But in the short-term they can decline materially, as they are highly sensitive to increases in interest rates which are typically associated with inflation-fighting central bank policy. So while inflation-linked bonds like INXG (iShares GBP Index-Linked Gilts UCITS ETF) reduce inflation risk, they increase interest rate risk. By introducing some interest-rate hedging by owning assets whose interest rates go up when the Fed raises rates, like with FLOS (iShares USD Floating Rate Bond UCITS ETF GBP Hedged), this can be mitigated. Gold Gold is also a traditional real asset inflation-hedge: it preserves its value (purchasing power) over millennia, and is a classic “risk off” asset that can help protect a portfolio in times of market stress. Some critics of holding physical gold argue that is produces no income and therefore has no intrinsic value or growth. That may be so, but imagine you were a time-traveller – it’s the only money that you could use in any era going back to biblical times. It holds its value in inflationary and even in hyperinflationary times. From a portfolio perspective, it always makes sense to have some exposure both as a real asset, a shock-absorber and as an uncorrelated diversifier. Physical gold tends to outperform gold miners, in the long-run, and can be accessed at lower cost. There are plenty of low-cost physical gold ETPs to choose from. Bringing it all together We believe that a layered approach to inflation-hedging makes sense because of the different inflation-protection qualities of different asset classes over time. Within equities this means pivoting equity exposure towards a Value/Income bias. Within bonds, this means reducing duration and/or substituting nominal bonds with liquid real assets exposure as a potential alternative (subject to relevant risk controls). We have incorporated a range of higher risk inflation-protective asset classes, such as commodities, gold, infrastructure and property, medium-risk like lower duration inflation-linked bonds and lower risk rate-sensitive assets, such as floating rate notes to create a diversified Liquid Real Assets Index strategy that aims to deliver exposure to inflation-protective asset classes, while delivering an overall portfolio volatility similar to Gilts. This makes the strategy a potential alternative to traditional (nominal) bonds exposure that will continue to struggle in an inflationary regime. Summary For those wishing to isolate and target specific inflation-protective exposures, there is no shortage of choice for highly targeted inflation-hedging strategies. Adapting portfolios for inflation is key to ensure resilience in an inflationary regime. And while it may feel a bit late to get started, it’s better late than never. Find out more about our All-Weather Portfolio of ETFs for UK investors. Find out more about our Permanent Portfolio of ETFs for UK investors. See all our Research Portfolios  [5 min read, open as pdf]
Find out more on this topic in our upcoing CPD webinar
For investors with long time horizons who want an all-equity portfolio, there is no shortage of low- cost global equity ETFs. In cricketing terms, when sunshine’s guaranteed, a grass pitch works just fine. But when time horizons are shorter and risk control matters more – as in these uncertain times - a multi-asset approach might make better sense. Put differently, when the weather is changeable or extreme, an all-weather pitch makes more sense. It’s the same for investments. In these times of market volatility, rising interest rates and inflation pressure, we explore three different types of multi-asset strategy: the 60/40 portfolio, the “Equal Risk” or all-weather portfolio, and the “Equal Weight” or Permanent Portfolio. The problem with 60/40 The traditional multi-asset portfolio is the so-called “60/40” portfolio – where 60% is invested in equities, and 40% is invested in bonds. This is the “classic” multi-asset strategy. The idea being that you can combine higher risk and return from equities with lower risk income from bonds. A 60/40 portfolio can be constructed with just two ETFs. 60% in a global equity ETF like SSAC (iShares MSCI ACWI UCITS ETF) or VWRP (Vanguard FTSE All-World UCITS ETF); and 40% in a bond ETF – for example AGBP (iShares Core Global Aggregate Bond UCITS ETF GBP hedged) for those wanting global bond (hedged to GBP) exposure, or IGLT (iShares Core UK Gilts UCITS ETF) for those wanting UK government bond exposure. Or you can make it more and more granular. But this traditional 60/40 model is under pressure, and the suggestion currently is that the 60/40 portfolio is now “dead”. Why is this? Well because for the last 30 years or so, we’ve lived in a world where inflation and interest rates have been trending down – which is doubly good for bonds. But now we are now in an economic regime where both interest rates and inflation are starting to trend up – which is doubly bad for bonds. The other problem with 60/40, is that in times of market stress, the correlation between equities and bonds increases, meaning that bonds lack the diversifying power they may have had in the historical long-run, at a time when it is needed most. In summary: the advantage of this approach a 60/40 portfolio is easy to construct, and is a classic “balanced” portfolio. The disadvantage of this approach is that bonds are facing an uphill struggle for the next few years, so may not be as “balanced” as you would want. The all-weather portfolio The all-weather portfolio concept is that of a multi-asset portfolio that is designed to deliver resilient, consistent performance in different market regimes, or “whatever the weather”. The term and idea was pioneered by Ray Dalio of Bridgewater Associates (which was established in 1974, shortly after Nixon took the US Dollar off the gold standard) and is designed to answer the question: “What kind of investment portfolio would you hold that would perform well across all environments, be it a devaluation or something completely different?”[1]. Dalio and Bridgewater’s all-weather portfolio assumes equal odds of any of four market regimes (rising/falling growth/inflation) prevailing at any time. This approach created and pioneered what is also referred to as a “Risk Parity” approach to investing. The concept of risk parity requires some additional explanation. A classic 60/40 equity/bond allocation results in a portfolio where over 95% of overall portfolio risk comes from the equity position, and the balance comes from the bond position. In short, the asset allocation drives portfolio risk, and while a portfolio may be balanced in terms of asset allocation, it is imbalanced in terms of risk allocation. Risk parity reverses the maths: it means that each asset class contributes equally to the overall risk of a portfolio. This is why it is also known as an “Equal Risk” approach. But as risk is dynamic, not stable, the asset weights must adapt to keep the risk allocation stable. UK investors can build their own all-weather portfolio using four to six ETFs representing broad asset classes: global equities, UK equities, gilts, property, gold and cash equivalent, depending on complexity. In order to keep the risk allocation stable, the asset weights might need to change each month to reflect the changing risk and correlation relationships of and between those asset classes. In summary: the advantage of this Equal Risk approach is that a portfolio is truly diversified from a risk contribution perspective. The disadvantage of this approach is it requires a regular change of weights to reflect changing short-term volatilities and correlations. The Permanent Portfolio The permanent portfolio is a concept pioneered by the late Harry Browne, a US financial adviser, in his 1999 book “Fail-Safe Investing”. It has many adherents in both the US and the UK, but to date it is only really in the US that one can find ‘Permanent Portfolios’ on offer, something UK investors seem keen to change. The concept is similar to the all-weather portfolio, but in a more straightforward format. Rather than trying to target an “Equal Risk” contribution with changing asset-class weights, the Permanent Portfolio is a simple Equal Weight approach to four main asset classes to reflect different market regimes, so that whatever the regime, the portfolio has got it covered. Browne outlines four market regimes[2], and related asset exposure for that regime:
US versions of this strategy use US equities for the equity exposure and US treasuries for the bond exposure. So what would a UK version look like? We constructed a Permanent Portfolio for UK investors using 4 London listed ETFs: SSAC for global equities, IGLT for UK bonds, SGLN (iShares Physical Gold ETC) for gold and ERNS (iShares GBP Ultrashort Bond UCITS ETF) for cash equivalents for some additional yield over cash that will capture rising interest rates. In summary: the advantage of this Equal Weight approach is its simplicity and low-level of maintenance required. The disadvantage of this approach is that it disregards short-run changes in volatility and correlation that are captured in the Equal Risk approach. How do they all compare? Obviously the strategies vary from each other. To evaluate performance, we have created research portfolios for both these strategies. What becomes apparent is that the outperformance of these low-cost, equal-risk and equal-weight all-weather and permanent portfolios looks relatively attractive when set against many more complex (and expensive) “all-weather” absolute return funds. Find out more about our All-Weather Portfolio of ETFs for UK investors. Find out more about our Permanent Portfolio of ETFs for UK investors. See all our Research Portfolios Attend our CPD webinar on this topic [1] https://www.bridgewater.com/research-and-insights/the-all-weather-story [2] Harry Browne, Fail-Safe Investing, (1999) Rule #11 Build a bullet-proof portfolio for protection (pp.38-49) |
ELSTON RESEARCHinsights inform solutions Categories
All
Archives
July 2024
|
 RSS Feed
Company |
Solutions |
|