
 The purpose of including alternatives in a portfolio, is for one reason: diversification. But how can we be sure alternatives are doing their job?
Read the full article in FT Adviser or watch the CISI-endorsed CPD webinar  Central Banks' policy rates are expected to pivot towards cuts in 2024 with a material impact on asset class perspectives.
Read the full article in FT Adviser  [5 min read]
1. Yield is back: for equities, bonds and alternatives - the yield drought is over 2. Selectivity matters more: within and across asset classes 3. Inflation is getting stickier: getting past the peak, but still a problem Read the summary article Find out more:
 [3 min read, open as pdf]
 [5 min read, open as pdf]
With low growth, soaring inflation and spiking interest rates, advisers need to rethink the definition of risk. Focus on volatility is focus on the “wrong problem”. Instead, advisers should focus on preserving purchasing power (mitigate inflation risk) to protect client outcomes. That requires a fundamental rethink around traditional definitions of risk, asset allocation and diversification. For full article including charts, open as pdf With inflation at current levels, nominal bonds will remain under pressure. We explore the more resilient alternatives within the bonds universe as well as property, infrastructure, liquid real assets and targeted absolute return funds.
For full article, see Trustnet.  [5 min read, open as pdf]
Read full article with charts 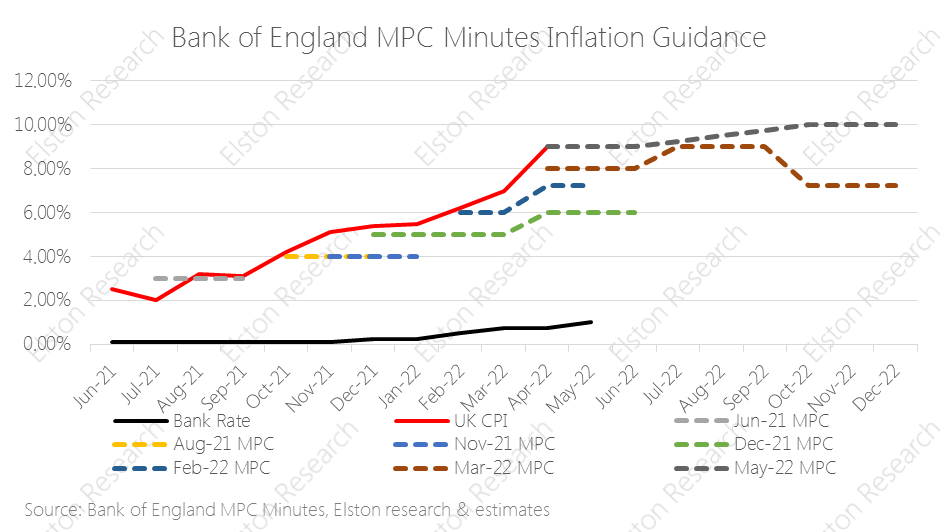 [5 min read, open as pdf]
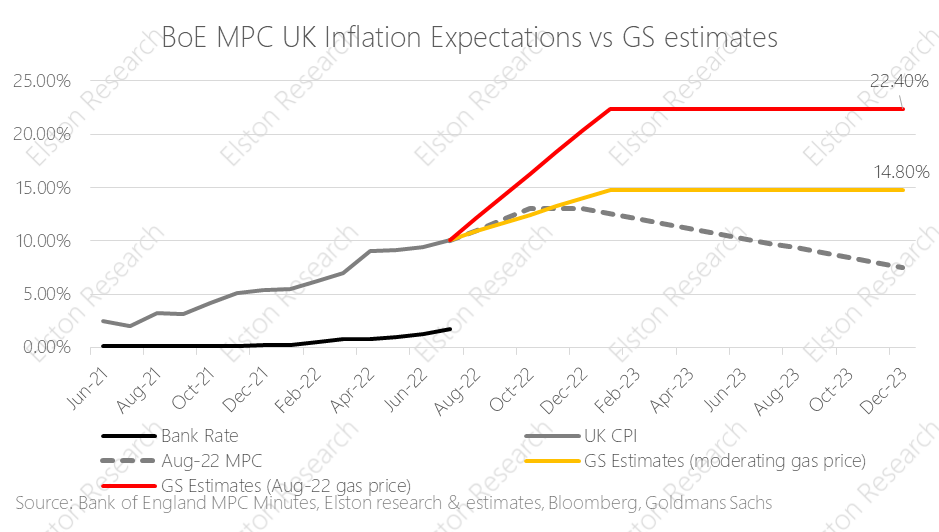
Inflation hits 40 year high UK inflation figures came out today with a print of +9.0%yy (April), from +7.0% (March) and slightly below +9.1%yy consensus estimate. This is the highest level in 40 years, putting renewed focus on the “cost of living crisis”. Rising energy and food costs are the primary drivers, linked to the sanctions regime and the Russia/Ukraine war. The Bank of England has been “behind the curve” as regards to inflation risk. A look at inflation guidance contained in recent Monetary Policy Committee (MPC) minutes shows. Near-term inflation guidance has consistently under-estimated inflation since August 2021 – rising from “above 2%”, to 4%, 6%, 8%,, 9% and now 10%. Read full article with charts 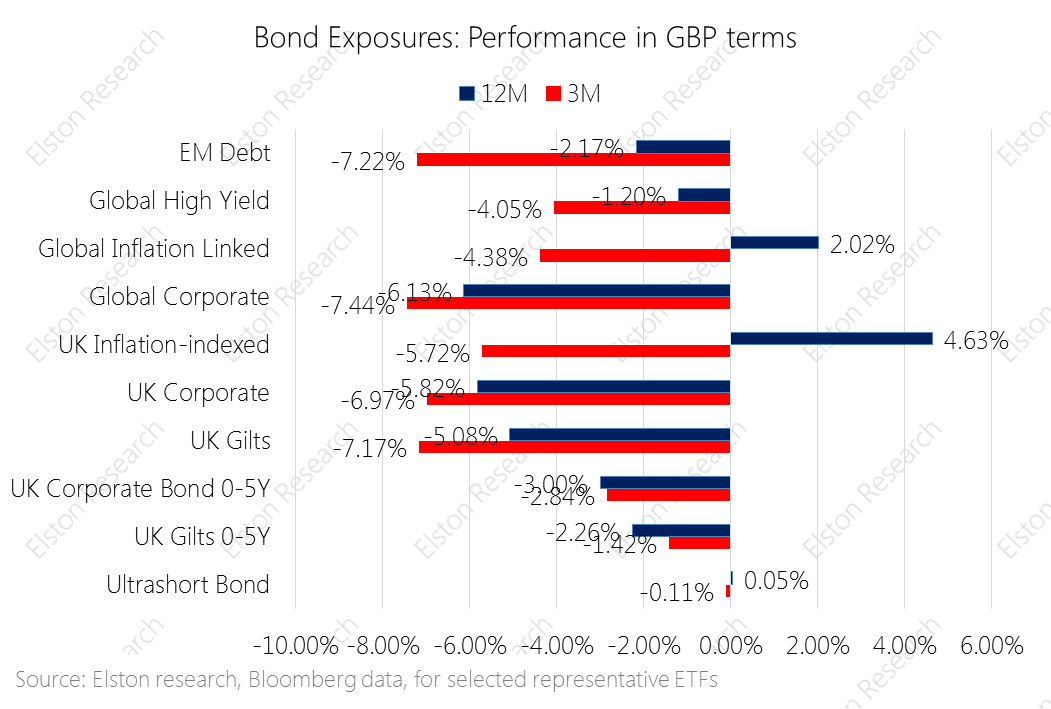 [5 min read, open as pdf for full article]
Equity markets endured a triple shock in the first quarter of 2022: a dramatic steepening of the likely path of interests, multi-year high inflation levels and a horrific war unleased in Ukraine. The traditional rational for including nominal bonds was to provide steady income, lower but positive returns, and diversification – a place of safety in periods of market stress. In face of rising inflation and rising interest rates, nominal bonds are providing none of these portfolio functions. Indeed in 1q22 not a single bond exposure delivered positive returns, and over 12 months only inflation-linked exposures delivered positive returns. Open as pdf for full article CPD Webinar Alternatives to Bonds in a Portfolio  [5 min read, open as pdf]
In a recent CPD webinar, Elston’s Henry Cobbe interviewed Patrick Minford, Professor of Applied Economics at Cardiff University and economic adviser to Margaret Thatcher in the late 1970s and early 1980s to ask about the fight with inflation in the 1970s and any comparisons for today. While it is tempting to look for similarities with the energy shock and period of sustained inflation that the UK suffered in the late 1970s and early 1980s, Professor Minford highlighted some significant differences. The lower risk of a wage-price spiral, central bank independence and a track record of manging inflation means lower risk of inflation getting out of control in the long-term. But the short- to medium-term remains under pressure. In Minford’s opinion, the risk to the growth is the bigger risk: and this would be the right time for HM Treasury to worry less about debt ratios, and turn on Government spending taps. Read full article, open as pdf Watch the CPD webinar (50mins)  [5 min read, open as pdf]
Rising inflation and rising interest rates, means nominal bonds (such as corporate bonds, UK gilts, and global government bonds) are under pressure, and will remain so for the medium-term. For so long as real yields remain negative, bonds are “guaranteed” to lose capital value in real terms over time. So what are the Alternatives to Bonds in a portfolio for UK investors? We explore the options within this article open as pdf or full version  [5 min read, open as pdf]
Find out more on this topic in our upcoing CPD webinar
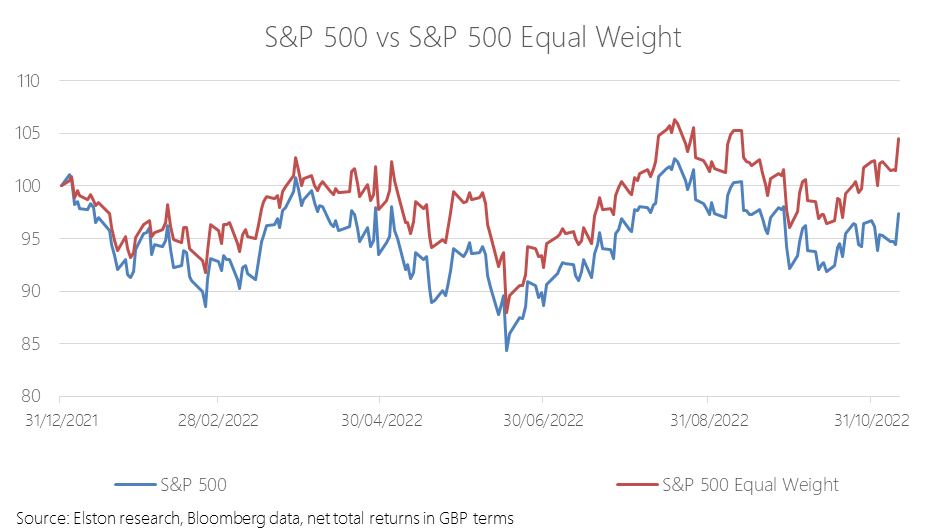
For investors with long time horizons who want an all-equity portfolio, there is no shortage of low- cost global equity ETFs. In cricketing terms, when sunshine’s guaranteed, a grass pitch works just fine. But when time horizons are shorter and risk control matters more – as in these uncertain times - a multi-asset approach might make better sense. Put differently, when the weather is changeable or extreme, an all-weather pitch makes more sense. It’s the same for investments. In these times of market volatility, rising interest rates and inflation pressure, we explore three different types of multi-asset strategy: the 60/40 portfolio, the “Equal Risk” or all-weather portfolio, and the “Equal Weight” or Permanent Portfolio. The problem with 60/40 The traditional multi-asset portfolio is the so-called “60/40” portfolio – where 60% is invested in equities, and 40% is invested in bonds. This is the “classic” multi-asset strategy. The idea being that you can combine higher risk and return from equities with lower risk income from bonds. A 60/40 portfolio can be constructed with just two ETFs. 60% in a global equity ETF like SSAC (iShares MSCI ACWI UCITS ETF) or VWRP (Vanguard FTSE All-World UCITS ETF); and 40% in a bond ETF – for example AGBP (iShares Core Global Aggregate Bond UCITS ETF GBP hedged) for those wanting global bond (hedged to GBP) exposure, or IGLT (iShares Core UK Gilts UCITS ETF) for those wanting UK government bond exposure. Or you can make it more and more granular. But this traditional 60/40 model is under pressure, and the suggestion currently is that the 60/40 portfolio is now “dead”. Why is this? Well because for the last 30 years or so, we’ve lived in a world where inflation and interest rates have been trending down – which is doubly good for bonds. But now we are now in an economic regime where both interest rates and inflation are starting to trend up – which is doubly bad for bonds. The other problem with 60/40, is that in times of market stress, the correlation between equities and bonds increases, meaning that bonds lack the diversifying power they may have had in the historical long-run, at a time when it is needed most. In summary: the advantage of this approach a 60/40 portfolio is easy to construct, and is a classic “balanced” portfolio. The disadvantage of this approach is that bonds are facing an uphill struggle for the next few years, so may not be as “balanced” as you would want. The all-weather portfolio The all-weather portfolio concept is that of a multi-asset portfolio that is designed to deliver resilient, consistent performance in different market regimes, or “whatever the weather”. The term and idea was pioneered by Ray Dalio of Bridgewater Associates (which was established in 1974, shortly after Nixon took the US Dollar off the gold standard) and is designed to answer the question: “What kind of investment portfolio would you hold that would perform well across all environments, be it a devaluation or something completely different?”[1]. Dalio and Bridgewater’s all-weather portfolio assumes equal odds of any of four market regimes (rising/falling growth/inflation) prevailing at any time. This approach created and pioneered what is also referred to as a “Risk Parity” approach to investing. The concept of risk parity requires some additional explanation. A classic 60/40 equity/bond allocation results in a portfolio where over 95% of overall portfolio risk comes from the equity position, and the balance comes from the bond position. In short, the asset allocation drives portfolio risk, and while a portfolio may be balanced in terms of asset allocation, it is imbalanced in terms of risk allocation. Risk parity reverses the maths: it means that each asset class contributes equally to the overall risk of a portfolio. This is why it is also known as an “Equal Risk” approach. But as risk is dynamic, not stable, the asset weights must adapt to keep the risk allocation stable. UK investors can build their own all-weather portfolio using four to six ETFs representing broad asset classes: global equities, UK equities, gilts, property, gold and cash equivalent, depending on complexity. In order to keep the risk allocation stable, the asset weights might need to change each month to reflect the changing risk and correlation relationships of and between those asset classes. In summary: the advantage of this Equal Risk approach is that a portfolio is truly diversified from a risk contribution perspective. The disadvantage of this approach is it requires a regular change of weights to reflect changing short-term volatilities and correlations. The Permanent Portfolio The permanent portfolio is a concept pioneered by the late Harry Browne, a US financial adviser, in his 1999 book “Fail-Safe Investing”. It has many adherents in both the US and the UK, but to date it is only really in the US that one can find ‘Permanent Portfolios’ on offer, something UK investors seem keen to change. The concept is similar to the all-weather portfolio, but in a more straightforward format. Rather than trying to target an “Equal Risk” contribution with changing asset-class weights, the Permanent Portfolio is a simple Equal Weight approach to four main asset classes to reflect different market regimes, so that whatever the regime, the portfolio has got it covered. Browne outlines four market regimes[2], and related asset exposure for that regime:
US versions of this strategy use US equities for the equity exposure and US treasuries for the bond exposure. So what would a UK version look like? We constructed a Permanent Portfolio for UK investors using 4 London listed ETFs: SSAC for global equities, IGLT for UK bonds, SGLN (iShares Physical Gold ETC) for gold and ERNS (iShares GBP Ultrashort Bond UCITS ETF) for cash equivalents for some additional yield over cash that will capture rising interest rates. In summary: the advantage of this Equal Weight approach is its simplicity and low-level of maintenance required. The disadvantage of this approach is that it disregards short-run changes in volatility and correlation that are captured in the Equal Risk approach. How do they all compare? Obviously the strategies vary from each other. To evaluate performance, we have created research portfolios for both these strategies. What becomes apparent is that the outperformance of these low-cost, equal-risk and equal-weight all-weather and permanent portfolios looks relatively attractive when set against many more complex (and expensive) “all-weather” absolute return funds. Find out more about our All-Weather Portfolio of ETFs for UK investors. Find out more about our Permanent Portfolio of ETFs for UK investors. See all our Research Portfolios Attend our CPD webinar on this topic [1] https://www.bridgewater.com/research-and-insights/the-all-weather-story [2] Harry Browne, Fail-Safe Investing, (1999) Rule #11 Build a bullet-proof portfolio for protection (pp.38-49)  [5 min read, open as pdf]
In our 2022 outlook, we explained why inflation will remain hotter for longer and will settle above pre-pandemic levels. Advisers should consider how to adapt portfolios for inflation across each asset class – equities, bonds and alternatives. Research demonstrates how different asset classes exhibit different degrees of inflation protection over different time-frames. Equities therefore provide a long-term inflation hedge.
In this article, we explore how to adapt portfolios for inflation within and across each asset class: Equities, Bonds and Alternatives. For full article, read as pdf  [3 min read, open as pdf]
2021 in review Our 2021 market roundup summarises another strong year for markets in almost all asset classes except for Bonds which remain under pressure as interest rates are expected to rise and inflation ticks up. Listed private equity (shares in private equity managers) performed best at +43.08%yy in GBP terms. US was the best performing region at +30.06%. Real asset exposures, such as Water, Commodities and Timber continued to rally in face of rising inflation risk, returning +32.81%, +28.22% and +17.66% respectively. 2022 outlook We are continuing in this “curiouser, through-the-looking glass” world. Traditionally you bought bonds for income, and equity for risk. Now it’s the other way round. Only equities provide income yields that have the potential to keep ahead of inflation. Bonds carry increasing risk of loss in real terms as inflation and interest rates rise. Real yields, which are bond yields less the inflation rate, are negative making traditional Bonds which aren’t linked to inflation highly unattractive. Bonds that are linked to inflation are highly sensitive to rising interest rates (called duration risk), so are not attractive either. How to navigate markets in this context? The big three themes for the year ahead are, in our view:
See full report in pdf Attend our 2022 Outlook webinar  [ 5 min read, open as pdf]
Since an article published in 2019 pointed the historic lows in bond yields, many investment firms are starting to rethink the 60/40 portfolio. This came under even more scrutiny following the market turmoil of 2020. While some affirm that the 60/40 will outlive us all, others argue against this notion. We take a look at the main arguments for and against and key insights What is a 60/40 portfolio? A 60/40 equity/bond portfolio is a heuristic “rule of thumb” approach considered to be a proxy for the optimal allocation between equities and bonds. Conventionally equities were for growth and bonds were for ballast. The composition of a 60/40 portfolio might vary depending on the base currency and opportunity set of the investor/manager. Defining terms is therefore key. We summarise a range of potential definitions of terms: 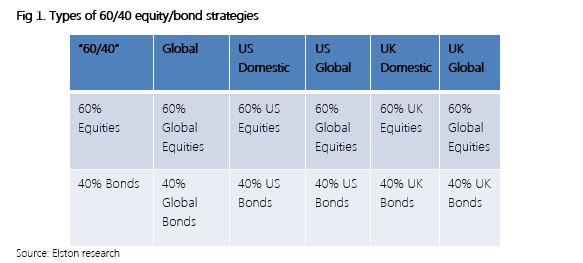 Furthermore, whilst 60/40 seems simple in terms of asset weighting scheme, it is important to understand the inherent risk characteristics that this simple allocation creates. For example, a UK Global 60/40 portfolio has 62% beta to Global Equities; equities contribute approximately 84% of total risk, and a 60/40 portfolio is approximately 98% correlated to Global Equities[1]. [1] Elston research, Bloomberg data. Risk Contribution based on Elston 60/40 GBP Index weighted average contribution to summed 1 Year Value At Risk 95% Confidence as at Dec-20. Beta Correlation to Global Equities based on 5 year correlation of Elston 60/40 GBP Index to global equity index as at Dec-20. 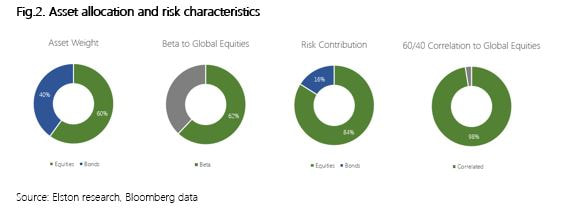 Why some think 60/40 will outlive us all. The relevance of 60/40 portfolio lies in its established historic, mathematical and academic backup. Whilst past performances do not guarantee future returns, it nonetheless provides us with experience and guidance. (Martin,2019) Research also suggests that straightforward heuristic or “rule-of-thumb” strategies work well because they aren’t likely to inspire greed or fear in investors. They become timeless. Thus, creating a ‘Mind-Gap’. (Martin,2019) In the US, the Vanguard Balanced Index Fund (Ticker: VBINX US) which combines US Total Market Index and 40% into US Aggregate bonds, plays a major role in showcasing the success of the 60/40 portfolio that has proved popular with US retail investors (Jaffe,2019). Similarly, in the UK the popularity of Vanguard LifeStrategy 60% (Ticker VGLS60A) showcases the merits of a straightforward 60/40 equity/bond approach. In 2020, for US investors VBINX provided greater (peak-to-trough) downside protection owing to lower beta (-19.5% vs -30.3% for US equity) and delivered total return of +16.26% volatility of 20.79%, compared to +18.37% for an ETF tracking the S&P 500 with volatility of 33.91%, both funds are net of fees. In this respect, the strategy captured 89% of market returns, with 61% of market risk. 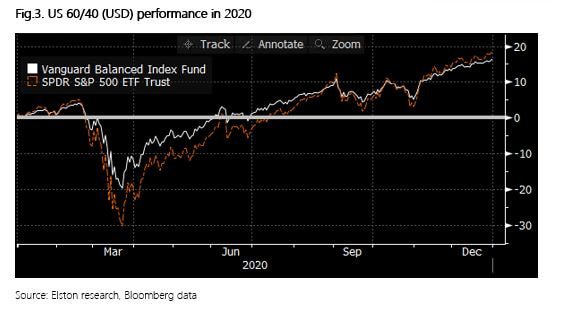 For GBP-based investors in 2020 the 60/40 approach had lower (peak-to-trough) drawdown levels (-15%, vs -21% for global equities) owing to lower beta. The 60% equity fund delivered total return of +7.84% with volatility of 15.12%, compared to +12.15% for an ETF tracking the FTSE All World Index with volatility of 24.29%. In this respect, the strategy captured 65% of market returns, with 62% of market risk. 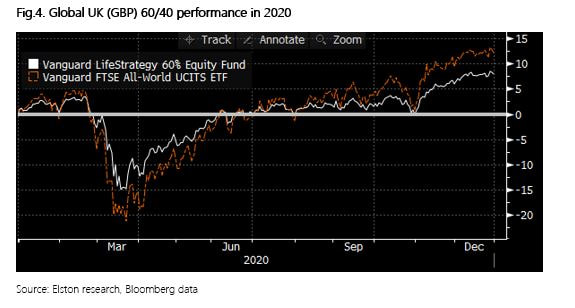 Why some think 60/40 has neared its end
Since its inception the 60/40 portfolio, derived 90% of the risk from stocks. In simple terms, 60% of the asset allocation of the portfolio was therefore the main driver of the portfolio. Returns (Robertson,2021). This hardly a surprise given that equities have a 84% contribution to portfolio ris, on our analysis, but the challenge made by some researchers is that if a 60/40 portfolio mainly reflects equity risk, what role does the 40% bond allocation provide, other than beta reduction? The bond allocation is under increasing scrutiny now is because global economic growth has slowed and traditionally safer asset classes like bonds have grown in popularity making bonds susceptible to sharp and sudden selloffs. (Matthews,2019) Strategists such as for Woodard and Harris, for Bank of America and Bob Rice for Tangent Capital have stated in their analysis that the core premise of the 60/40 portfolio has declined as equity has provided income, and bonds total return, rather than the other way round.. (Browne,2020) Another study shows that over the past 65 years bonds can no longer effectively hedge against inflation and risk reduction through diversification can be done more adequately by exploring alternatives such as private equity, venture capital etc. (Toschi, 2021). Left unconstrained, however, this can necessarily up-risk portfolios. With bond yields at an all-time low, nearing zero and the fact that they can no longer provide the protection in the up-and-coming markets many investors query the value provided by a bond allocation within a portfolio. (Robertson,2021) Key insights While point of views might differ about 60/40 as an investment strategy, one aspect that is accepted is that the future of asset allocation looks very different when compared to the recent past. Rising correlations, low yields have led strategists and investors to incorporate smarter ways of risk management, explore new bond markets like China, create modified opportunities for bonds to hedge volatility through risk parity strategies, as well as using real asset exposure such as real estate and infrastructure. (Toschi, 2021) Research conducted by The MAN Institute summarises that modifying from traditional to a more trend-following approach introduces the initial layer of active risk management. By adding an element of market timing investors further reduce the risk, when a market’s price declines. While bonds have declined in yield, they still hold importance in asset allocation for beta reduction. Further diversifying the portfolio with an allocation to real assets has potential to provide more yield and increased return than government bonds. Summary The 60/40 portfolio strategy has established itself over many decades, it has seen investors through four major wars, 14 recessions, 11 bear markets, and 113 rolling interest rate spikes. It has proved resilience as a strategy and utility as a benchmark. Our conclusion is that 60/40 is not dead: it is a useful multi-asset benchmark and remains a starting point for strategic asset allocation strategies. But the detail of the bond allocation needs a rethink. Incorporating alternative assets or strategies so long as any increased risk can be constrained to ensure comparable portfolio risk characteristics. Henry Cobbe & Aayushi Srivastava Elston Consulting Bibliography Browne, E., 2021. The 60/40 Portfolio Is Alive and Well. [online] Pacific Investment Management Company LLC. Available at: https://www.pimco.co.uk/en-gb/insights/blog/the-60-40-portfolio-is-alive-and-well Jaffe, C., 2019. No sale: Don’t buy in to ‘the end’ of 60/40 investing. [online] Seattle Times. Available at: https://www.seattletimes.com/business/no-sale-dont-buy-in-to-the-end-of-60-40-investing/ Martin, A., 2019. The 60/40 Portfolio Will Outlive Us All. [online] Advisorperspectives.com. Available at:https://www.advisorperspectives.com/articles/2019/11/11/the-60-40-portfolio-will-outlive-us-all#:~:text=As%20two%20recent%20commentaries%20demonstrate,40%20will%20outlive%20us%20all. Matthews, C., 2021. Bank of America declares ‘the end of the 60-40’ standard portfolio. [online] MarketWatch. Available at:https://www.marketwatch.com/story/bank-of-america-declares-the-end-of-the-60-40-standard-portfolio-2019-10-15 Robertson, G., 2021. 60/40 in 2020 Vision | Man Institute. [online] www.man.com/maninstitute. Available at:https://www.man.com/maninstitute/60-40-in-2020-vision Toschi, M., 2021. Why and how to re-think the 60:40 portfolio | J.P. Morgan Asset Management. [online] Am.jpmorgan.com. Available at: https://am.jpmorgan.com/be/en/asset-management/adv/insights/market-insights/on-the-minds-of-investors/rethinking-the-60-40-portfolio/  [5min read, open as pdf]
We agree it’s time to rethink the 60/40 portfolio. It’s a useful benchmark, but a problematic strategy. What is the 60/40 portfolio, and why does it matter? What it represents? Trying to find the very first mention of a 60/40 portfolio is proving a challenge, but it links back to Markowitz Modern Portfolio Theory and was for many years seen as close to the optimal allocation between [US] equities and [US] bonds. Harry Markowitz himself when considering a “heuristic” rule of thumb talked of a 50/50 portfolio. But the notional 60/40 equity/bond portfolio has been a long-standing proxy for a balanced mandate, combining higher-risk return growth assets with lower-risk-return, income generating assets. What’s in a 60/40? Obviously the nature of the equity and the nature of the bonds depends on the investor. US investor look at 60% US equities/40% US treasuries. Global investors might look at 60% Global Equities/40% Global Bonds. For UK investors – and our Elston 60/40 GBP Index – we look at 60% predominantly Global Equities and 40% predominantly UK bonds Why does it matter? In the same way as a Global Equities index is a useful benchmark for a “do-nothing” stock picker, the 60/40 portfolio is a useful benchmark for a “do-nothing” multi-asset investor. Multi-asset investors, with all their detailed decision making around asset allocation, risk management, hedging overlays and implementation options either do better than, or worse than this straightforward “do-nothing” approach of a regularly rebalanced 60/40 portfolio. Indeed – its simplicity is part of its appeal that enables investors to access a simple multi-asset strategy at low cost. The problem with Bonds in a 60/40 framework In October 2019, Bank of America Merrill Lynch published a research paper “The End of 60/40” which argues that “the relationship between asset classes has changed so much that many investors now buy equities not for future growth but for current income, and buy bonds to participate in price rallies”. This has prompted a flurry of opinions on whether or not 60/40 is still a valid strategy The key challenges with a 60/40 portfolio approach is more on the bond side:
So is 60/40 really dead? In short, as a benchmark no. As a strategy – we would argue that for serious investors, it never was one. We therefore think it’s important to distinguish between 60/40 as an investment strategy and 60/40 as a benchmark. We think that a vanilla 60/40 equity/bond portfolio remains useful as a benchmark to represent the “do nothing” multi-asset approach. However, we would concur that a vanilla 60/40 equity/bond portfolio, as a strategy offered by some low cost providers does – at this time – face the significant challenges identified in the 2019 report, that have been vindicated in 2020 and 2021. For example, during the peak of the COVID market crisis in March 2020, correlations between equities and bonds spiked upwards meaning there was “no place to hide”. The growing inflation risk has put additional pressure on nominal bonds. Real yields are negative. Interest rates won’t go lower. But outside of some low-cost retail products, very few portfolio managers, would offer a vanilla equity/bond portfolio as a client strategy. The inclusion of alternatives have always had an important role to play as diversifiers. Rethinking the 40%: What are the alternatives? When it comes to rethinking the 60/40 portfolio, investors will have a certain level of risk budget. So if that risk budget is to be maintained, there is little change to the “60% equity” part of a 60/40 portfolio. What about the 40%? We see opportunity for rethinking the 40% bond allocation by: We nonetheless think it is important to:
1. Rethinking the bond portfolio Whilst more extreme advocates of the death of 60/40 would push for removing bonds entirely, we would not concur. Bonds have a role to play for portfolio resilience in terms of their portfolio function (liquidity, volatility dampener), so would instead focus on a more nuanced approach between yield & duration. We would concur that long-dated nominal bonds look problematic, so would suggest a more “barbell” approach between shorter-dated bonds (as volatility dampener), and targeted, diversified bond exposures: emerging markets, high yield, inflation-linked (for diversification and real yield pick-up). 2. Incorporating sensible alternative assets Allocating a portfolio of the bond portfolio to alternatives makes sense, but we also need to consider what kind of alternatives. Whilst some managers are making the case for hedge funds or private markets as an alternative to bonds, we think there are sensible cost-efficient and liquid alternatives that can be considered for inclusion that either have bond-like characteristics (regular stable income streams), or provide inflation protection (real assets). For regular diversified income and inflation protection, we would consider: asset-backed securities, infrastructure, utilities and property. The challenge, however, is how to incorporate these asset classes without materially up-risking the overall portfolio. For inflation protection, we would consider real assets: property, diversified, commodities, gold and inflation-protected bonds. Properly incorporated these can fulfil a portfolio function that bonds traditionally provided (liquidity, income, ballast and diversification). 3. Consider risk-based diversification as an alternative strategy One of the key reasons for including bonds in a multi-asset portfolio is for diversification purposes from equities on the basis that one zigs when the other zags. In the short-term, and particularly at times of market stress, correlations between asset classes can increase, this reduces the diversification effect if bonds zag when equities zag. We would argue risk-based diversification strategies have a role to play to here, on the basis that rather than relying on long-run theoretical correlation, they systematically focus on short-run actual correlation between asset classes and adapt their asset allocation accordingly. Traditional portfolios means choosing asset weights which then drive portfolio risk and correlation metrics. Risk-based diversification strategies do this in reverse: they use short-run portfolio risk and correlation metrics to drive asset weights. If the ambition is to diversify and decorrelate, using a strategy that has this as its objective makes more sense. Summary So 60/40 is not dead. It will remain a useful benchmark for mult-asset investors. As an investment strategy, vanilla 60/40 equity/bond products will continue to attract assets for their inherent simplicity. But we do believe a careful rethink of the “40” is required. 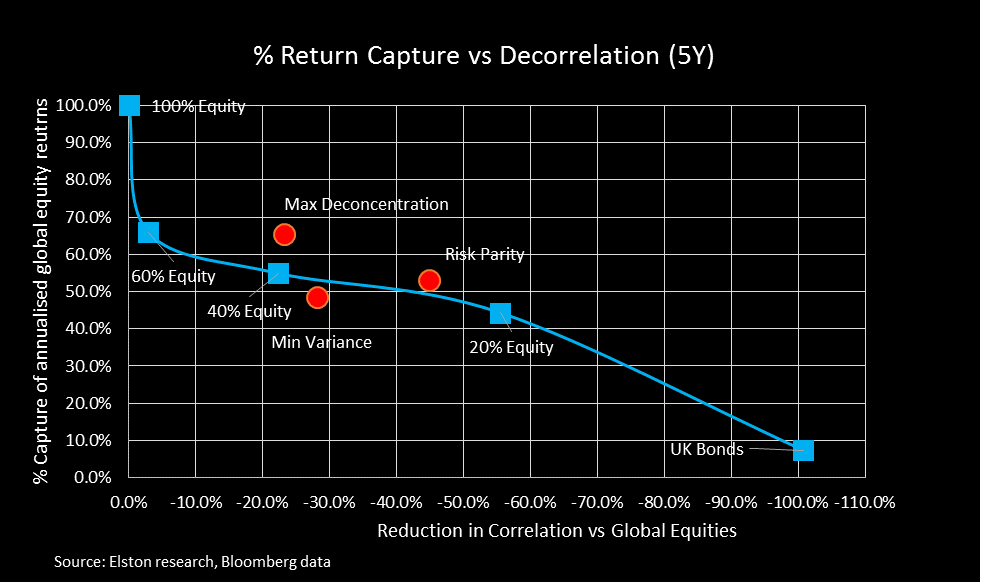 [7 min read, open as pdf for full report]
[See CPD webinar on risk-weighted diversification]
The challenge A 60/40 portfolio delivers asset-based diversification: it represents a mix between equities and bonds. However although a 60/40 portfolio reduces market beta, it does not provide “true” (risk-based) diversification: for example, a 60/40 portfolio, as represented by the Elston 60/40 GBP Index remains 97% correlated with Global Equities. This problem only increases in stressed markets where correlations between assets increase, as we saw in 2020. Risk-weighted strategies for “true” diversification Risk-weighted stratetgies, which represent multi-asset portfolios constructed towards a specific portfolio risk outcome, enable an alternative, differentiated approach to investing and for incorporating "true“diversification”. We look at the following risk-based strategies in our analysis: Risk Parity, Max Deconcentration, and Min Variance. These are summarised in more detail in the report. Comparing asset-weighted vs risk-weighted strategies How can we compare the efficacy of traditional asset-weighted strategies (e.g. 20%, 40%, and 60% equity/bond strategies), vs these risk-weighted strategies? One approach would be to compare the efficacy of risk-based strategies vs asset-based strategies from the perspective of 1) capturing equity returns, whilst 2) providing “true” diversification as measured by decorrelation impact (the reduction in correlation relative to global equities). In summary, the findings are that a Risk Parity strategy captured a similar level of equity returns as a 40% equity strategy, but with almost twice the level of decorrelation, meaning it delivers far greater “true” diversification relative to an asset-weighted strategy with similar return profile. Over the 5 years to December 2020, a 40% Equity strategy captured 44.3% of global equities annualised returns and delivered a correlation reduction of -22.3%. By contrast, a Risk Parity strategy captured 48.5% of global equity reutrns, and delivered a decorrelation of -44.8%, relative to global equities. So for portfolio constructors looking to deliver “true” risk-based diversification, whilst maintaining exposure to risk assets for the potential for returns, incorporating a risk-based strategy such as Risk Parity, Max Deconcentration, or Min Variance could make sense depending on portfolio risk budgets and preferences. For full quarterly performance update, open as pdf  [2 min read, open as pdf]
Targeted Absolute Return funds Targeted Absolute Return funds (“TAR”) were billed as “all weather” portfolios to provide positive returns in good years, and downside protection when the going gets rough. How have they fared in the COVID rollercoaster of 2020? Using our Risk Parity Index as a more relevant comparator We benchmark TAR funds to our Elston Dynamic Risk Parity Index: this is a risk-based diversification index whose construction (each asset class contributes equally to the risk of the overall strategy) and purpose (return capture, downside protection, moderate decorrelation) is closer in approach to TAR funds than, say, a Global Equity index or 60/40 equity/bond index. Absolute Return In terms of Absolute Return, ASI Global Absolute Return Strategies has performed best YTD +4.70%, followed by BNY Mellon Real Return +2.43%, both outperforming the Elston Dynamic Risk Parity Index return of +2.37%. Fig.1. YTD Performance Targeted Absolute Return funds 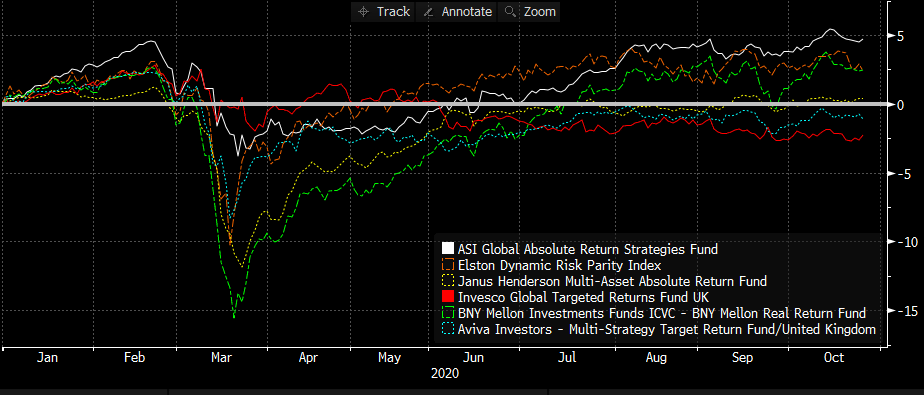 Source: Elston research, Bloomberg data. Total returns from end December 2018 to end September 2020 for selected real asset funds. Downside risk If downside protection is the desired characteristic, then it makes sense to look at drawdowns both by Worst Month and Maximum (peak-to-trough) Drawdown, rather than volatility. In this respect, Invesco Global Targeted Return provided greatest downside protection with a March drop of -1.11% and Max Drawdown of -1.99%; followed by ASI Global Absolute Return Strategies with a March drop of -2.74% and Max Drawdown of -3.81%. This compares to -5.14% and -10.23% respectively for the Risk Parity Index. Fig.2. YTD Total Return, Worst month, Max Drawdown 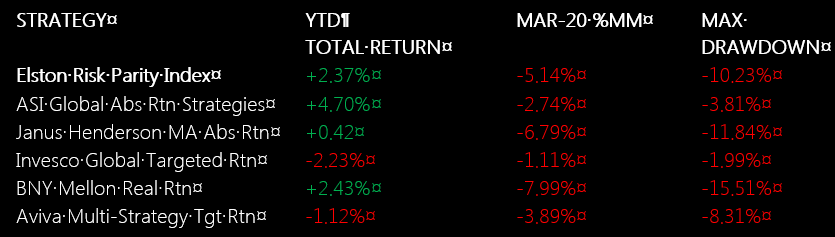 Source: Elston research, Bloomberg data. Year to date as at 27/10/20. Maximum drawdown: peak-to-trough drawdown in 2020. Total Return in GBP terms. Risk-adjusted returns: Total Return vs Max Drawdown Bringing it together, we can adapt the classic “risk-return” chart, but replacing volatility with Max Drawdown. On this basis, ASI Global Absolute Return Strategies has provided the best Total Return relative to Max Drawdown, followed by the Elston Dynamic Risk Parity Index. Whilst Invesco Global Targeted Return provided least drawdown, it also provided worst returns. Fig.3. Risk (Max Drawdown) vs Total Return (YTD, 2020) 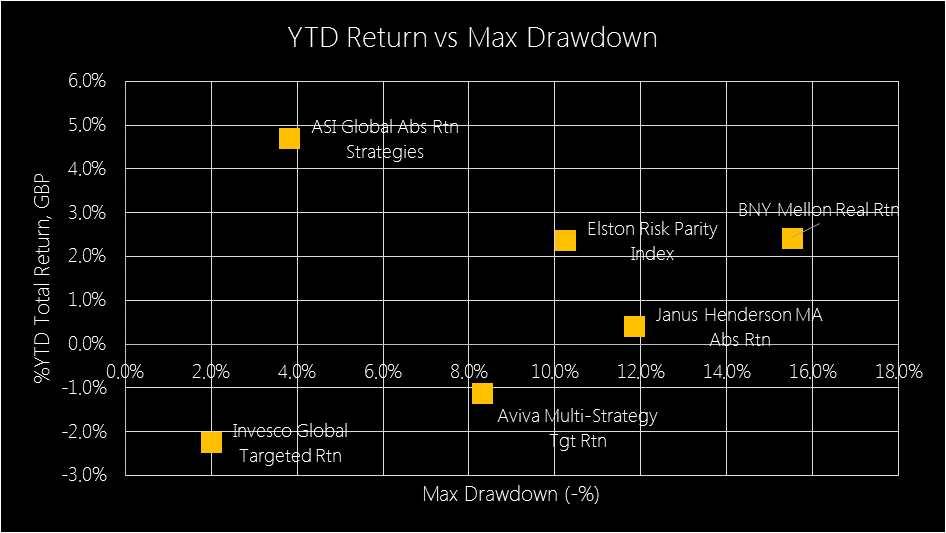 Source: Elston research, Bloomberg data, as at 27/10/20 in GBP terms Rolling Correlations We look at the change in Correlation (sometimes referred to as “ceta”) as a dynamic measure of diversification effect. By plotting the rolling 1 year daily correlation of each TAR Fund and our Risk Parity Index relative to a traditional 60/40 portfolio (we use the Elston 60/40 GBP Index as a proxy), we can see whether correlation increased or decreased during market stress. Elston Risk Parity Index correlation to the 60/40 GBP Index was relatively stable. Janus Henderson MA Absolute Return fund and BNY Mellon Real Return fund showed an increase in correlation into the crisis; ASI Global Absolute Return Strategies showed greatest correlation reduction into the crisis, delivering the diversification effect. Fig.4. Rolling -1year daily correlation to Elston 60/40 GBP Index 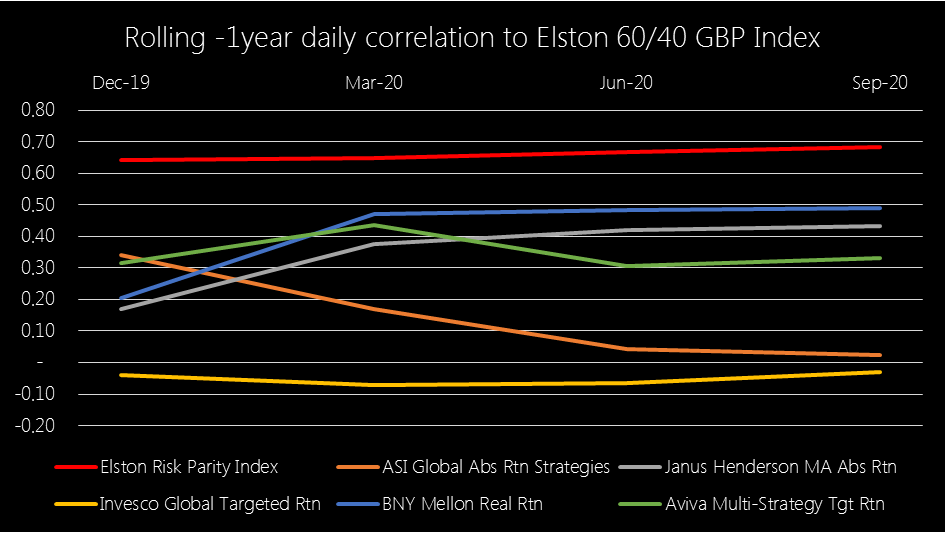 Source: Elston research, Bloomberg data, as at 27/10/20 in GBP terms
Summary Based on this analysis:
 High risk, complex Exchange Traded Products that amplify (with “leverage”) index’ moves in the same (“long”) or opposite (“short”) direction are designed for sophisticated investors who want to trade and speculate over the short-term, rather than make a strategic or tactical investment decisions. Whilst they can have a short-term role to play, they should be handled with care. If you think you understand them, then you’ve only just begun. In this series of articles, I look at some of the key topics explored in my book “How to Invest With Exchange Traded Funds” that also underpin the portfolio design work Elston does for discretionary managers and financial advisers. For more speculators and or more sophisticated risk managers there are a range of inverse (short) and leveraged (geared) ETPs that can rapidly add or remove upside or downside risk exposure in short-term (daily) market movements. The difference between speculating and investing should be clearly defined.
Owing to the higher degree of risk management and understanding required to use these products, they may not be suitable for DIY or long-term investors. However a degree of knowledge is helpful to identify them within a managed portfolio or amongst research sites. Defining terms Unlike their more straightforward unleveraged ETF cousins, leveraged and inverse or “short” ETNs should be for sophisticated investor or professional use only. So hold onto your seat. Shorting and leverage are important tools in a professional manager’s arsenal. But first we need to define terms. Going long: means buying a security now, to sell it at a later date at a higher value. The buyer has profited from the difference in the initial buying price and final selling price. Going short: means borrowing a security from a lender and selling it now, with an intent to buy it back at a later date at a lower value. Once bought, the security can be returned to the lender and the borrower (short-seller) has profited from the difference in initial selling and final buying price. Leverage: means increasing the magnitude of directional returns using borrowed funds. Leverage can be achieved by:
Underlying index: is the underlying index exposure against which a multiplier is applied. The underlying index could be on a particular market, commodity or currency. Potential applications Managers typically have a decision only whether to buy, sell or hold a security. By introducing products that provide short and/or leveraged exposure gives managers more tools at their disposal to manage risk or to speculate. Going short, and using leverage can be done for short-term risk management purposes, or for speculative purposes. Leverage in either direction (long-short) can be used either to amplify returns, profit from very short market declines, or change the risk profile of a portfolio without disposing of the underlying holdings. Short/Leveraged ETPs available to DIY investors The following types of short/leveraged ETPs are available to implement these strategies. Fig.1. Potential application of inverse/leveraged ETPs 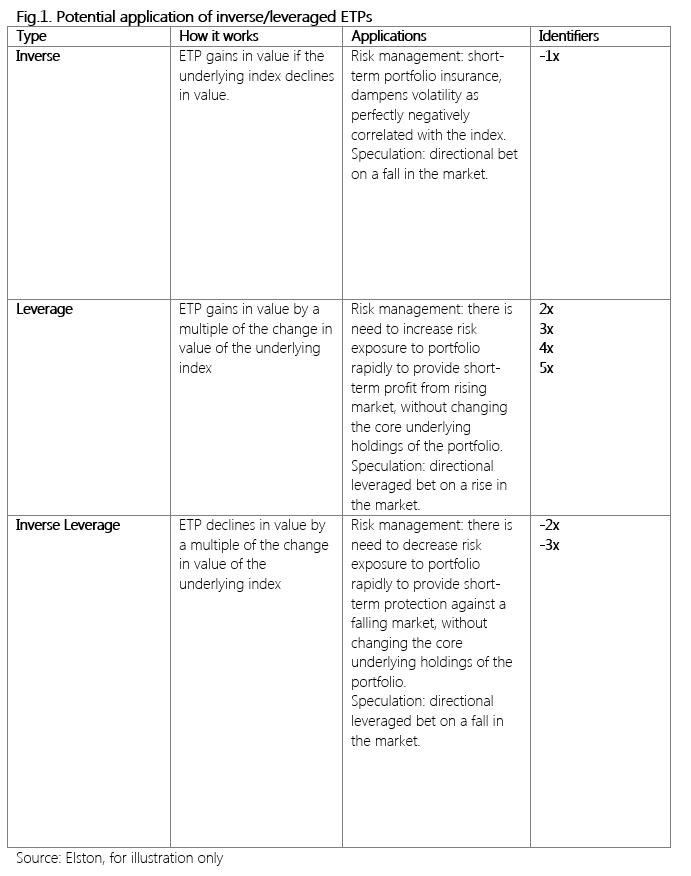 The ability to take short and/or leveraged positions was previously confined to professional managers and ultra-high net worth clients. The availability of more complex Exchange Traded Products gives investors and their advisers the opportunity to manage currency risk, create short positions (profit from a decline in prices) and create leveraged positions (profit more than the increase or decrease in prices).
Risks Leveraged and short ETPs have significantly greater risks than conventional ETFs. Some of the key risks are outlined below:
If concerned regarding risk of deploying short/leveraged ETPs, set a capped allocation i (eg no more than 3% to be held in leveraged/inverse ETPs, and a holding period for leveraged/inverse ETPs not to exceed 1-5 days). US Case Study: Inverse Volatility Blow Up VelocityShares Daily Inverse VIX Short-Term ETN (IVX) and ProShares Short VIX Short-Term Futures ETF were products created in the US for professional investors who wanted to profit from declining volatility on the US equity market by tracking the inverse (-1x) returns of the S&P VIX Short-Term Futures Index. The VIX is itself an reflecting the implied volatility of options on the S&P 500. As US equity market volatility steadily declined the stellar performance of the strategy in prior years not only made it popular with hedge funds[2], but also lured retail investors who are unlikely to have understood the complexity of the product. By complexity, we would argue that a note inversely tracking a future on the implied volatility of the stock market is hardly simple. On 5th February, the Dow Jones Industrial Average suffered its largest ever one day decline. This resulted in the VIX Index spiking +116% (from implied ~12% volatility to implied ~33% volatility). The inverse VIX ETNs lost approximately 80% of their value in one day which resulted in an accelerated closure of the product, and crystallising the one day loss for investors[3]. The SEC (US regulator) focus was not on the product itself but whether and why it had been mis-sold to retail investors who would not understand its complexity[4]. Summary In conclusion, on the one hand, Leveraged/Inverse ETP are convenient ways of rapidly altering risk-return exposures and provide tools with which speculators can play short-term trends in the market. Used by professionals, they also have a role in supporting active risk management. However, the risks are higher than for conventional ETFs and more complex to understand and quantify. RISK WARNING! Short and/or Leveraged ETPs are highly complex financial instruments that carry significant risks and can amplify overall portfolio risk. They are intended for financially sophisticated investors who understand these products, and their potential pay offs. They can be used to take a very short term view on an underlying index, for example, for day-trading purposes. They are not intended as a buy and hold investment. [1] https://seekingalpha.com/article/1457061-how-to-beat-leveraged-etf-decay [2] https://www.cnbc.com/2018/02/06/the-obscure-volatility-security-thats-become-the-focus-of-this-sell-off-is-halted-after-an-80-percent-plunge.html [3] https://www.bloomberg.com/news/articles/2018-02-06/credit-suisse-is-said-to-consider-redemption-of-volatility-note [4] https://www.bloomberg.com/news/articles/2018-02-23/vix-fund-blowups-spur-u-s-to-probe-if-misconduct-played-a-role |
ELSTON RESEARCHinsights inform solutions Categories
All
Archives
July 2024
|
 RSS Feed
Company |
Solutions |
|