
 [2 min read, open as pdf]
Targeted Absolute Return funds Targeted Absolute Return funds (“TAR”) were billed as “all weather” portfolios to provide positive returns in good years, and downside protection when the going gets rough. How have they fared in the COVID rollercoaster of 2020? Using our Risk Parity Index as a more relevant comparator We benchmark TAR funds to our Elston Dynamic Risk Parity Index: this is a risk-based diversification index whose construction (each asset class contributes equally to the risk of the overall strategy) and purpose (return capture, downside protection, moderate decorrelation) is closer in approach to TAR funds than, say, a Global Equity index or 60/40 equity/bond index. Absolute Return In terms of Absolute Return, ASI Global Absolute Return Strategies has performed best YTD +4.70%, followed by BNY Mellon Real Return +2.43%, both outperforming the Elston Dynamic Risk Parity Index return of +2.37%. Fig.1. YTD Performance Targeted Absolute Return funds 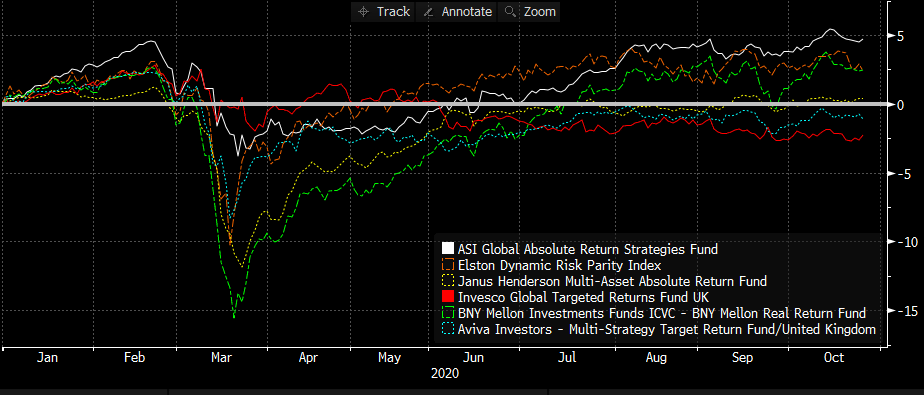 Source: Elston research, Bloomberg data. Total returns from end December 2018 to end September 2020 for selected real asset funds. Downside risk If downside protection is the desired characteristic, then it makes sense to look at drawdowns both by Worst Month and Maximum (peak-to-trough) Drawdown, rather than volatility. In this respect, Invesco Global Targeted Return provided greatest downside protection with a March drop of -1.11% and Max Drawdown of -1.99%; followed by ASI Global Absolute Return Strategies with a March drop of -2.74% and Max Drawdown of -3.81%. This compares to -5.14% and -10.23% respectively for the Risk Parity Index. Fig.2. YTD Total Return, Worst month, Max Drawdown 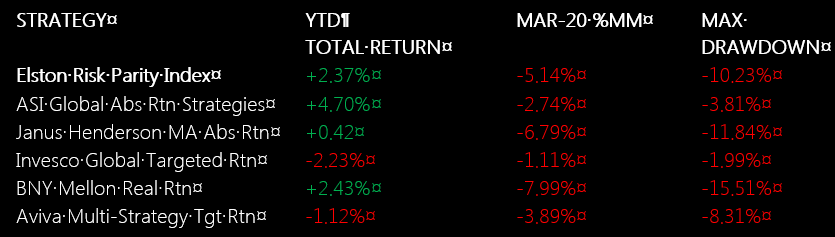 Source: Elston research, Bloomberg data. Year to date as at 27/10/20. Maximum drawdown: peak-to-trough drawdown in 2020. Total Return in GBP terms. Risk-adjusted returns: Total Return vs Max Drawdown Bringing it together, we can adapt the classic “risk-return” chart, but replacing volatility with Max Drawdown. On this basis, ASI Global Absolute Return Strategies has provided the best Total Return relative to Max Drawdown, followed by the Elston Dynamic Risk Parity Index. Whilst Invesco Global Targeted Return provided least drawdown, it also provided worst returns. Fig.3. Risk (Max Drawdown) vs Total Return (YTD, 2020) 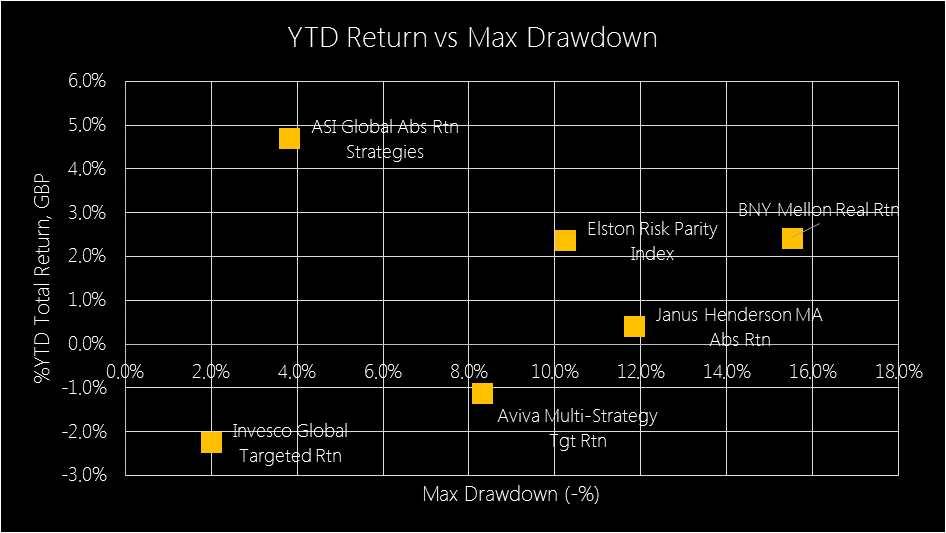 Source: Elston research, Bloomberg data, as at 27/10/20 in GBP terms Rolling Correlations We look at the change in Correlation (sometimes referred to as “ceta”) as a dynamic measure of diversification effect. By plotting the rolling 1 year daily correlation of each TAR Fund and our Risk Parity Index relative to a traditional 60/40 portfolio (we use the Elston 60/40 GBP Index as a proxy), we can see whether correlation increased or decreased during market stress. Elston Risk Parity Index correlation to the 60/40 GBP Index was relatively stable. Janus Henderson MA Absolute Return fund and BNY Mellon Real Return fund showed an increase in correlation into the crisis; ASI Global Absolute Return Strategies showed greatest correlation reduction into the crisis, delivering the diversification effect. Fig.4. Rolling -1year daily correlation to Elston 60/40 GBP Index 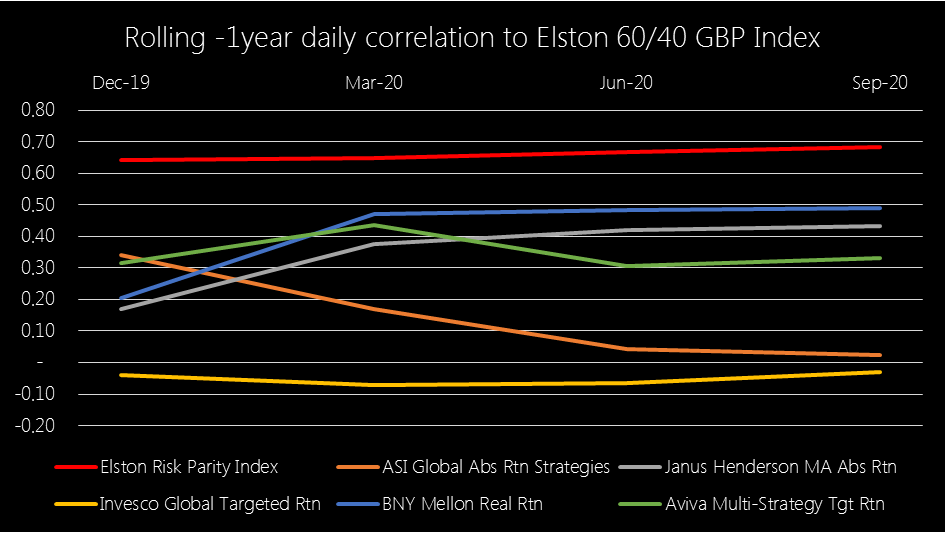 Source: Elston research, Bloomberg data, as at 27/10/20 in GBP terms
Summary Based on this analysis:
Comments are closed.
|
ELSTON RESEARCHinsights inform solutions Categories
All
Archives
July 2024
|
 RSS Feed
Company |
Solutions |
|