
 For investors wanting a differentiated approach to implementing a global equity exposure, what are the options?
Read the full article in FT Adviser  [5min read, open as pdf]
 Central Banks' policy rates are expected to pivot towards cuts in 2024 with a material impact on asset class perspectives.
Read the full article in FT Adviser  [5 min read]
2022 was a reminder of the importance of dispersion within equity markets. It turns out this lesson remains relevant in 2023 but with very different - almost opposite - themes. Read the article in FT Adviser  [5 min read, open as pdf]
 [3 min read - open as pdf]
 [5 min read, open as pdf]
 [5min read, open as pdf]
 NMA speaks to investment consultant Henry Cobbe about positioning equities for higher inflation using sector and factor equity investing.
Listen to the podcast  [5 min read]
1. Yield is back: for equities, bonds and alternatives - the yield drought is over 2. Selectivity matters more: within and across asset classes 3. Inflation is getting stickier: getting past the peak, but still a problem Read the summary article Find out more:
 [5 min read, open as pdf]
 [3 min read, open as pdf]
 [5 min read, open as pdf]
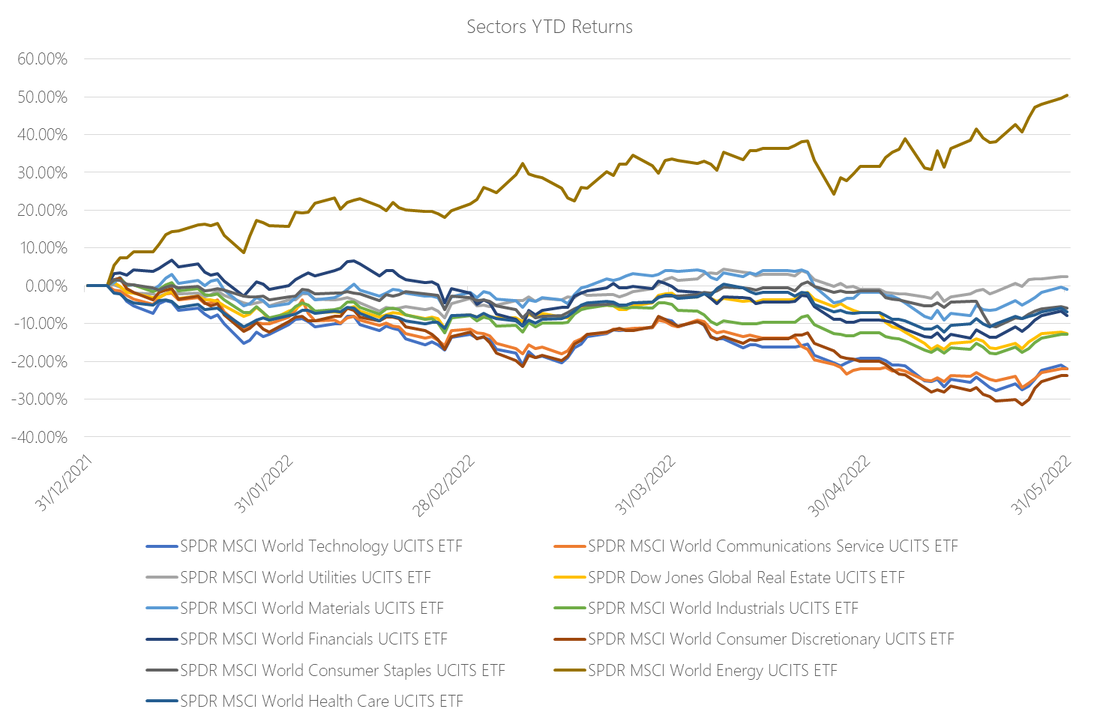
The uncertainty of the current market environment is prompting a pivot away from sectors that have served investors well, in many cases since the financial crisis but particularly during the Covid-19 pandemic. With inflation rampant, commodity prices spiralling, supply chains choked and the much relied-on ‘Fed Put’ (whereby central banks rescue markets by flooding them with liquidity) a thing of the past, investors are rotating away from Technology and Real Estate and into traditionally “boring”, but dependable sectors like Industrials, Materials and Energy. For full article, see pdf  [3 min read, open as pdf]
2021 in review Our 2021 market roundup summarises another strong year for markets in almost all asset classes except for Bonds which remain under pressure as interest rates are expected to rise and inflation ticks up. Listed private equity (shares in private equity managers) performed best at +43.08%yy in GBP terms. US was the best performing region at +30.06%. Real asset exposures, such as Water, Commodities and Timber continued to rally in face of rising inflation risk, returning +32.81%, +28.22% and +17.66% respectively. 2022 outlook We are continuing in this “curiouser, through-the-looking glass” world. Traditionally you bought bonds for income, and equity for risk. Now it’s the other way round. Only equities provide income yields that have the potential to keep ahead of inflation. Bonds carry increasing risk of loss in real terms as inflation and interest rates rise. Real yields, which are bond yields less the inflation rate, are negative making traditional Bonds which aren’t linked to inflation highly unattractive. Bonds that are linked to inflation are highly sensitive to rising interest rates (called duration risk), so are not attractive either. How to navigate markets in this context? The big three themes for the year ahead are, in our view:
See full report in pdf Attend our 2022 Outlook webinar  [5 min read, open as pdf]
Tech performance is skewing cap-weighted indices The run up in technology stocks and the inclusion of Tesla into the S&P500 has increased both sector concentration and security concentration. The Top 10 has typically represented approximately 20% of the index, it now represents 27.4%. The chart below shows the Top 10 holdings weight over time. 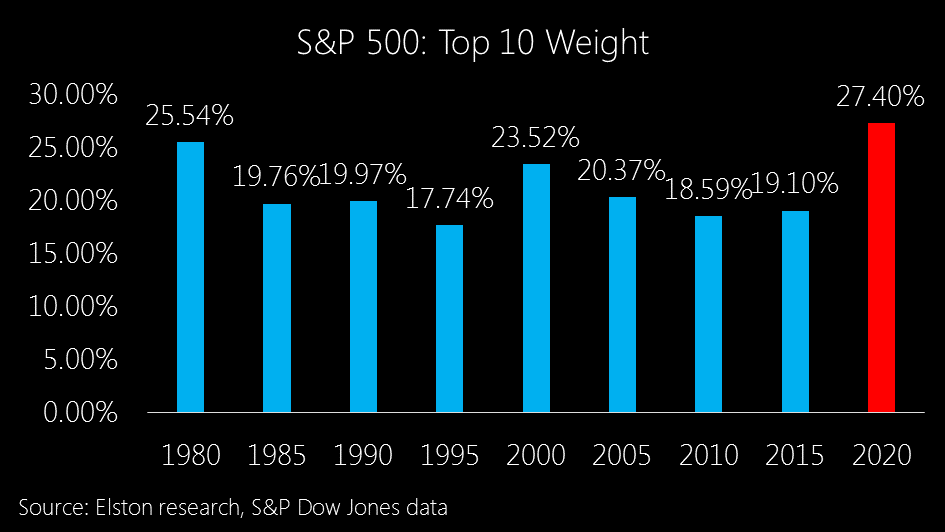 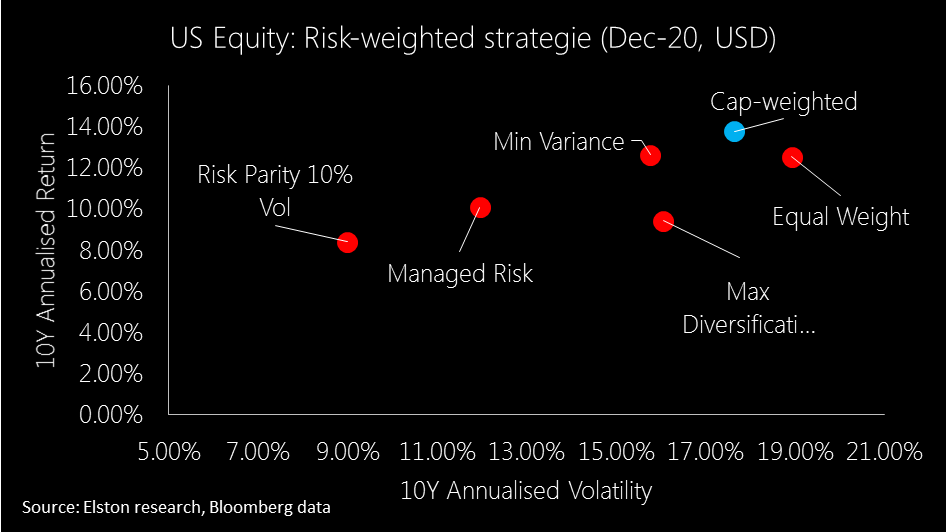 Rather than looking just at Risk vs Return, we also look at Beta vs Correlation to see to what extent each strategy has 1) not only reduced Beta relative to the market, but also 2) reduced Correlation (an indication of true diversification). Strategies with lower Correlation have greater diversification effect from a portfolio construction perspective. Ironically, the last time the index was anything close to being this concentrated was back in 1980 when IBM, AT&T and the big oil majors ruled the roost. From a sector perspective, as at end December 2020, Information Technology now makes up 27.6% of the index. Increased concentration reduces diversification This level of concentration is indeed skewing indices that rely on a traditional market capitalisation-weighted (cap-weighted) methodology, and does therefore reduce diversification. But the issue of the best performing stocks getting a larger weighting in the index, is not an accident of traditional index design. It’s its very core. Cap-weighted indices reflect the value placed on securities by investors, not the other way round. We should not therefore conflate the debate around “active vs passive” investment approaches, with the debate around index methodology. If portfolio managers are concerned about over-exposure to particular company or sector within a cap-weighted index, they can either chose an active, non-index fund, that is not a closet-tracker. Or they can access the target asset class through an alternatively weighted index, which uses a security weighting scheme other than market capitalisation. Using cap-weighted indices is an active choice The decision to use a fund that tracks an cap-weighted index is an active choice. And for those seeking differentiated exposure, there is a vast range of options available. We categorise these into 3 sub-groups: Style, Factor-based and Risk-based.
How have US equity risk-based strategies fared? Risk-based strategies have been in existence for some time, so we are able now to consider 10 year data (to December 2020, in USD terms). In terms of risk-adjusted performance, Managed Risk index strategies have fared best, whilst Min Variance has delivered higher returns for similar levels of risk of a Max Diversification strategy. Meanwhile Equal Weight has actually exhibited greater risk than traditional cap-weighted approach. 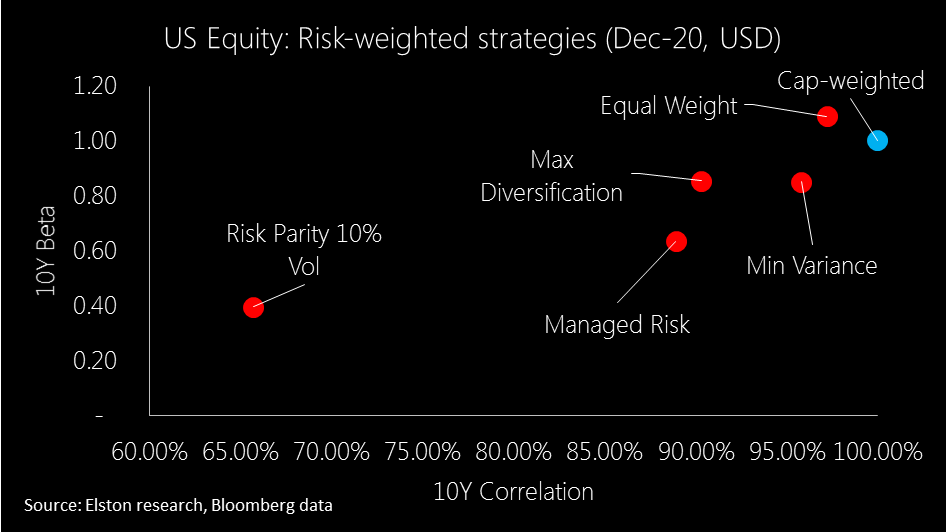 In this respect, Equal Weight (Max Deconcentration), also disappoints delivering higher beta and >95% correlation. Likewise Min Variance, whilst delivering on Beta reduction, does not deliver on decorrelation. Max Diversification delivers somewhat on decorrelating the strategy from the S&P500, but only modestly, whilst Managed Risk achieves similar decorrelation, reduced beta and better returns. Finally Risk Parity 10% Volatility cap has delivered most decorrelation as well as beta reduction.
For more information about the indices and funds used to represent these different strategies, please contact us. Summary There are a broad range of alternatives to cap-weighted index exposures. But consideration of style-, factor- or risk-based objectives will necessarily inform portfolio construction.
Find out more For more insights and information on research, portfolios and indices, visit: www.elstonsolutions.co.uk or NH ETF<Go> 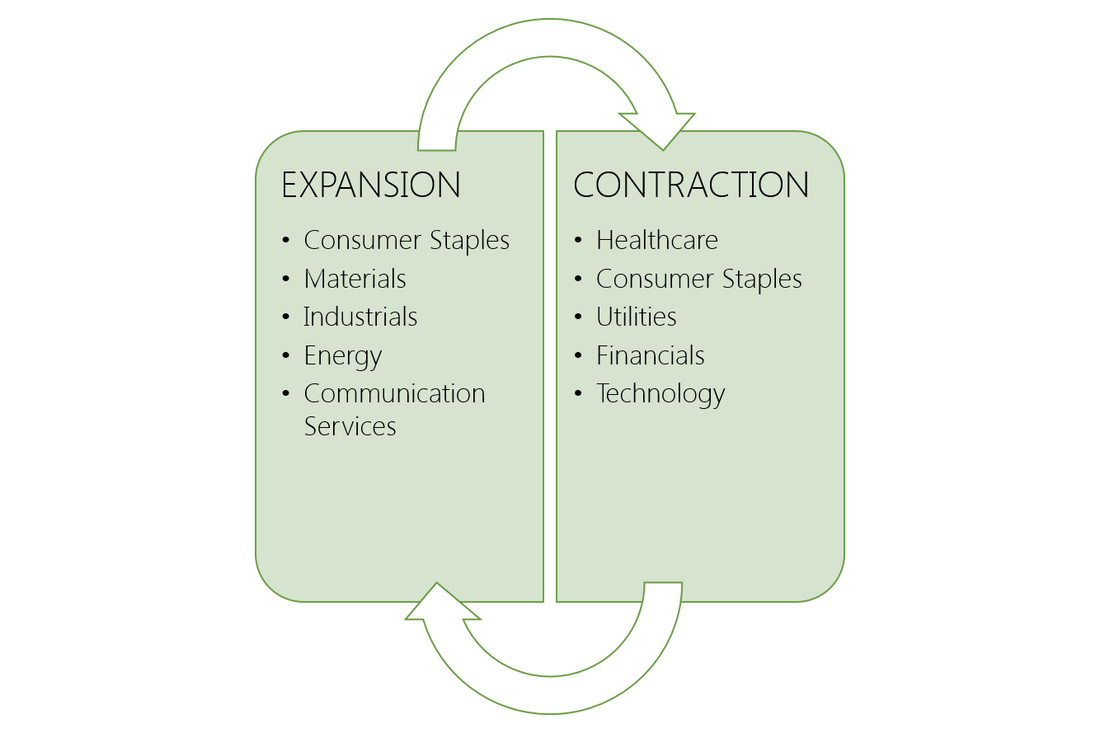
Sectors: walking or just talking? Most portfolio managers discuss markets within the context of the economic cycle. And no wonder: the main drivers of market performance – growth, inflation and interest rates – are not constants but fluctuate with the economic cycle. Managers point to their stock selection decisions because a particular company is seen as “cyclical” or “defensive”. In theory, cyclical companies do relatively better when the economy is expanding. Defensive companies do relatively better when the economy is slowing or contracting. But despite talking the talk on sectors when analysing the economic outlook, it’s harder to judge whether or not managers are walking the walk when it comes to sector investing. If your portfolio manager is not providing a sector allocation in their reporting back, perhaps ask for one. What exactly is a sector? A sector is a group of companies which provide the same or related product or service. The most broadly use classification system is the Global Industry Classification Standard (“GICS”) which categorises companies into 11 distinct sectors. GICS further defines 69 industry types that fall within each of those sectors. Cyclical or Defensive? When a company’s earnings are dependent on or more correlated with the broader economic business cycle, they are “cyclical”. When a company’s earnings are independent of or less correlated with the broader economic business cycle, they are defensive as in theory are less impacted by downswings in the economy. The list of sectors includes sectors considered “cyclical” such as: Communication Services, Consumer Discretionary, Financials, Industrials, Materials, and Technology; and sectors considered “defensive” sectors such as: Consumer Staples, Energy, Health Care, Utilities and Real Estate. Sector indices Sector indices calculate the performance of, typically, the combined market capitalisation of each distinct sector. In this way we are able to see the performance of each sector at different stages of the economic cycle on a standalone basis, in comparison with other sectors, and relative to the overall equity market. Why use a sector lense? By looking both the economy AND the market through a sector lense it is possible to analyse how groups of companies with commonalities as regards their input (expenses) and output (revenues) behave relative to their peers to inform comparisons within each sector, and comparisons between sectors over different time frames. This helps us understand the impact the economy has on sector-specific drivers, and which sectors could be in favour or out of favour at different stages of the economic cycle. Understanding the economic cycle The economic cycle (a.k.a business cycle) is the fluctuation in economic growth rates over time as measured by real (inflation adjusted) Gross Domestic Product as measured by national statistic offices. The economic cycle can be broken down into two broad states: expansion (trend of economic growth) and recession (trend of economic decline). Expansions are measured from the trough (or bottom) of the previous economic cycle to the peak of the current cycle, while recession is measured from the peak to the trough. The economic is different from the market cycle (the fluctuation of the equity markets over time), although one can impact the other. What drives sector performance? Economic activity changes at different changes in the cycle. In periods of expansion, consumers are more likely to increase their non-essential discretionary spending – so Consumer Discretionary should do better. In periods of recession, consumers are more likely to hunker down and focus only on essential spending – so Consumer Staples and Utilities should do better, for example. This seems intuitive. Furthermore, research suggests that more specifically it is the role of monetary policy that really drives sector performance. Central Banks adapt monetary policy based on the economic cycle. When monetary policy is easing, cyclical stocks do generally better. When monetary policy is tightening, defensive stocks generally do better. Surfing the cycle Given the economic cycle and monetary policy are in flux, it follows that an investor with a strategic allocation to equities should dynamically allocate to different sectors at different stages of the cycle, rotating from cyclicals to defensives and back again as the economic cycle fluctuates. This sector rotation strategy can earn “consistent and economically significant excess return while requiring only infrequent rebalancing”. Accessing sectors All equities fall within a sector grouping. Investors must therefore decide whether they wish to construct a portfolio of stocks within each sector or have a fairly concentrated holding within each sector. For investors that want to maximise diversification within each sector, a sector ETF is a convenient way of accessing targeted and comprehensive exposures to distinct sectors. Sector investing Whether investing in a particular sector to capitalise on specific sector trends, or seeking to implement a dynamic allocation strategy between sectors over the economic cycle with an equity allocation, sector ETFs offer a low-cost and convenient way of implementing cyclical sector views efficiently and precisely. Notices and Disclaimers: Disclosure: I/we have no positions in any stocks mentioned, and no plans to initiate any positions within the next 72 hours. Additional disclosure: Recently published Elston ETF Research reports “Sector Equities: 4q18 Update” and “Sector Equities: 4q18 Survey” were sponsored by State Street Global Advisors Limited. We warrant that the information in this article is presented objectively. For further information, please refer to important Notices and Disclosures please see our website www.ElstonETF.com This article has been written for a UK audience. Tickers are shown for corresponding and/or similar ETFs prefixed by the relevant exchange code, e.g. “LON:” (London Stock Exchange) for UK readers. For research purposes/market commentary only, does not constitute an investment recommendation or advice, and should not be used or construed as an offer to sell, a solicitation of an offer to buy, or a recommendation for any product. This article reflects the views of the author and does not necessarily reflect the views of Elston Consulting, its clients or affiliates. For information and disclaimers, please see www.ElstonETF.com Photo credit: N/A; Chart credit: Elston Consulting; Table credit: Elston Consulting  In December we conducted a Survey of senior portfolio managers and decision makers from firms whose combined assets under management is in excess of £500bn. The survey was designed to get a better understanding on how those managers approach sector investing.
Our key findings based on the survey are summarised below:
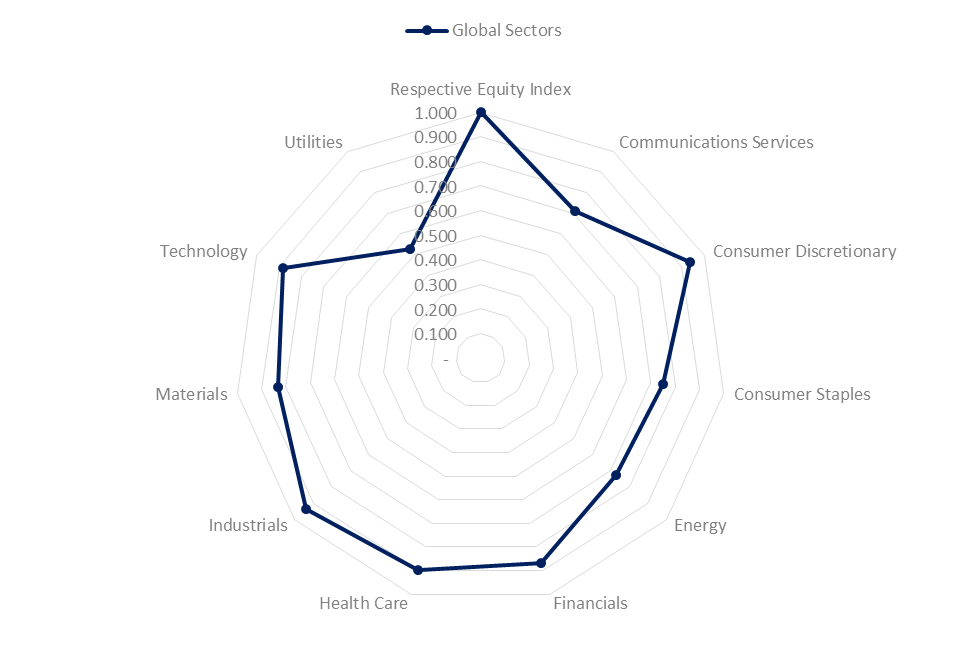
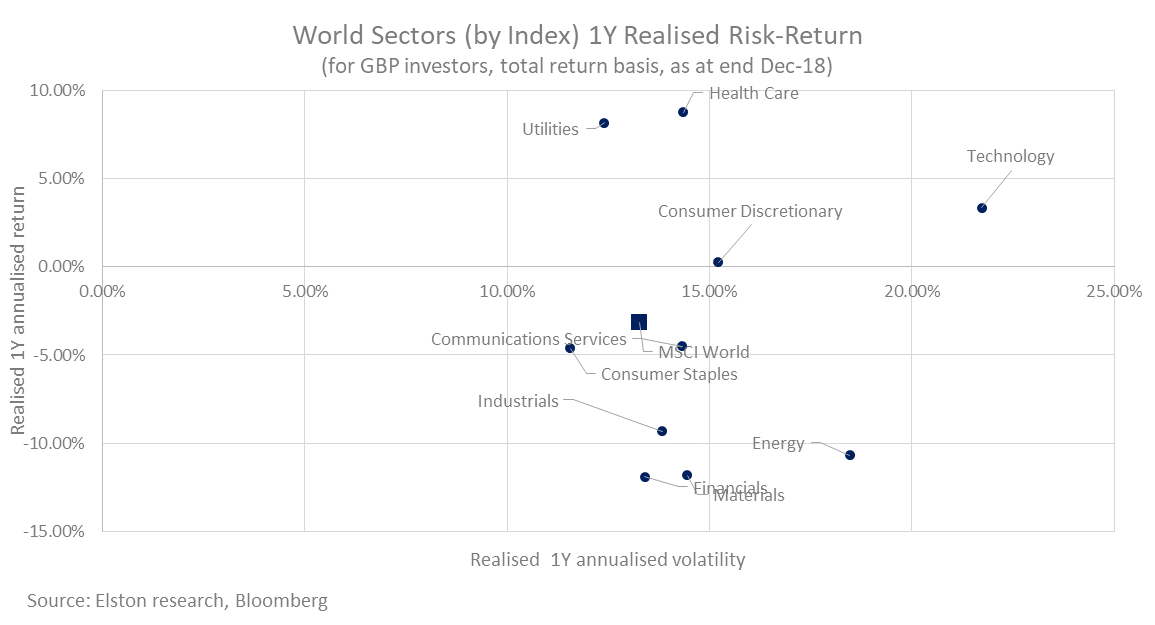
Anywhere to hide? For investors with a broad mandate, asset allocation decisions between equities, alternatives, bonds and cash and equivalents gives scope to limit the impact of market volatility. But what about for mandates which necessarily must remain fully invested in equities. Within the equity sleeve, we believe a sector perspective enables investors to make nuanced adjustments to their equity portfolio. Lower volatility On a one year basis, the lowest volatility sector is Consumer Staples with a volatility of 11.6% compared to 13.3% for World Equities. Consumer Staples is nonetheless 75.1% correlated to world equities. Potential Diversifier Over the last two years, Utilities has shown both lowest beta (0.52) and lowest correlation (52.8%) to world equities. This makes the Utilities sector a potential diversifier within a portfolio context. Chasing growth? From a momentum perspective, Technology remains the strongest performing sector with an annualised return over 3 years of +20.2% (in GBP terms). Conclusion Whilst economic outlook remains key driver for sector-based performance, the current volatility and correlation characteristics of specific sectors are informative from a portfolio construction perspective. Source: Elston Research, Bloomberg. Indices used: MSCI World Index and MSCI World sector index data Notes: Volatility: annualised 260 day volatility to 31-Dec-18; Correlation: 2 year correlation of daily returns to 31-Dec-18; all data expressed in GBP terms. Notices and Disclaimers: Disclosure: I/we have no positions in any stocks mentioned, and no plans to initiate any positions within the next 72 hours. Additional disclosure: The data in this article comes from an Elston ETF Research report “Sector Equities: 4q18 Update” that was sponsored by State Street Global Advisors Limited. We warrant that the information in this article is presented objectively. For further information, please refer to important Notices and Disclosures in that Report which is available on our website www.ElstonETF.com This article has been written for a UK audience. Tickers are shown for corresponding and/or similar ETFs prefixed by the relevant exchange code, e.g. “LON:” (London Stock Exchange) for UK readers. For research purposes/market commentary only, does not constitute an investment recommendation or advice, and should not be used or construed as an offer to sell, a solicitation of an offer to buy, or a recommendation for any product. This article reflects the views of the author and does not necessarily reflect the views of Elston Consulting, its clients or affiliates. For information and disclaimers, please see www.ElstonETF.com Photo credit: N/A; Chart credit: Elston Consulting; Table credit: Elston Consulting
 |
ELSTON RESEARCHinsights inform solutions Categories
All
Archives
July 2024
|
 RSS Feed
Company |
Solutions |
|