
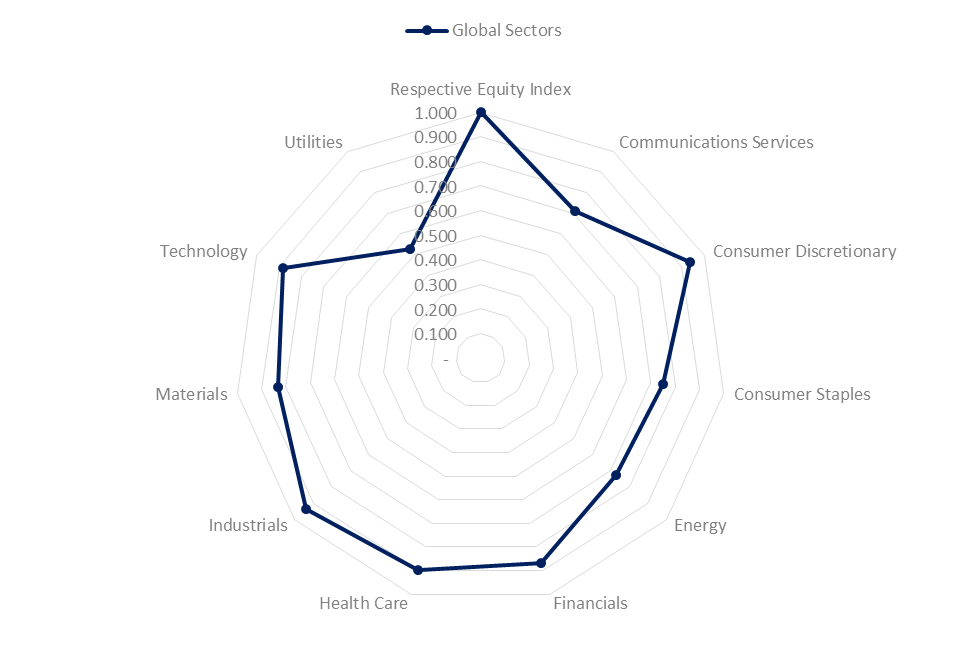
Anywhere to hide? For investors with a broad mandate, asset allocation decisions between equities, alternatives, bonds and cash and equivalents gives scope to limit the impact of market volatility. But what about for mandates which necessarily must remain fully invested in equities. Within the equity sleeve, we believe a sector perspective enables investors to make nuanced adjustments to their equity portfolio. Lower volatility On a one year basis, the lowest volatility sector is Consumer Staples with a volatility of 11.6% compared to 13.3% for World Equities. Consumer Staples is nonetheless 75.1% correlated to world equities. Potential Diversifier Over the last two years, Utilities has shown both lowest beta (0.52) and lowest correlation (52.8%) to world equities. This makes the Utilities sector a potential diversifier within a portfolio context. Chasing growth? From a momentum perspective, Technology remains the strongest performing sector with an annualised return over 3 years of +20.2% (in GBP terms). Conclusion Whilst economic outlook remains key driver for sector-based performance, the current volatility and correlation characteristics of specific sectors are informative from a portfolio construction perspective. Source: Elston Research, Bloomberg. Indices used: MSCI World Index and MSCI World sector index data Notes: Volatility: annualised 260 day volatility to 31-Dec-18; Correlation: 2 year correlation of daily returns to 31-Dec-18; all data expressed in GBP terms. Notices and Disclaimers: Disclosure: I/we have no positions in any stocks mentioned, and no plans to initiate any positions within the next 72 hours. Additional disclosure: The data in this article comes from an Elston ETF Research report “Sector Equities: 4q18 Update” that was sponsored by State Street Global Advisors Limited. We warrant that the information in this article is presented objectively. For further information, please refer to important Notices and Disclosures in that Report which is available on our website www.ElstonETF.com This article has been written for a UK audience. Tickers are shown for corresponding and/or similar ETFs prefixed by the relevant exchange code, e.g. “LON:” (London Stock Exchange) for UK readers. For research purposes/market commentary only, does not constitute an investment recommendation or advice, and should not be used or construed as an offer to sell, a solicitation of an offer to buy, or a recommendation for any product. This article reflects the views of the author and does not necessarily reflect the views of Elston Consulting, its clients or affiliates. For information and disclaimers, please see www.ElstonETF.com Photo credit: N/A; Chart credit: Elston Consulting; Table credit: Elston Consulting Comments are closed.
|
ELSTON RESEARCHinsights inform solutions Categories
All
Archives
July 2024
|
 RSS Feed
Company |
Solutions |
|