
 [7 min read, open as pdf for full report]
[See CPD webinar on risk-weighted diversification]
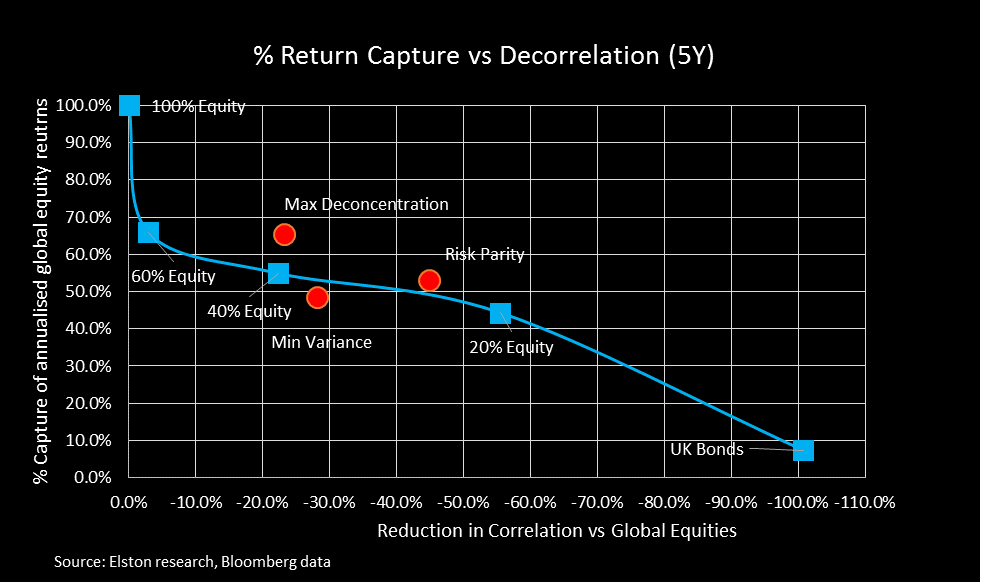
The challenge A 60/40 portfolio delivers asset-based diversification: it represents a mix between equities and bonds. However although a 60/40 portfolio reduces market beta, it does not provide “true” (risk-based) diversification: for example, a 60/40 portfolio, as represented by the Elston 60/40 GBP Index remains 97% correlated with Global Equities. This problem only increases in stressed markets where correlations between assets increase, as we saw in 2020. Risk-weighted strategies for “true” diversification Risk-weighted stratetgies, which represent multi-asset portfolios constructed towards a specific portfolio risk outcome, enable an alternative, differentiated approach to investing and for incorporating "true“diversification”. We look at the following risk-based strategies in our analysis: Risk Parity, Max Deconcentration, and Min Variance. These are summarised in more detail in the report. Comparing asset-weighted vs risk-weighted strategies How can we compare the efficacy of traditional asset-weighted strategies (e.g. 20%, 40%, and 60% equity/bond strategies), vs these risk-weighted strategies? One approach would be to compare the efficacy of risk-based strategies vs asset-based strategies from the perspective of 1) capturing equity returns, whilst 2) providing “true” diversification as measured by decorrelation impact (the reduction in correlation relative to global equities). In summary, the findings are that a Risk Parity strategy captured a similar level of equity returns as a 40% equity strategy, but with almost twice the level of decorrelation, meaning it delivers far greater “true” diversification relative to an asset-weighted strategy with similar return profile. Over the 5 years to December 2020, a 40% Equity strategy captured 44.3% of global equities annualised returns and delivered a correlation reduction of -22.3%. By contrast, a Risk Parity strategy captured 48.5% of global equity reutrns, and delivered a decorrelation of -44.8%, relative to global equities. So for portfolio constructors looking to deliver “true” risk-based diversification, whilst maintaining exposure to risk assets for the potential for returns, incorporating a risk-based strategy such as Risk Parity, Max Deconcentration, or Min Variance could make sense depending on portfolio risk budgets and preferences. For full quarterly performance update, open as pdf  [7 min read, open as pdf] [See CPD webinar on introduction to factor-based investing]
Stellar performance If there’s one word to describe the performance of Terry Fundsmith’s Fundsmith Equity Fund, it would be “stellar”. Beloved by retail investors and advisers alike, it’s a key holding in many of the portfolio we see that are run by financial advisers. The firm’s values are clearly set out “No performance fees, no nonsense, no shorting, no market timing, no index hugging, no hedging" and so on. All this combined with great results, and it’s a compelling proposition. But in this article, we set out to answer four questions:
In summary, the answers are, respectively: Possibly, Sector Allocation, Definitely Not, and Yes. What is Momentum investing? MSCI defines momentum factor as referring to “the tendency of winning stocks to continue performing well in the near term. Momentum is categorized as a “persistence” factor i.e., it tends to benefit from continued trends in markets”[1]. Following the lows of the Global Financial Crisis, it’s been a great time to be a Momentum investor. Indeed, it has been the best performing style factor, much to the chagrin of many “purist” factor-based investors who focus only on the original Fama-French framework of Size and Value factors. Question 1: Is Fundsmith a Momentum investor? What’s the right comparator? The Fundsmith Equity fund quite rightly uses MSCI World Index as a performance comparison on its factsheet. Comparisons against UK equity funds or indices would not be appropriate. In our research around factor-based investing, we thought it would be interesting to plot how the performance of a popular global equity fund like Fundsmith Equity fared against the various factor-based world equity indices. We were astonished to see that the overall performance was almost identical to the iShares EDGE MSCI World Momentum Factor UCITS ETF (the “Momentum ETF”) which tracks the MSCI World Momentum Factor index (the “Momentum Index”). Fig.1. Close call between Fundsmith & Momentum factor for trouncing MSCI World 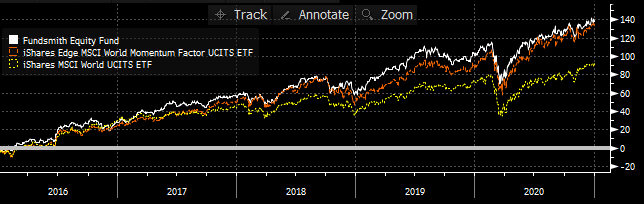 Source: Elston research, Bloomberg data. Total Return in GBP terms as at 31-Dec-20 Indeed, over the last 5 years from Dec-15 to Dec-20, Fundsmith has delivered a cumulative total return of +137.39%, compared to the Momentum ETF’s return of +132.77% and +90.23% for iShares MSCI World Equity ETF (the "World Equity ETF"). In annualised returns this translates to +18.85%, +18.39% and +13.71% respectively[1]. [1] As at 31st December 2020 To be clear, Fundsmith Equity is not managing the fund to this benchmark, so could argue it’s not an appropriate comparison, and technically, that’s right. But we thought nonetheless a comparative analysis would be informative, not least to show that Fundsmith-like returns were achievable with a Momentum-style investment approach. How about 2020 performance? In 2020, Momentum ETF returned +24.85% in GBP terms, compared to Fundsmith Equity’s +18.23% and the World Equity ETF +11.81%, possibly helped by its rebalancing in what very much a year of two halves.. Fig.2. Fundsmith vs Momentum in 2020 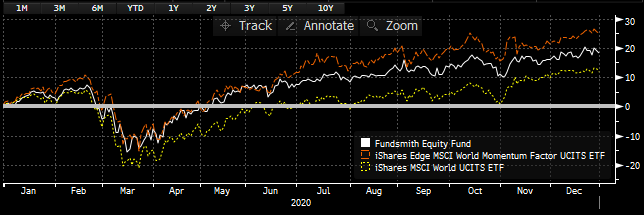 Factor investing: between active and passive? Factor-based index investing has sometimes been described as being somewhere between passive (cap-weighted index beta) investing and active (non-index) investing. Indeed factor-based investing became mainstream when Ang, Goetzmann and Schaefer (2009) conclude that the bulk of the apparent manager alpha within the Norwegian Sovereign Wealth Fund was explained by macro factors and style factors. Factors therefore explain a large part of the difference between market beta and active returns, that were previously attributed to manager alpha. In the chart below, we compare the annualised performance over 5 years of the world equity ETF (beta), the Momentum ETF (style factor) and the residual difference (Alpha) between Momentum and Fundsmith. Effectively we are using the Momentum ETF as a benchmark for Fundsmith’s style. Fig.3. Relative Return Comparison: Fundsmith Equity vs iShares EDGE MSCI World Momentum Factor ETF 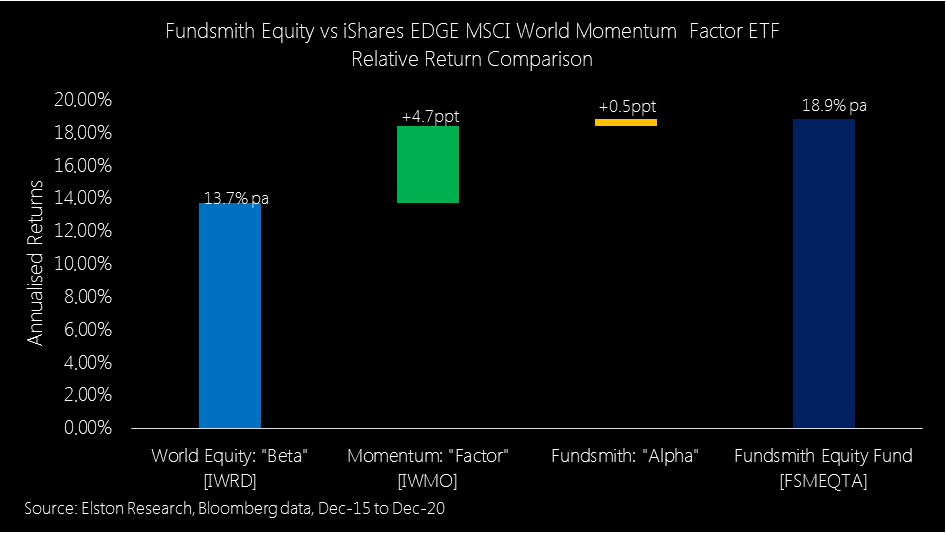 So for evaluating manager skill: which is the right benchmark? A) World Equities against which both Fundsmith Equity and a low cost Momentum ETF look great; or B) if Fundsmith is indeed a Momentum-style investor – a Momentum benchmark, against which Fundsmith has still outperformed – but only marginally? Applying a factor lens to active managers What we like about the Fundsmith Equity fund is that it is a “true active” fund using high conviction, and high concentration, and see it as a powerful addition to portfolios. Fundsmith describes his process as “Quality focused” and yet performance is very different to a Quality factor and almost identical to a Momentum factor. We are not saying that Fundsmith is not properly describing their investment process. We are just noting the outcome of its results and similarity to the Momentum factor. By applying this factor perspective to traditional active managers, we can see what factors those managers are knowingly or unknowingly allocating to, and hence to what extent their performance relates to a particular style factor. Both Fundsmith and Momentum Index have had a high concentration to Information Technology, Health Care and Consumer Staples. Fundsmith’s fund is not constrained and his more concentrated approach means that this sector concentration is even more extreme than the Momentum index. Naturally there is significant overlap in the underlying stock within both Fundsmith and the Momentum ETF, but with Fundsmith able to take larger security weights than a rules-based index. Question 2. Where and how has Fundsmith added value? Performance Attribution We ran an attribution analysis comparing the Fundsmith Equity fund to the Momentum ETF for the period from June 2016 to December 2019, a period where all look-through data is available. For this period, Fundsmith returned +75.76% outperforming the Momentum ETF which returned +69.48%. In terms of Total Returns, Fundsmith’s picks in the Information Technology sector delivered +145.22%, compared to Momentum ETF’s +156.32%, an underperformance of -11.1%. This was offset by Fundsmith’s picks in the Health Care sector which returned +77.66%, compared to +67.58% for the Momentum ETF. An outperformance of +10.08%. Fundsmith’s picks in the Consumer Staples sector generated +35.62%, compared to +35.12% for the Momentum ETF. After adjusting each sector for average weights, the large relative overweight in Information Technology – an advantage of a more concentrated approach – meant that technology was the largest relative contributor to overall return deliver 35.82ppt of the +75.76% return. Similarly, for Momentum, information technology delivered 26.5ppt of the +69.48% return. In summary for the time period under review Fundsmith has been excellent at sector selection. Good in stock selection within the Health Care sector was offset by poor stock selection in the Information Technology sector. Stock selection in the Consumer Staples sector added almost no value. Fig.4. Sector-level Contributions To Return 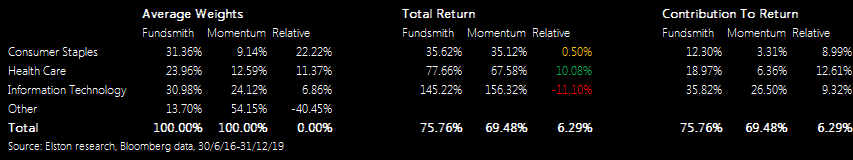 Taking this further into an attribution analysis, the conclusion is that Fundsmith added greatest value by selecting the best performing sectors, where share price momentum was greatest. There was moderate additional value from fund selection, and some detraction from currency effect. Fig.5. Attribution analysis 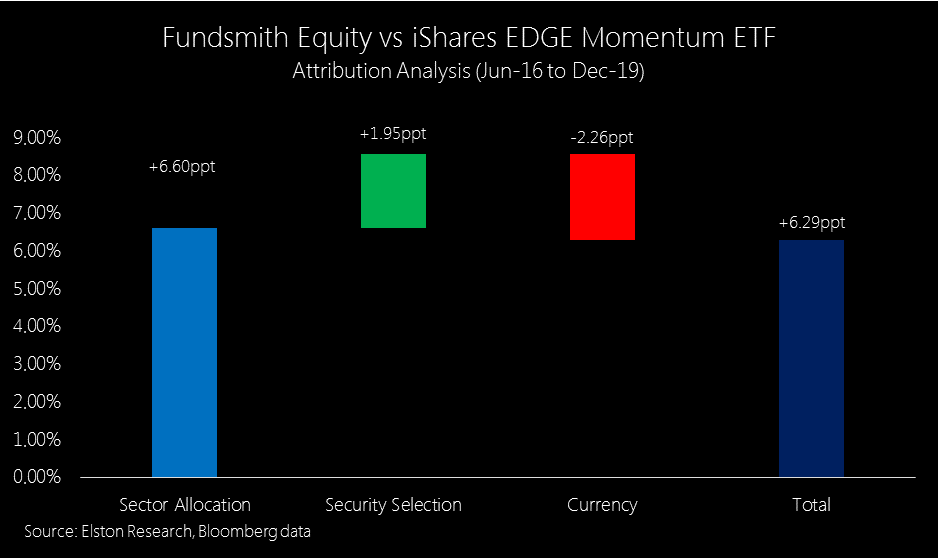 Holdings analysis We also looked at the average largest relative overweights for the Fundsmith Equity fund relative to the Momentum ETF, to look at security-level Contribution to Total Return. During the period under review, Paypal, Idexx and Amadeus were the largest contributors to returns. Fig.6. Security-level Contribution To Return 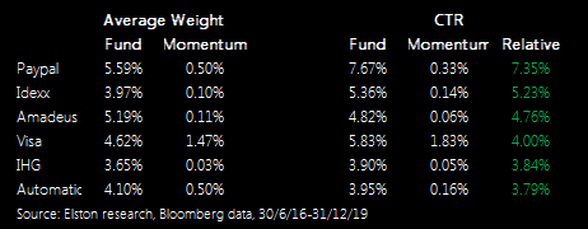 Fundsmith is “true active” because he is taking large absolute and relative bets relative to securities’ index weights be - that in a traditional cap-weighted index which is his benchmark, or in the Momentum factor-weighted index. which is not. Fundamentals Interestingly, looking at aggregate valuations, the overall Price Earnings Ratio (PER) for Fundsmith and for Momentum is not dissimilar, whilst Price Book Value (PBV) ratios – a traditional value metric – and debt levels were far higher for Fundsmith than Momentum. Fig.7. Valuation Comparison 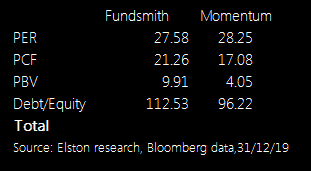 Question 3: Is Fundsmith Equity hugging the Momentum index? No. Not at all. As a far more concentrated portfolio there are high levels of active weights relative to the much more diverse Momentum Index. The correlation between the strategies from December 2015 to December 2020 is high at 84.3%, but not too high Fig.8. Top 5 relative weights 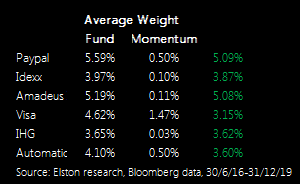 Question 4: Are Fundsmith-like returns replicable by lower cost index strategies?
The most interesting element of our analysis is this: usually when comparing actively managed funds, you can often find two strategies that take a similar approach, but have led to very different outcomes. In this case, comparing an actively managed fund with a Momentum index fund, we have two strategies that take a different approach, but reach a very similar outcome. This is consistent with the concept of factors being the underlying drivers of returns. Fundsmith is and remains a vindication of the potential value add of active management, and the ability to deliver returns well in excess of the market (cap-weighted) beta. As such, we expect advisers to continue to want to include Fundsmith as a core holding within their equity allocation. But we would note decompising returns to what is attributable to Factors provides additional insight. However, if the question is are those type of returns accessible using index funds, the answer is emphatically yes. An equal weight allocation across Consumer Staples, Health Care and Information Technology ETFs, or a single allocation to a Momentum ETF would have delivered similar returns to Fundsmith, but with TERs of 0.30% or so, instead of 0.95%. So if you are looking for growth, being fully allocated to equities, and backing "winning" business: then you can implement that approach with active funds like Fundsmith, or index exposures like Momentum. The holdings or “ingredients” might be different, but the factors or “nutrients” might be the similar. Similarities and Differences So, apart from the obvious, what are the similarities and differences between methodologies? Similarities
Summary Fundsmith’s performance is undeniably excellent. We would note that it is consistent with that of a Momentum-style investment strategy. Fundsmith’s “Alpha” can be measured not just against MSCI World, but against the MSCI World Momentum Index. Using the standard MSCI World as a comparator implies Fundsmith’s Alpha is a phenomenal 5.14ppt pa over the last 5 years. Using the MSCI World as a comparator implies Fundsmith’s Alpha is just 0.46ppt pa. Incorporating factor-based exposures as a hybrid on the spectrum between traditional cap-weighted passive, and true active, creates more options for portfolio managers looking to isolate and capture specific styles and exposures without having to materially increase either the risk budget or the fee budget. [1] MSCI factsheet as at December 2020 for last 12 months  [5 min read, open as pdf]
Tech performance is skewing cap-weighted indices The run up in technology stocks and the inclusion of Tesla into the S&P500 has increased both sector concentration and security concentration. The Top 10 has typically represented approximately 20% of the index, it now represents 27.4%. The chart below shows the Top 10 holdings weight over time. 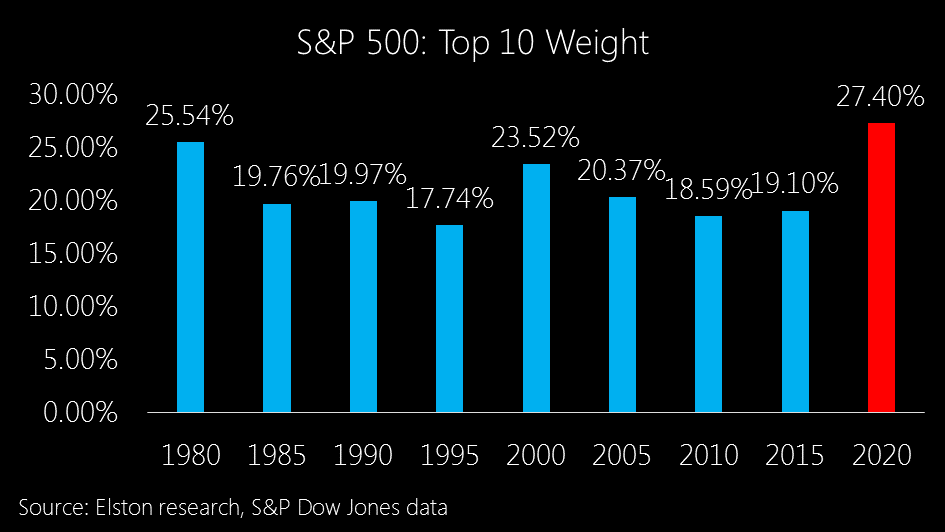 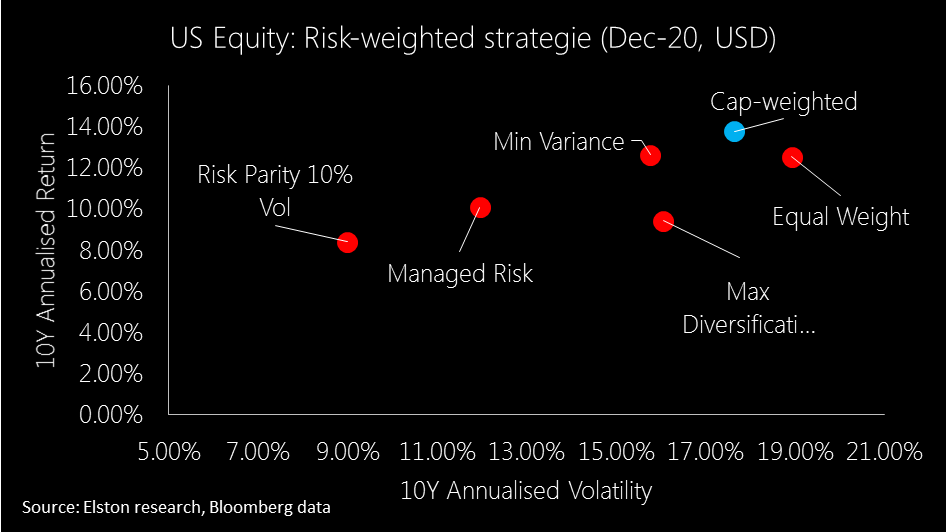 Rather than looking just at Risk vs Return, we also look at Beta vs Correlation to see to what extent each strategy has 1) not only reduced Beta relative to the market, but also 2) reduced Correlation (an indication of true diversification). Strategies with lower Correlation have greater diversification effect from a portfolio construction perspective. Ironically, the last time the index was anything close to being this concentrated was back in 1980 when IBM, AT&T and the big oil majors ruled the roost. From a sector perspective, as at end December 2020, Information Technology now makes up 27.6% of the index. Increased concentration reduces diversification This level of concentration is indeed skewing indices that rely on a traditional market capitalisation-weighted (cap-weighted) methodology, and does therefore reduce diversification. But the issue of the best performing stocks getting a larger weighting in the index, is not an accident of traditional index design. It’s its very core. Cap-weighted indices reflect the value placed on securities by investors, not the other way round. We should not therefore conflate the debate around “active vs passive” investment approaches, with the debate around index methodology. If portfolio managers are concerned about over-exposure to particular company or sector within a cap-weighted index, they can either chose an active, non-index fund, that is not a closet-tracker. Or they can access the target asset class through an alternatively weighted index, which uses a security weighting scheme other than market capitalisation. Using cap-weighted indices is an active choice The decision to use a fund that tracks an cap-weighted index is an active choice. And for those seeking differentiated exposure, there is a vast range of options available. We categorise these into 3 sub-groups: Style, Factor-based and Risk-based.
How have US equity risk-based strategies fared? Risk-based strategies have been in existence for some time, so we are able now to consider 10 year data (to December 2020, in USD terms). In terms of risk-adjusted performance, Managed Risk index strategies have fared best, whilst Min Variance has delivered higher returns for similar levels of risk of a Max Diversification strategy. Meanwhile Equal Weight has actually exhibited greater risk than traditional cap-weighted approach. 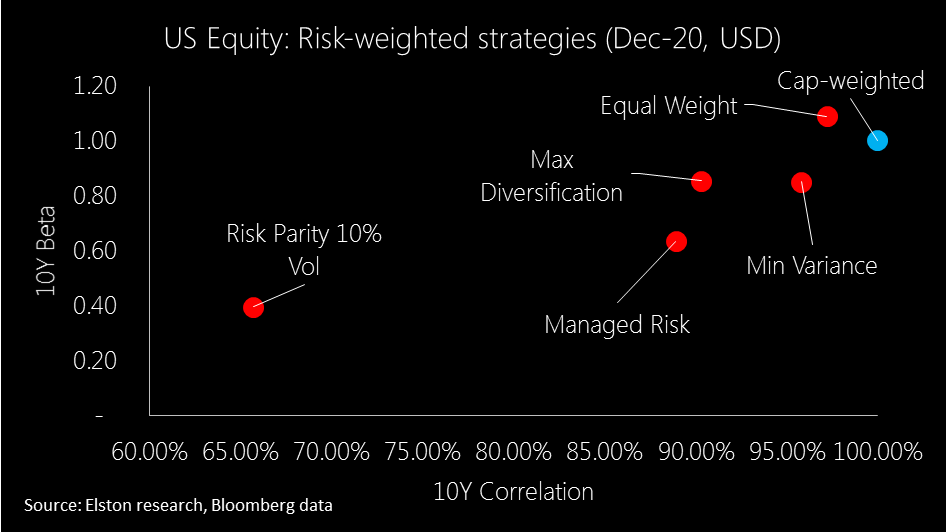 In this respect, Equal Weight (Max Deconcentration), also disappoints delivering higher beta and >95% correlation. Likewise Min Variance, whilst delivering on Beta reduction, does not deliver on decorrelation. Max Diversification delivers somewhat on decorrelating the strategy from the S&P500, but only modestly, whilst Managed Risk achieves similar decorrelation, reduced beta and better returns. Finally Risk Parity 10% Volatility cap has delivered most decorrelation as well as beta reduction.
For more information about the indices and funds used to represent these different strategies, please contact us. Summary There are a broad range of alternatives to cap-weighted index exposures. But consideration of style-, factor- or risk-based objectives will necessarily inform portfolio construction.
Find out more For more insights and information on research, portfolios and indices, visit: www.elstonsolutions.co.uk or NH ETF<Go>  [3 min read, open as pdf]
Growth shock is short and sharp The medium-term outlook for growth points more to a “short sharp shock” rather than a protracted downturn that followed the Global Financial Crisis. However vigilance around economic growth, and ongoing dependency on vaccine rollout, fiscal and monetary policy support remains key. Even lower for even longer interest rates Even lower for even longer interest rates underpins an accommodative strategy to support recovery: but also has created frothiness in some asset classes. Low nominal and negative real yields is forcing investors into refocusing income exposures, but should not lose sight of quality. Inflation in a bottle: for now Inflation caught between growths scare on the downside and supportive policy on the upside. Should inflation outlook increase, nominal bond yields will be under greater pressure and inflation-protective asset class – such as equities, gold infrastructure, and inflation-linked bonds can provide a partial hedge. Trade deal with EU should reduce GBP/USD volatility The 11th hour trade deal concluded in December between the UK and the EU should dampen the polarised behaviour of GBP exchange rate, with scope for moderate appreciation, absent a more severe UK growth shock. Market Indicators: recovery extended Market indicators suggest equities are heading into overbought territory and whilst supported by low rates and bottled inflation, are looking more vulnerable to any deterioration in outlook. Incorporating risk-based diversification that adapts to changing asset class correlations can provide ballast in this respect. 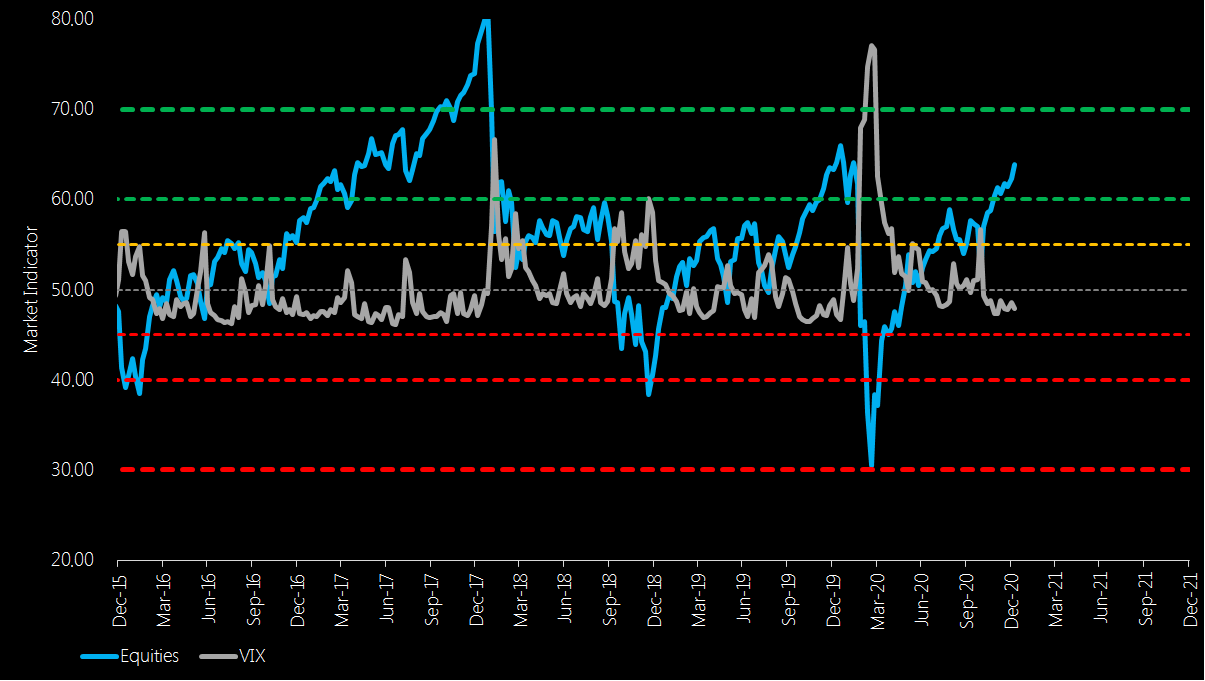 Summary
With respect to 2021 outlook
|
ELSTON RESEARCHinsights inform solutions Categories
All
Archives
July 2024
|
 RSS Feed
Company |
Solutions |
|