Elston
  • WHO WE ARE
    • About
    • Contact
    • Events
    • Press
  • WHAT WE DO
    • Portfolio Solutions >
      • Our Portfolios
      • Custom Portfolios
    • Fund Solutions >
      • Our Funds
      • Custom Funds
    • Index Solutions >
      • Our indices
      • Custom Indices
    • SPECIALIST STRATEGIES >
      • Money Market Funds
      • Retirement Income Solutions
      • Retirement Portfolios
      • Adaptive Portfolios
      • UK Equity Income
      • Multi-Asset Income
      • Liquid Real Assets
      • Dynamic Risk Parity
      • Gold and Precious Metals
      • Enabling Net Zero
    • Supporting Advisers >
      • Investment Committee Support
      • Regulatory Support
    • CPD
  • WHO WE HELP
    • Financial Advisers
    • Discretionary Managers
    • Fund Providers
  • Insights

Insights.

risk-based diversification to mitigate market shocks

10/3/2020

 
The impact of Coronavirus on multi-asset strategies is summarised below.  This chart shows the peak-to-trough and YTD performance of Global Equities and Elston's multi-asset indices for GBP investors.
Picture
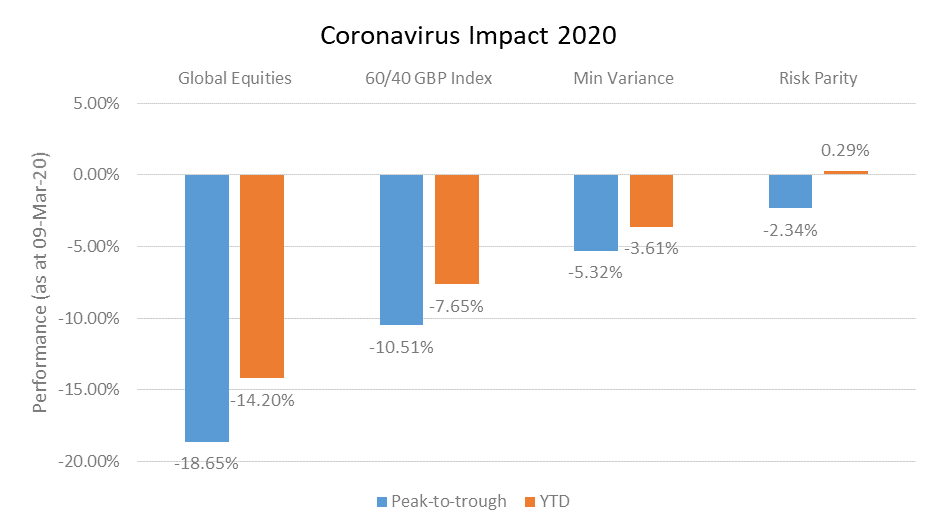
Asset-based diversification has its limits
Whilst a traditional asset-based approach to diversification can help reduce equity market beta, but it doesn't necessarily help reduce correlation.

Why does (de)correlation matter
The maths of diversification means that the less correlated an asset within a portoflio, the greater the diversification effect.

Comparing multi-asset approach
A 60/40 equity/bond portfolio (represented by 6040GBP Index), reflects a traditional multi-asset approach.  Year-to-date this strategy has a beta of 0.60x but a correlation of 98.9%.

By contrast, a risk-based approach to diversification not only reduces beta, but also reduces correlation.

A Minimum Variance multi-asset strategy (represented by ESBGMV Index) has a beta of 0.35x and a correlation of 88.0%.

A Risk Parity multi-asset strategy  (represented by ESBDRP Index) has a beta of 0.18x and a correlation of 58.7%.
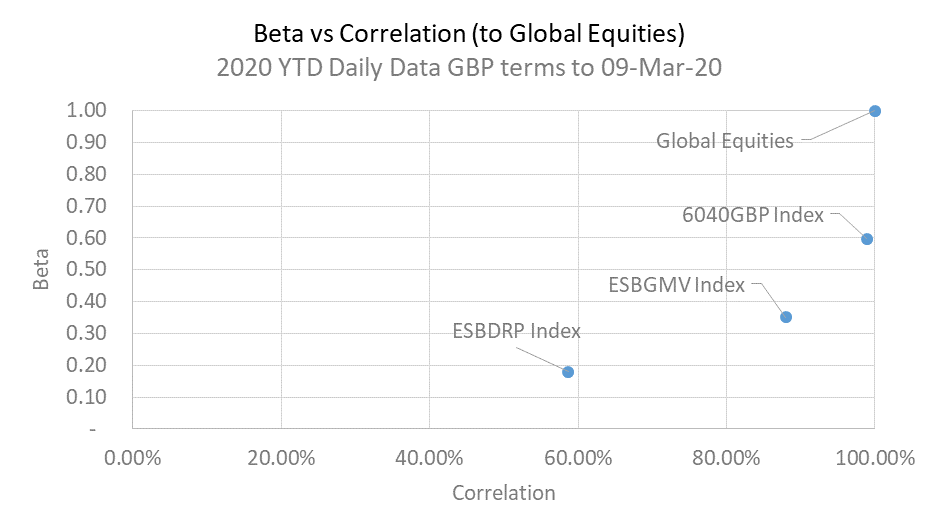
Picture
Summary
For effective risk-based diversification, whilst maintaining exposure to risk assets with returns potential, a risk-based approach to portfolio construction makes sense.

The coronavirus j-curve:  when is "peak panic"?

4/3/2020

 
A local problem?
​
In January, when the Coronavirus story broke in China, the global response was that this was a localised issue.

Like other viral outbreaks such as SARS (2003) and H1N1 (2009), the issue look localised to China and Asian Emerging Markets.

Going global
In February, as the virus spread aggressively in South Korea and Italy, markets woke up to the fact that this was a global issue.  The questions being how far would it spread; how fast would it spread; and how long would it last?

All of these questions were to ascertain how materially the outbreak would impact global growth, as demand falls, businesses' cash flow struggles and supply chains are disrupted.

A false sense of security
What was deceptive is that the time from the first infection in a country to the virus "j-curving" has been quite long 20-30 days.  This gave Europeans a false sense of security that the outbreak was containtable.

The J-Curve
The chart below shows the J-curve as to how long it has taken for some key countries to reach 1,000 cases.  The reality is that once it gets going, containment is difficult without some of the extreme measures introduced quite promptly in Wuhan (wide area quarantines or "lockdowns"), and more recently in Italy.
Picture
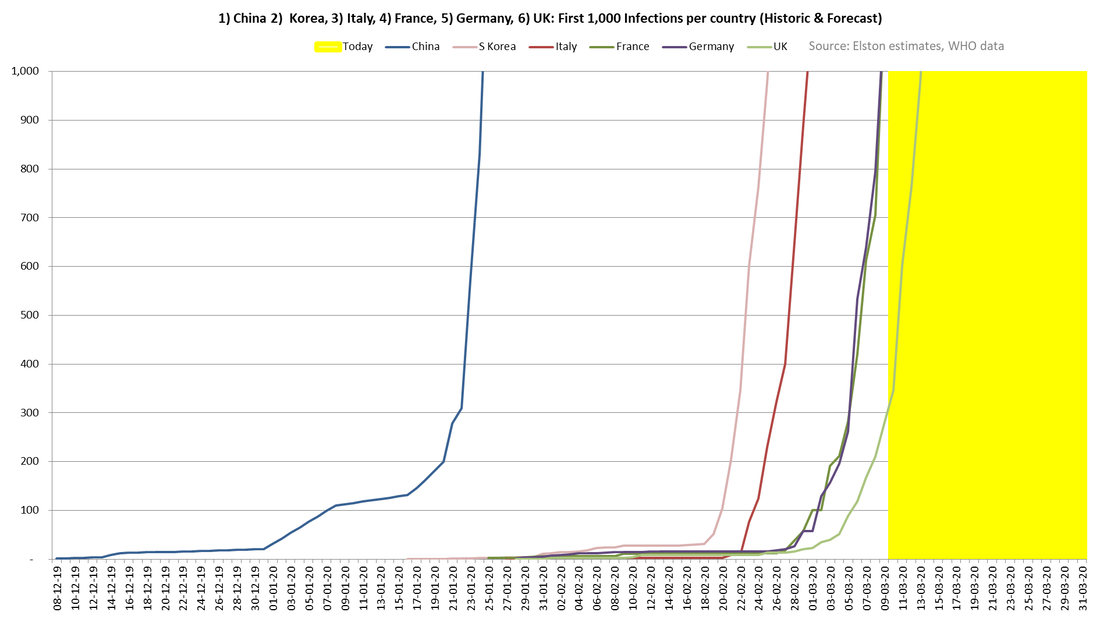
Tracking the J-curve gives helpful cues as to when the UK government might move through the different phases of its response plan to Contain, Delay, and Mitigate the virus' impact undperpinned by Research.

On this basis, whilst we are still in the Contain stage, we can expect to move into the Delay stage (closing schools, cancelling large scale gatherings, encouraging working from home) in coming weeks.

Economic impact and policy response
The economic impact of self-isolation, travel restrictions and lock-down are in addition to the human cost of the virus.  That is why we have seen, and expect to continue to see, a co-ordinated economic policy response that supports business, monetary policy and markets.

China plateau
Meanwhile, in China, where the outbreak started, case numbers have plateaued suggesting that the drastic measures taken have worked, and that it is in aggregate a 2-3 month disruption.
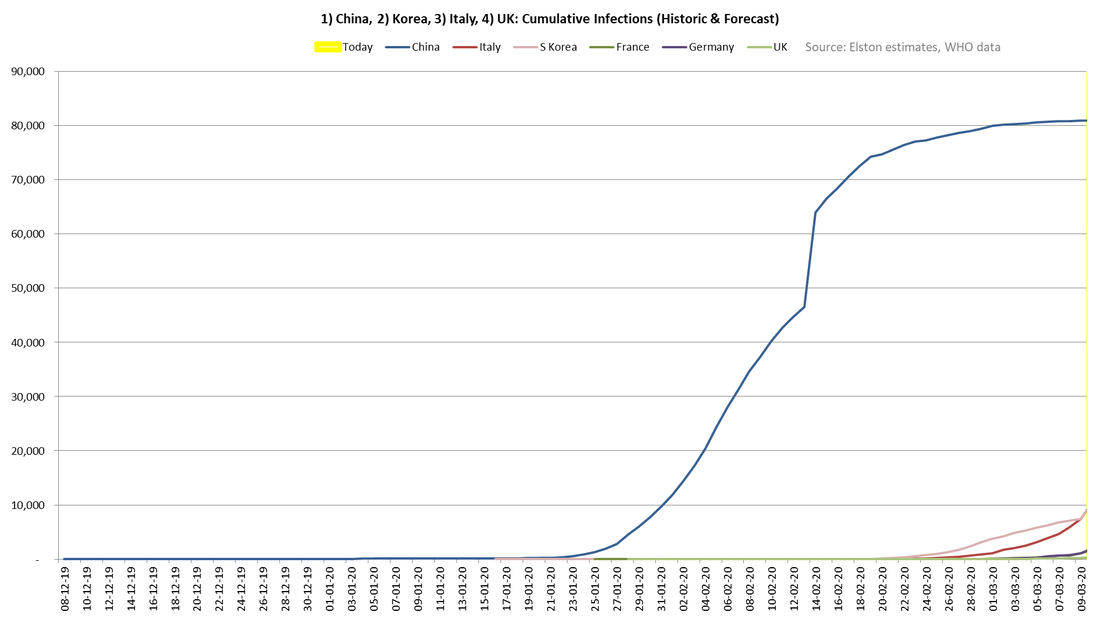
Picture
What next?
The next 4-6 weeks will see an acceleration in cases in key European and potentially US markets.  So we may not be at "peak panic" yet at a social level, but the key question for markets is will this be a short run (3-6) month impact on otherwise resilient trend growth, or a trigger to a global recession.  Our view is the former, but there's more fear to come first.

    ELSTON RESEARCH

    insights inform solutions

    Get our weekly newsletter

    Categories

    All
    All Weather Portfolio
    Alternative Assets
    Alternative Strategies
    Bonds
    Business Practice
    Equity Income
    Equity Sectors
    ESG
    ETFs
    Evidence Based Investing
    Factor Investing
    Gold & Precious Metals
    Guide To Investing
    Index Investing
    Inflation
    Macro
    MULTI ASSET
    Multi Asset Income
    Net Zero
    Permanent Portfolio
    Portfolio Construction
    Private Markets
    Real Assets
    Retirement Investing
    Risk Parity
    Thematic Investing
    Value Factor

    Archives

    October 2023
    September 2023
    August 2023
    July 2023
    June 2023
    May 2023
    April 2023
    March 2023
    February 2023
    January 2023
    December 2022
    November 2022
    October 2022
    September 2022
    August 2022
    July 2022
    June 2022
    May 2022
    April 2022
    March 2022
    February 2022
    January 2022
    December 2021
    November 2021
    October 2021
    September 2021
    August 2021
    July 2021
    June 2021
    May 2021
    April 2021
    March 2021
    February 2021
    January 2021
    December 2020
    November 2020
    October 2020
    September 2020
    August 2020
    July 2020
    June 2020
    May 2020
    April 2020
    March 2020
    February 2020
    January 2020
    December 2019
    November 2019
    September 2019
    June 2019
    April 2019
    February 2019
    January 2019
    December 2018
    November 2018
    October 2018
    September 2018
    August 2018
    July 2018
    June 2018
    May 2018
    April 2018
    March 2018
    February 2018
    January 2018
    December 2017
    November 2017
    October 2017
    July 2017
    May 2017
    March 2017
    February 2017
    January 2017
    November 2016
    October 2016
    September 2016
    July 2016
    June 2016
    May 2016
    February 2016
    January 2016
    June 2015
    January 2014
    June 2012

    RSS Feed

Company

Home
About
Terms of Use
​​​Contact
​
​Events
​
Press

Solutions

​​Insights
​​​Research Service
​Research Library
Portfolio Analytics
​Our Portfolios
Custom Portfolios
​Retirement Portfolio
Our Funds
Custom Funds
​Retirement Funds
Our Indices
​Custom Indices
Retirement Indices

Services

CIRP Development
Regulatory Research
​
​​CPD

By client type:
For Advisers
For Discretionary Managers
​For Asset Managers
For Asset Owners


© COPYRIGHT 2012-23. ALL RIGHTS RESERVED.
  • WHO WE ARE
    • About
    • Contact
    • Events
    • Press
  • WHAT WE DO
    • Portfolio Solutions >
      • Our Portfolios
      • Custom Portfolios
    • Fund Solutions >
      • Our Funds
      • Custom Funds
    • Index Solutions >
      • Our indices
      • Custom Indices
    • SPECIALIST STRATEGIES >
      • Money Market Funds
      • Retirement Income Solutions
      • Retirement Portfolios
      • Adaptive Portfolios
      • UK Equity Income
      • Multi-Asset Income
      • Liquid Real Assets
      • Dynamic Risk Parity
      • Gold and Precious Metals
      • Enabling Net Zero
    • Supporting Advisers >
      • Investment Committee Support
      • Regulatory Support
    • CPD
  • WHO WE HELP
    • Financial Advisers
    • Discretionary Managers
    • Fund Providers
  • Insights