
 One of the biggest attractions of having a broadly passive investment strategy is the simplicity of it. You don’t have to speculate on particular sectors or regions or constantly monitor how your portfolio is performing. The long-term market return is more than adequate to meet the need of most investors, and by simply aiming to capture that return at very low cost, you’re giving yourself every chance of a successful outcome.
Index funds themselves are beautifully simple, and so too are passively managed exchange-traded funds, or ETFs. You know exactly what you’re getting with them. But when you buy an actively managed fund you’re next quite sure. Many active equity funds, for example, include an element of bonds, cash or both, and because active managers typically turn over their entire portfolio every couple of years or so, it’s very difficult to keep tabs on everything you own at any given time. A more worrying development in recent years is that, with active managers finding it increasingly hard to beat their benchmarks, they are resorting more and more to complex strategies. Principally, these strategies come in three different forms: Leverage — in other words, the fund manager borrows money to increase the potential return of an investment Short selling — that is, the manager sells a security that they don’t own, or that they have borrowed, in the hope that the the security’s price will decline, allowing them to buy it back at a lower price to make a profit Options -- in other words, the fund manager pays for the right to buy or sell a security at an agreed price at a later date They’re often called hedging strategies; that is, they’re ostensibly designed to protect investors from risk. In practice, though, they often have the opposite effect; all three types of strategy carry a degree of risk that the end investor may not want to take. Worryingly, recent research from Canada has confirmed that active managers are making increasing use of these complex strategies, resulting in higher fees, lower returns and greater risk. The paper in question, entitled Use of Leverage, Short Sales and Options by Mutual Funds, was produced by three academics at the Smith School of Business at Queen’s University in Ontario. According to the authors — Paul Calluzzo, Fabio Moneta and Selim Topaloglu — in the 15 years prior to the paper’s publication in March 2017, 42.5% of US domestic stock funds have used leverage, short sales or options at least once. Between 1999 and 2015, the percentage of funds allowed to use all three rose from 25.7% to 62.6%. But, the researchers found, there was a price to pay for end investors for this additional complexity. Funds that used complex investments, they calculated, had a 0.59% decrease in excess return and a 0.072% increase in expenses. So, what did the researchers find specifically on risk? To quote the paper: "Although (managers) use the instruments in a manner that decreases the fund's systematic risk, they hold portfolios of riskier stocks that offset the insurance capabilities of the complex instruments. “We find not only that funds that use complex instruments take more risk, both systematic and idiosyncratic, in their equity positions, but also that bylaws that authorise complex instrument use are associated with greater fund risk.” In the paper’s conclusion the authors say this: “Our results suggest that the use of complex instruments is associated with outcomes that harm shareholders: lower returns, higher unsystematic risk, more negative skewness, greater kurtosis (essentially volatility) and higher fees. “Overall, it appears that mutual fund investors are better off choosing simplicity.” So, why is it that active managers are using these complex strategies more and more? The bottom line is that regulators have allowed them to. But you could also argue that one reason active managers are resorting to using them is that they’re increasingly under pressure to prove that they can beat the index. Put another way, active managers are becoming increasingly desperate. To quote the investment author Larry Swedroe: “The active world has to fight back to keep their share, and one way to do that is to add complexity. They need to say, ‘We have a story to tell, and you need to be a member of our secret club, which has all theses superior instruments.’” Investors should not be seduced by these sorts of marketing messages. In investing, simplicity is the ultimate sophistication, and ideally that means avoiding actively managed funds altogether.
What are CoCos? Following the 2008 financial crisis, banks had difficulty issuing traditional debt securities, and had to sit on a large amount of capital to ensure their balance sheet strength was maintained. CoCos were created as the issuing banks flexible friend. This is because are designed to absorb losses when the balance sheet of the issuing banks weakens below a threshold level. Losses can be absorbed by the CoCo converting into equity or suffering a write-down of its principal value making it more flexible than traditional bank securities. To offset the risk of loss, CoCos are issued with a higher coupon than traditional bank bonds. Accessing CoCos Whilst bond funds may include CoCos, direct access to CoCos as a targeted allocation was previously only available to institutions who could meet minimum issuance sizes from one or more issuer. By accessing CoCos using an ETF, the minimum investment drops to $100, and the ETF is diversified across 29 CoCos from 24 different issuers. Why include CoCos in a portfolio? Convertibility into the issuing bank’s shares means that CoCos provide an exposure that has both bond and equity-like characteristics. When there is higher risk of balance sheet stress, CoCo's behave more like equities. When there is lower risk of balance sheet stress, CoCo’s behave more like bonds. CoCos' moderate correlation to equities and low correlation to Corporate and Government Bonds makes them a useful diversifier from a portfolio construction perspective. Fig.1. Correlations to major asset classes 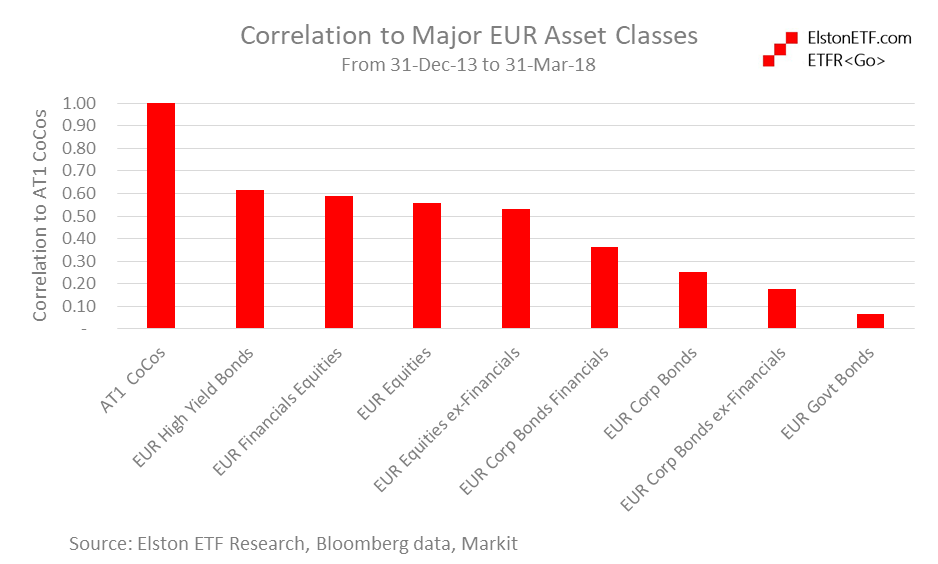 Bigger income & better credit quality CoCos have an attractive income to reward risk taken, but a better quality credit rating compared to traditional High Yield Bonds. Fig.2. Income Profile 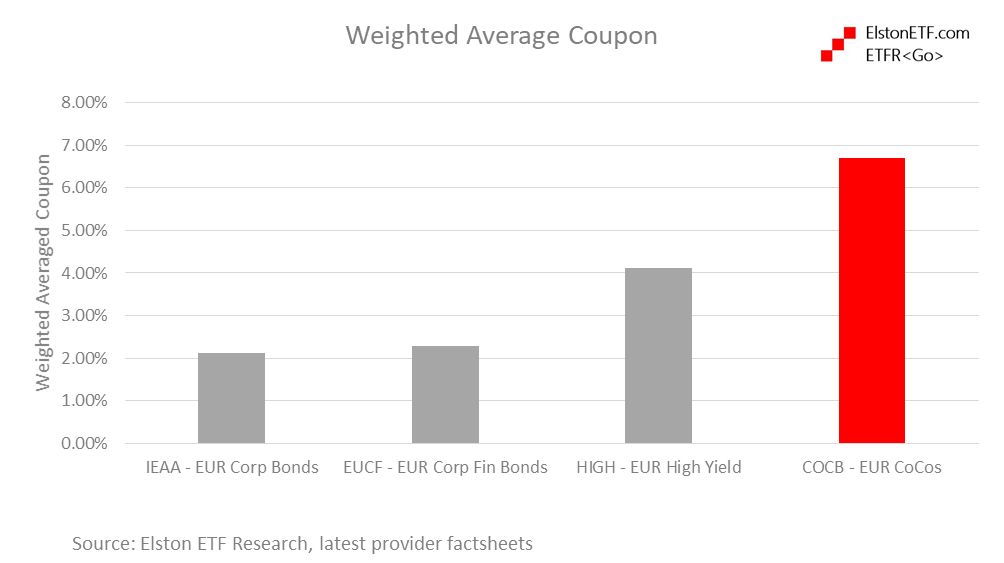 Fig.3. Credit Profile 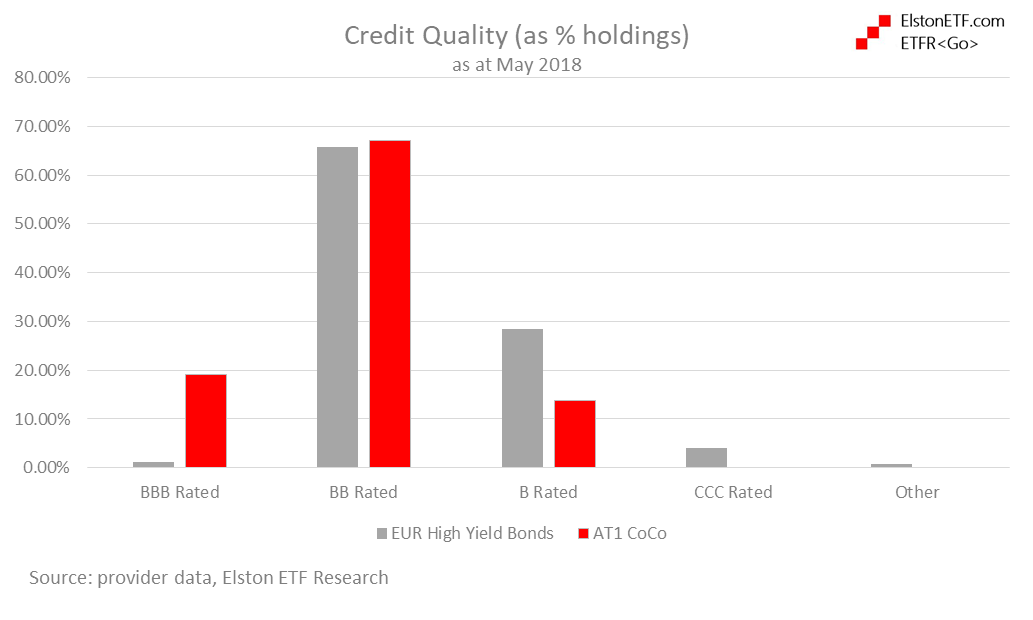 Furthermore, in terms of counterparty risk, CoCos are only issued by large banks that are well regulated with high capital ratios. How about performance? CoCos have outperformed EUR bonds and equities, both excluding and including Financials exposure. Fig.4. Total Returns 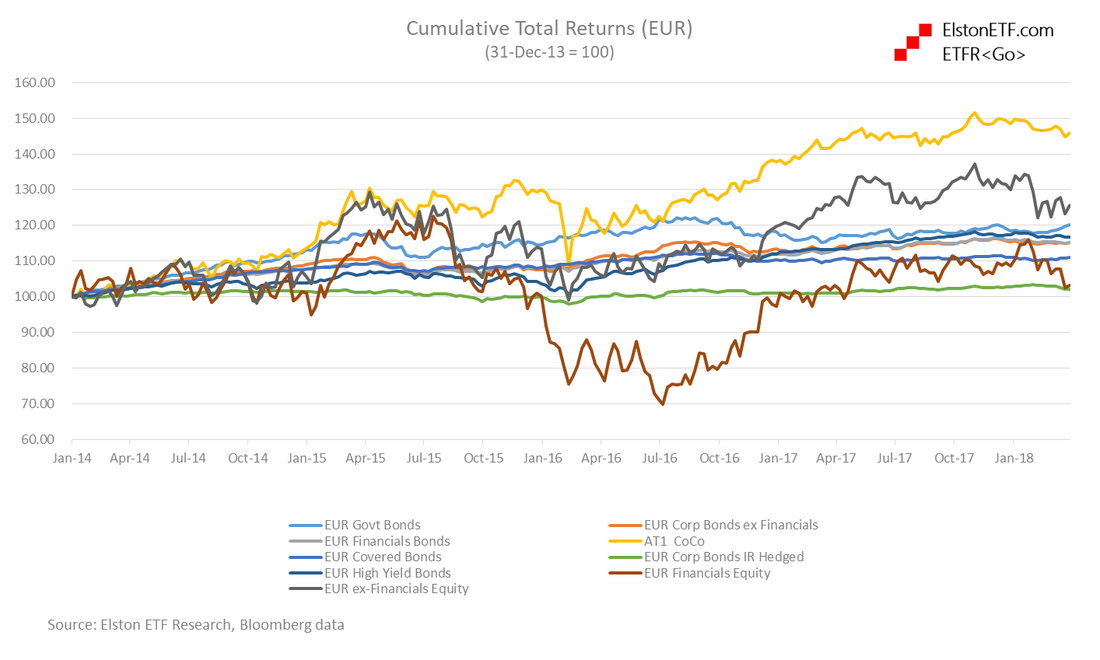 CoCos are positioned between equities and bonds in respect of realised volatility, but with better risk-adjusted returns. Fig.5. Risk-Return 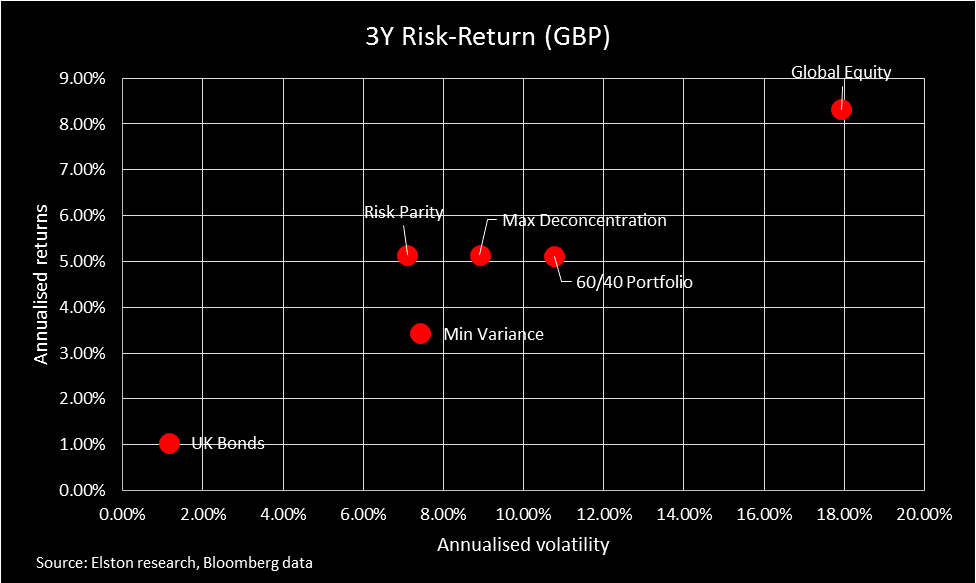 In summary, CoCos have offered solid risk-adjusted returns (Sharpe Ratio), and have a low correlation to bonds from a diversification perspective and a higher income with better credit quality relative to traditional high yield bonds.
 CAPM 1Q18 SNAPSHOT (GBP)
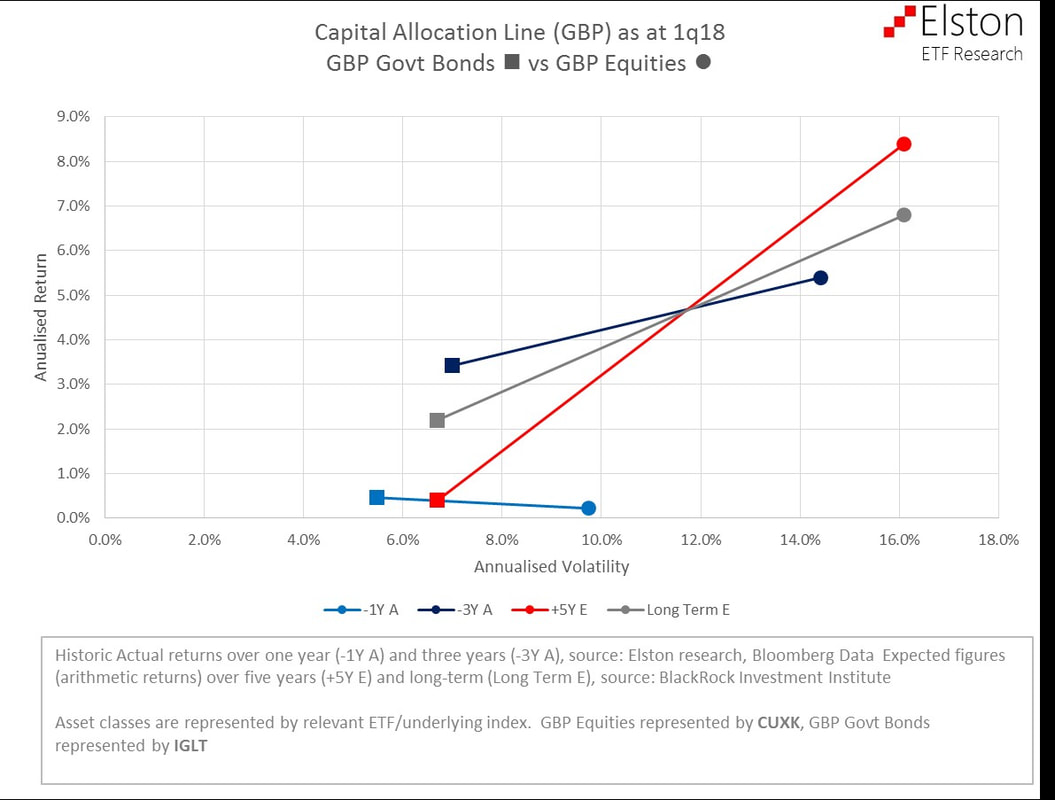
The Capital Allocation Line is the line that links the risk-free asset with the market portfolio. For GBP-based investors, we use UK Government Bonds as a proxy for the risk-free asset, and UK Equities as a proxy for the market portfolio. For 5 year, and Long-term, expected risk/return of these asset classes we use estimates from BlackRock Investment Institute. As expected, the CAL is upwards sloping: the higher the expected risk, the higher the expected return. For comparison, we superimpose on to those estimates, a snapshot of the historic 1 year and 3 year actual risk/return of these asset classes based on the performance of their respective ETFs. This gives an informative snapshot over capital market performance and outlook for GBP-based investors. 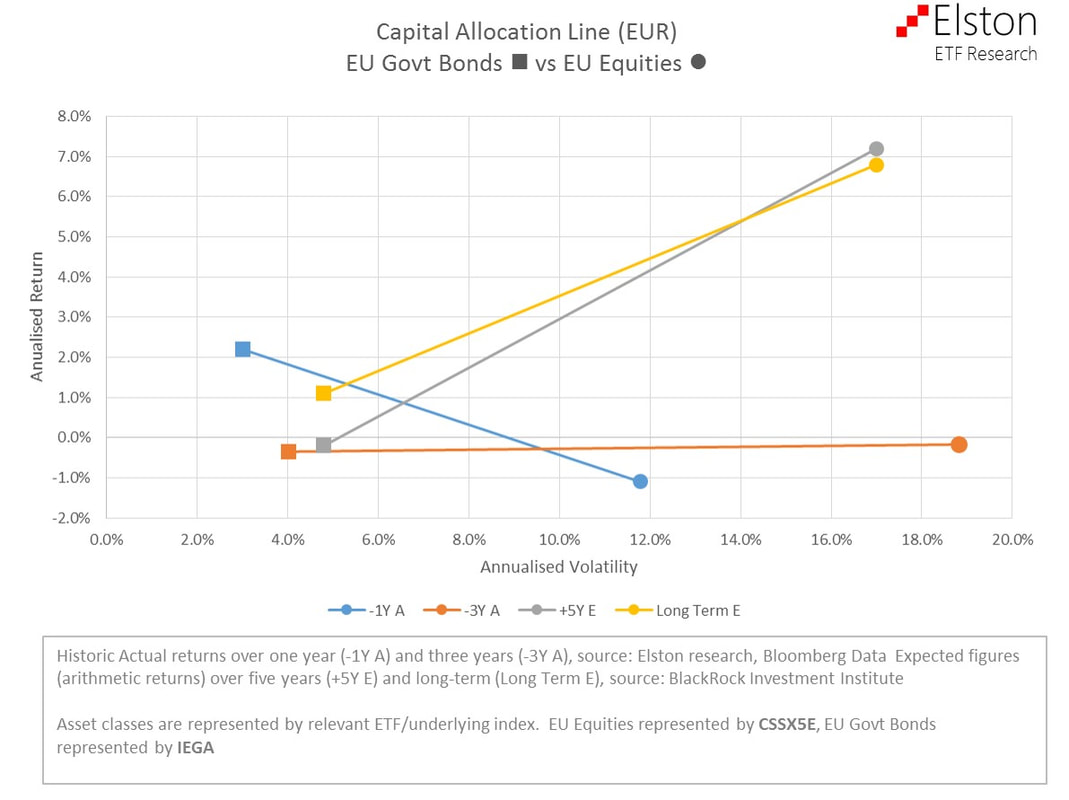 CAPM Snapshot 1q18
The Capital Allocation Line is the line that links the risk-free asset with the market portfolio. For EUR-based investors, we use Eurozone Government Bonds as a proxy for the risk-free asset, and Eurozone Large Cap Equities as a proxy for the market portfolio. For 5 year, and Long-term, expected risk/return of these asset classes we use estimates from BlackRock Investment Institute. As expected, the CAL is upwards sloping: the higher the expected risk, the higher the expected return. For comparison, we superimpose on to those estimates, a snapshot of the historic 1 year and 3 year actual risk/return of these asset classes based on the performance of their respective ETFs. This gives an informative snapshot over capital market performance and outlook for Euro-based investors. Proud to be supporting Young Money for financial education as part of Lord Mayor's Appeal and City Giving Day because financial education enables diversity.  |
ELSTON RESEARCHinsights inform solutions Categories
All
Archives
July 2024
|
 RSS Feed
Company |
Solutions |
|