
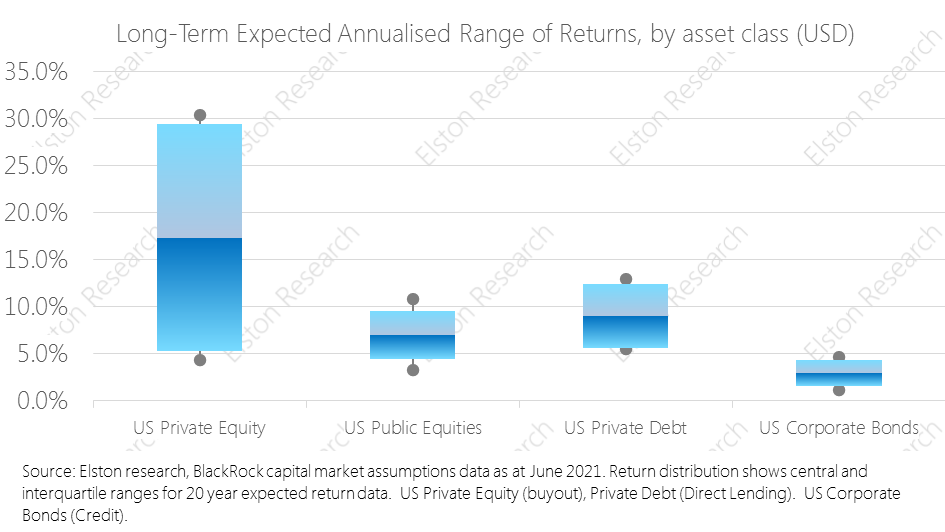
 The illiquidity premium is the additional rewarded risk associated with holding an illiquid investment.
One of the attractions of private markets relative to public markets is the trade-off between enhanced returns and reduced liquidity, known as the “illiquidity premium”. Private market deals often require investors’ money to be “locked up” (i.e. non-realisable and cannot be withdrawn) for anything up to ten years. By way of compensation, investors’ should enjoy potentially much higher rates of return. In the chart, we contrast the long-term expected returns, and range of returns, for US private equity vs a proxy for public equity and US private debt vs a proxy for US corporate bonds. Whilst the potential for returns is clearly higher, the range of potential outcomes is much higher too, reflecting the higher risk-reward trade off. Contrasting public market and private market expected & variability of returns reflects their different characteristics, risks and opportunities. Request our Access to Private Markets white paper Register for our Introduction to Private Markets webinar 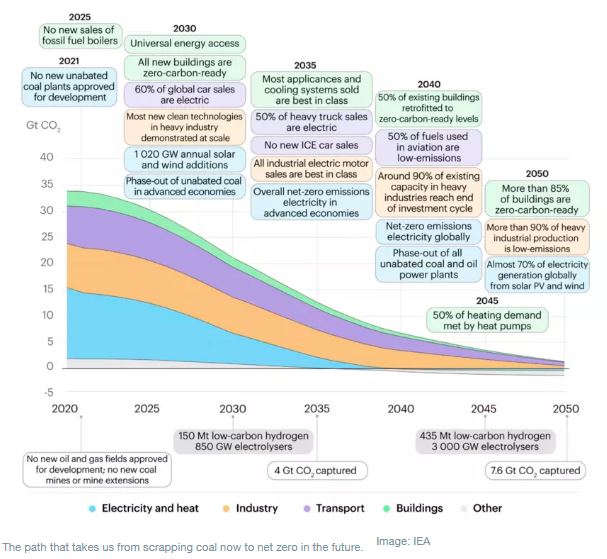 [7 min read, Open as pdf]
“A code red for humanity. The alarm bells are deafening and the evidence is irrefutable.” UN Secretary General Antonio Guterres discussing the most recent Inter-Governmental Panel on Climate Change (IPCC) report published in August 2021. For advisers looking to incorporate a Net Zero approach into a client portfolio, where ESG preferences are high, we would advocate a three-step approach. 1.Understand the Carbon footprint of your existing portfolio 2.Consider how substitutions of traditional with ESG-screened funds could reduce that Carbon footprint 3.Consider whether, and to what extent, an allocation towards climate solutions, which by their nature may be higher risk investments, will actively contribute to achieving the path to net zero. A bias towards ESG and a moderate investment in climate solutions, can help achieve those objectives for those clients who seek climate-oriented values in their investment portfolio, as well as their day-to-day living, For full article, Open as pdf 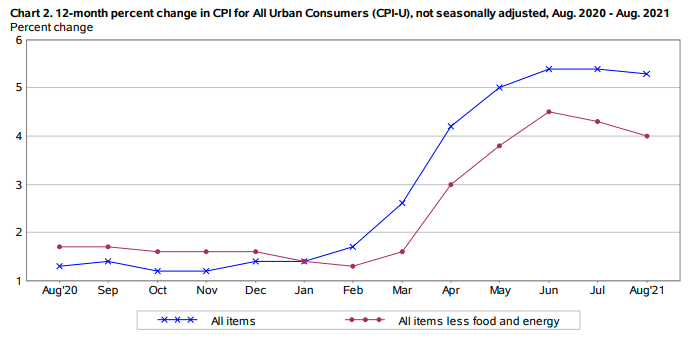 [3 min read, open as pdf]
US inflation moderates US CPI moderated from +5.4% to +5.3% y/y, whilst Core PCI (excluding energy and food) moderated from +4.3%yy to +4.0%yy. Full article in pdf 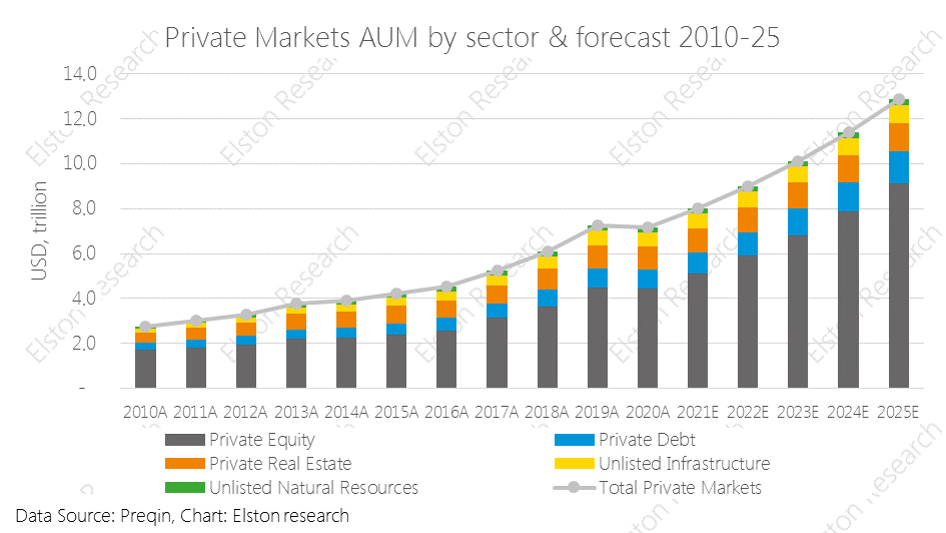 [3 min read]
Private markets exposure is growing in terms of both assets and popularity and offers potential for “true active” returns. We explore why and how advisers get access to this trend. Why private markets are in demand Private markets – incorporating private equity, private debt (direct lending), private real estate, unlisted infrastructure, unlisted natural resources – are characterised by attributes traditionally at odds with retail investing. Opacity, illiquidity, lengthy lock-up periods to name a few, and for that reason have largely been the domain of the institutional investor. But the growth in volume of private market strategies has become hard to ignore, as have the increasingly eye-watering returns enjoyed by private market managers. Overall private market AUM has increased from US$2.7tr in 2010 to US$7.2tr in 2020 and is expected to grow to US$12.9tr by 2025[1], with the majority of this in private equity. How can advisers access private market trends for their clients? In our white paper, we explore:
Request our Access to Private Markets white paper Register for our Introduction to Private Markets webinar [1] Preqin estimates, 2021  [3 min read, open as pdf]
The active vs passive debate is nothing new: the first index fund was launched in 1976 to track the S&P 500. In 1991, Nobel prize winner, William Sharpe (of Sharpe ratio fame), wrote a paper on “The Arithmetic of Active” setting out some of the clichés articulated by active managers, and why, in his view, it’s a zero sum game. Definition terms is key Whenever the active vs passive debate kicks off it’s always important to define terms. If referring to an asset allocation process, we prefer the terms static and dynamic and that’s got nothing to do with the subject of this paper or the claims by index investors that “active” is a zero sum game. Nor does the “activeness” or otherwise of hedge funds. The zero-sum game allegation relates to security selection, typically in a long-only context and therefore most relevant to managers of portfolios of securities and/or retail funds. What the Sharpe paper says Broadly speaking the Sharpe paper argues that in a closed world of active managers (stock pickers within an asset class), where the opportunity set is the index, for every “star” manager buying and holding the best performing stocks, there is a “dog” manager to whom the worst performing stocks have been sold. In aggregate, over time, this means the combined performance of both managers is the same as the index less active fees. This makes it hard for active managers to persistently outperform the index over time, which is evidenced by the SPIVA study. On this basis, using a fund that delivers performance of the index less passive fees seems like a more efficient way to gain exposure to that opportunity set. What are the implications for fund pickers The SPIVA study shows that the ability of active managers to outperform an index persistently varies from market to market depending on the efficiency of that market. For example, US and Global Equity markets fewer managers manage to outperform. For UK and Emerging Markets, active managers achieve better results. The latest SPIVA scorecard can be found here. We are not against “true active”, but the “arithmetic” is stacked against traditional long-only retail managers when it comes to persistency of alpha. Incorporating an index based approach where markets are highly efficient, and or where the availability of “true active” managers is rare. How to identify “true active” is a topic for another day! |
ELSTON RESEARCHinsights inform solutions Categories
All
Archives
July 2024
|
 RSS Feed
Company |
Solutions |
|