Markets don't stand still. Should portfolios?
We explore two apparently opposing schools of thought. Read the full article in FT Adviser
[3 min read, open as pdf]
[5 min read, open as pdf]
Some 18 year olds will have their Child Trust Fund maturing. Depending on how their parents had invested it, that could mean a lot or a little start to adult life. Our Head of Research, Henry Cobbe, provides some suggestions as regards next steps for an 18 year old with £29,000 to invest First of all – I’m sure you’ve done a big thank you to your parents for having set up, and topped up your CTF to grow it thus far! Everyone had the same starting point with CTFs, but it’s the decisions that your parents made that has determined your portfolio thus far. You should ask your parents’ adviser to help you get started, but if you really want to manage your own portfolio for now, rather than take advice, I would encourage you to make a straightforward three-step plan. 1. Choose your platform Firstly, decide on a platform. Interactive Investor’s flat-fee account is great for much larger pots, but your pot size means it’s much of a muchness between them and the other well-capitalised providers like Fidelity, AJ Bell and Hargreaves Lansdown. For a detailed analysis of platform fees, take a look at comparefundplatforms.com Using their tool, and assuming £29,000 lump sum ISA, £50 per month top up into 2 funds and no switches (buy and hold!), a like for like comparison suggests Interactive Investor 0.32% annual fees, AJBell 0.35%, Fidelity 0.35% and Hargreaves Lansdown 0.45%. Take a look at each website, decide which you find to be most helpful, and easiest to navigate. Customer service is important too, so try calling their helpdesks and see you find most helpful! 2. Choose your funds Secondly, decide on which funds, if you have a specific amount that you would ear-mark for the property deposit, and you expect that it’s in ten years’ time, you could consider using a target date fund, like Vanguard Target Retirement 2030 Fund Acc (0.24% OCF) or Vanguard Target Retirement 2035 Fund Acc (0.24% OCF) for that portion and ear mark that as your “deposit pot”. This means that as you get towards the target date, the investment strategy becomes less risky. That way the pot earmarked for your deposit is less exposed to a market shock if there is one in the run-up to you wanting withdraw funds for your deposit. For the remainder of your pot, as you’re lucky enough to have youth on your side, you have what’s called high “capacity for risk” in economic terms (not related to your behavioural/emotional “attitude to risk”), so can afford to take risk for long-term investments as the necessary flipside of returns. So for the remainder have a look at low cost global equity index funds such as:
3. Keep topping up Finally – and most importantly – heed the words of Warren Buffet in his advice to retail investors: “keep topping up through thick and thin, and especially through the thin”. The minimum fund subscription is £25 per month, so set up a regular investment plan into your chosen funds. The power of tax-free compounding is a marvel to behold. If markets have a wobble and you have spare cash, that can be a great time to top up with whatever you can afford. Lump sum or phased in? Markets are quite volatile at the moment so once you’ve got the money into your ISA, make a plan to invest into your chosen funds proportionally in say three or four stages over the rest of the year. That way you are “averaging in” to the market, rather than either getting very lucky (buying at a market low), or very unlucky (buying at a market high). Whilst in the long-run (say 30 years) it won’t matter (according to academia), it does make a difference to how you feel about taking the plunge, and can help remove a lot of worry. Set a date for review Make a plan as to when you will check in to your account – monthly, quarterly or annually. You would also need to rethink your strategy if your situation changes, or if your goals change. Whilst young and care-free you are probably right in your analysis that you may not need an adviser at this stage. But also put a date in your diary to speak to one when you’re any or all of 30, in a marriage/civil partnership, or starting a family. A good financial planner will review your situation and make sure that you have all the right things in place: mortgage, will, insurance, consolidated pensions, making the most of tax allowances and a broader plan to achieve your medium and long-term financial goals, whilst squaring off key financial risks. Good luck with the start of your investing journey! Notice: Not a personal recommendation. No assessment of suitability. Personal opinions expressed do not reflect the views of the author’s employer. Self-directed investors should read the terms and conditions and risk warnings of their selected platform, together with the KIID of any fund they select. [5 min read, open as pdf]
In our 2022 outlook, we explained why inflation will remain hotter for longer and will settle above pre-pandemic levels. Advisers should consider how to adapt portfolios for inflation across each asset class – equities, bonds and alternatives. Research demonstrates how different asset classes exhibit different degrees of inflation protection over different time-frames. Equities therefore provide a long-term inflation hedge.
In this article, we explore how to adapt portfolios for inflation within and across each asset class: Equities, Bonds and Alternatives. For full article, read as pdf [Open as pdf]
Money market funds, and their exchange-traded equivalents “ultra-short duration bond funds”, are an important, if unglamorous, tool in portfolio manager’s toolkit. They can be used in place of a cash holding for additional yield, without compromising on risk, liquidity or cost. Money market funds are intended to preserve capital and provide returns similar to those available on the wholesale money markets (e.g. the SONIA rate that replace LIBOR). How risky is a money market fund? Money market-type funds hold near-to maturity investment grade paper. Their weighted average term to maturity is <1 year. They therefore have very low effective duration (the sensitivity to changes in interest rates). Compare gilts which are seen as a low-risk asset relative to equities. The 10-11 year duration on UK gilts (all maturities) means they carry a higher level volatility compared to cash (which has nil volatility). On the flip side, their longer term also means they have higher risk-return potential relative to cash and ultra-short bonds. By contrast, money market type funds have some investment risk as they hold non-cash assets, but given their holdings’ investment grade status, short term to maturity and ultra-short effective duration, they exhibit near-nil volatility. Platform cash, fixed term deposit or money market fund From a flexibility perspective and a value for money perspective, there's a clear rationale to hold money market funds, rather than platform cash or a fixed term deposit. Our Money Markets fund research paper that looks at 4 low cost money market funds sets out why Why does the fund structure make sense? Find out more in our CPD Webinar on Introduction to Collective Investment Schemes [3 min read, open as pdf]
The active vs passive debate is nothing new: the first index fund was launched in 1976 to track the S&P 500. In 1991, Nobel prize winner, William Sharpe (of Sharpe ratio fame), wrote a paper on “The Arithmetic of Active” setting out some of the clichés articulated by active managers, and why, in his view, it’s a zero sum game. Definition terms is key Whenever the active vs passive debate kicks off it’s always important to define terms. If referring to an asset allocation process, we prefer the terms static and dynamic and that’s got nothing to do with the subject of this paper or the claims by index investors that “active” is a zero sum game. Nor does the “activeness” or otherwise of hedge funds. The zero-sum game allegation relates to security selection, typically in a long-only context and therefore most relevant to managers of portfolios of securities and/or retail funds. What the Sharpe paper says Broadly speaking the Sharpe paper argues that in a closed world of active managers (stock pickers within an asset class), where the opportunity set is the index, for every “star” manager buying and holding the best performing stocks, there is a “dog” manager to whom the worst performing stocks have been sold. In aggregate, over time, this means the combined performance of both managers is the same as the index less active fees. This makes it hard for active managers to persistently outperform the index over time, which is evidenced by the SPIVA study. On this basis, using a fund that delivers performance of the index less passive fees seems like a more efficient way to gain exposure to that opportunity set. What are the implications for fund pickers The SPIVA study shows that the ability of active managers to outperform an index persistently varies from market to market depending on the efficiency of that market. For example, US and Global Equity markets fewer managers manage to outperform. For UK and Emerging Markets, active managers achieve better results. The latest SPIVA scorecard can be found here. We are not against “true active”, but the “arithmetic” is stacked against traditional long-only retail managers when it comes to persistency of alpha. Incorporating an index based approach where markets are highly efficient, and or where the availability of “true active” managers is rare. How to identify “true active” is a topic for another day!
[3 min read, open as pdf] [ 5 min read, open as pdf]
Since an article published in 2019 pointed the historic lows in bond yields, many investment firms are starting to rethink the 60/40 portfolio. This came under even more scrutiny following the market turmoil of 2020. While some affirm that the 60/40 will outlive us all, others argue against this notion. We take a look at the main arguments for and against and key insights What is a 60/40 portfolio? A 60/40 equity/bond portfolio is a heuristic “rule of thumb” approach considered to be a proxy for the optimal allocation between equities and bonds. Conventionally equities were for growth and bonds were for ballast. The composition of a 60/40 portfolio might vary depending on the base currency and opportunity set of the investor/manager. Defining terms is therefore key. We summarise a range of potential definitions of terms: 
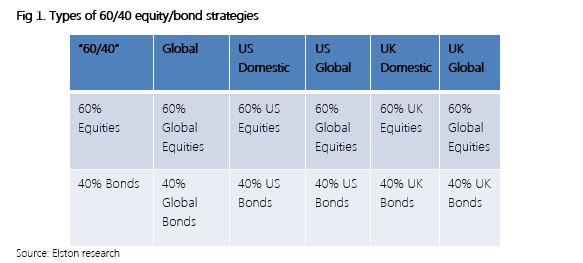
Furthermore, whilst 60/40 seems simple in terms of asset weighting scheme, it is important to understand the inherent risk characteristics that this simple allocation creates. For example, a UK Global 60/40 portfolio has 62% beta to Global Equities; equities contribute approximately 84% of total risk, and a 60/40 portfolio is approximately 98% correlated to Global Equities[1]. [1] Elston research, Bloomberg data. Risk Contribution based on Elston 60/40 GBP Index weighted average contribution to summed 1 Year Value At Risk 95% Confidence as at Dec-20. Beta Correlation to Global Equities based on 5 year correlation of Elston 60/40 GBP Index to global equity index as at Dec-20. 
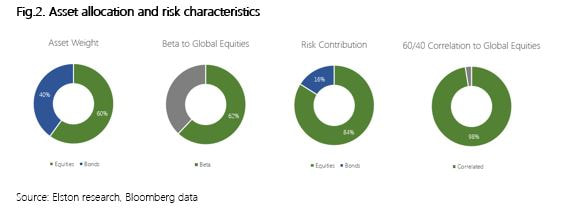
Why some think 60/40 will outlive us all. The relevance of 60/40 portfolio lies in its established historic, mathematical and academic backup. Whilst past performances do not guarantee future returns, it nonetheless provides us with experience and guidance. (Martin,2019) Research also suggests that straightforward heuristic or “rule-of-thumb” strategies work well because they aren’t likely to inspire greed or fear in investors. They become timeless. Thus, creating a ‘Mind-Gap’. (Martin,2019) In the US, the Vanguard Balanced Index Fund (Ticker: VBINX US) which combines US Total Market Index and 40% into US Aggregate bonds, plays a major role in showcasing the success of the 60/40 portfolio that has proved popular with US retail investors (Jaffe,2019). Similarly, in the UK the popularity of Vanguard LifeStrategy 60% (Ticker VGLS60A) showcases the merits of a straightforward 60/40 equity/bond approach. In 2020, for US investors VBINX provided greater (peak-to-trough) downside protection owing to lower beta (-19.5% vs -30.3% for US equity) and delivered total return of +16.26% volatility of 20.79%, compared to +18.37% for an ETF tracking the S&P 500 with volatility of 33.91%, both funds are net of fees. In this respect, the strategy captured 89% of market returns, with 61% of market risk. 
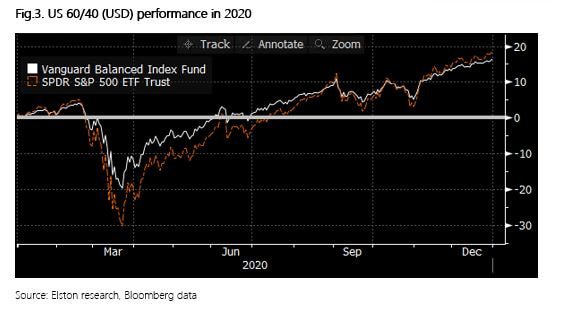
For GBP-based investors in 2020 the 60/40 approach had lower (peak-to-trough) drawdown levels (-15%, vs -21% for global equities) owing to lower beta. The 60% equity fund delivered total return of +7.84% with volatility of 15.12%, compared to +12.15% for an ETF tracking the FTSE All World Index with volatility of 24.29%. In this respect, the strategy captured 65% of market returns, with 62% of market risk. 
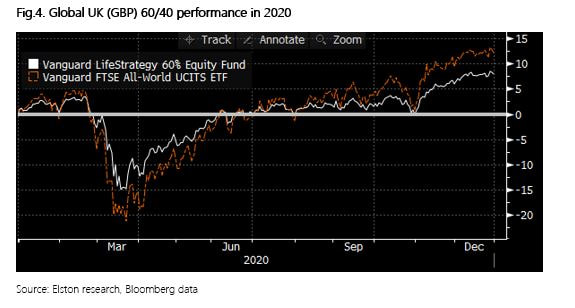
Why some think 60/40 has neared its end
Since its inception the 60/40 portfolio, derived 90% of the risk from stocks. In simple terms, 60% of the asset allocation of the portfolio was therefore the main driver of the portfolio. Returns (Robertson,2021). This hardly a surprise given that equities have a 84% contribution to portfolio ris, on our analysis, but the challenge made by some researchers is that if a 60/40 portfolio mainly reflects equity risk, what role does the 40% bond allocation provide, other than beta reduction? The bond allocation is under increasing scrutiny now is because global economic growth has slowed and traditionally safer asset classes like bonds have grown in popularity making bonds susceptible to sharp and sudden selloffs. (Matthews,2019) Strategists such as for Woodard and Harris, for Bank of America and Bob Rice for Tangent Capital have stated in their analysis that the core premise of the 60/40 portfolio has declined as equity has provided income, and bonds total return, rather than the other way round.. (Browne,2020) Another study shows that over the past 65 years bonds can no longer effectively hedge against inflation and risk reduction through diversification can be done more adequately by exploring alternatives such as private equity, venture capital etc. (Toschi, 2021). Left unconstrained, however, this can necessarily up-risk portfolios. With bond yields at an all-time low, nearing zero and the fact that they can no longer provide the protection in the up-and-coming markets many investors query the value provided by a bond allocation within a portfolio. (Robertson,2021) Key insights While point of views might differ about 60/40 as an investment strategy, one aspect that is accepted is that the future of asset allocation looks very different when compared to the recent past. Rising correlations, low yields have led strategists and investors to incorporate smarter ways of risk management, explore new bond markets like China, create modified opportunities for bonds to hedge volatility through risk parity strategies, as well as using real asset exposure such as real estate and infrastructure. (Toschi, 2021) Research conducted by The MAN Institute summarises that modifying from traditional to a more trend-following approach introduces the initial layer of active risk management. By adding an element of market timing investors further reduce the risk, when a market’s price declines. While bonds have declined in yield, they still hold importance in asset allocation for beta reduction. Further diversifying the portfolio with an allocation to real assets has potential to provide more yield and increased return than government bonds. Summary The 60/40 portfolio strategy has established itself over many decades, it has seen investors through four major wars, 14 recessions, 11 bear markets, and 113 rolling interest rate spikes. It has proved resilience as a strategy and utility as a benchmark. Our conclusion is that 60/40 is not dead: it is a useful multi-asset benchmark and remains a starting point for strategic asset allocation strategies. But the detail of the bond allocation needs a rethink. Incorporating alternative assets or strategies so long as any increased risk can be constrained to ensure comparable portfolio risk characteristics. Henry Cobbe & Aayushi Srivastava Elston Consulting Bibliography Browne, E., 2021. The 60/40 Portfolio Is Alive and Well. [online] Pacific Investment Management Company LLC. Available at: https://www.pimco.co.uk/en-gb/insights/blog/the-60-40-portfolio-is-alive-and-well Jaffe, C., 2019. No sale: Don’t buy in to ‘the end’ of 60/40 investing. [online] Seattle Times. Available at: https://www.seattletimes.com/business/no-sale-dont-buy-in-to-the-end-of-60-40-investing/ Martin, A., 2019. The 60/40 Portfolio Will Outlive Us All. [online] Advisorperspectives.com. Available at:https://www.advisorperspectives.com/articles/2019/11/11/the-60-40-portfolio-will-outlive-us-all#:~:text=As%20two%20recent%20commentaries%20demonstrate,40%20will%20outlive%20us%20all. Matthews, C., 2021. Bank of America declares ‘the end of the 60-40’ standard portfolio. [online] MarketWatch. Available at:https://www.marketwatch.com/story/bank-of-america-declares-the-end-of-the-60-40-standard-portfolio-2019-10-15 Robertson, G., 2021. 60/40 in 2020 Vision | Man Institute. [online] www.man.com/maninstitute. Available at:https://www.man.com/maninstitute/60-40-in-2020-vision Toschi, M., 2021. Why and how to re-think the 60:40 portfolio | J.P. Morgan Asset Management. [online] Am.jpmorgan.com. Available at: https://am.jpmorgan.com/be/en/asset-management/adv/insights/market-insights/on-the-minds-of-investors/rethinking-the-60-40-portfolio/ [3 min read, open as pdf] Inflation is on the rise Easy central bank money, pent up demand after lockdowns and supply-chain constraints mean inflation is on the rise. Will Central Banks be able to keep the lid on inflation? The risk is that it could persistently overshoot target levels. 
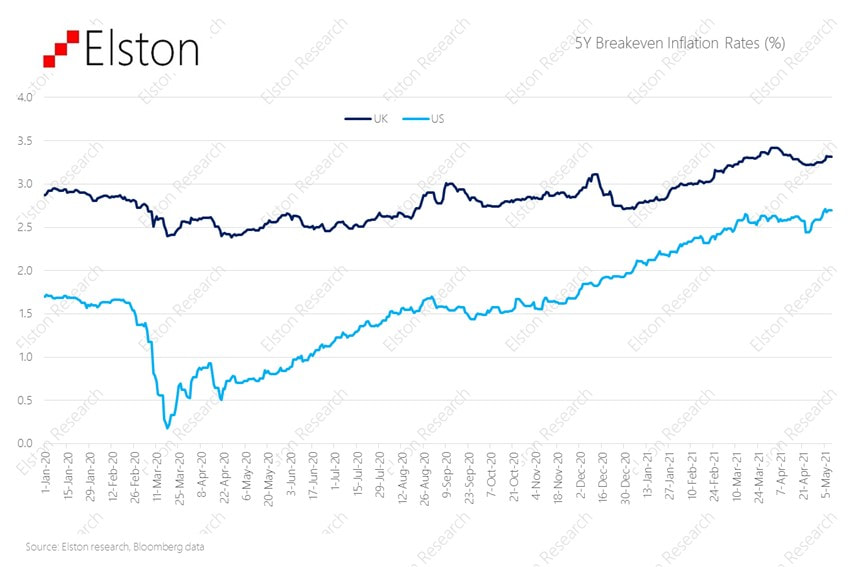
It matters more over time Inflation erodes the real value of money: its “purchasing power”. If inflation was on target (2%), £100,000 in 10 year’s time would be worth only £82,035 in today’s money. But on current expectations, it could be worth a lot less than that. 
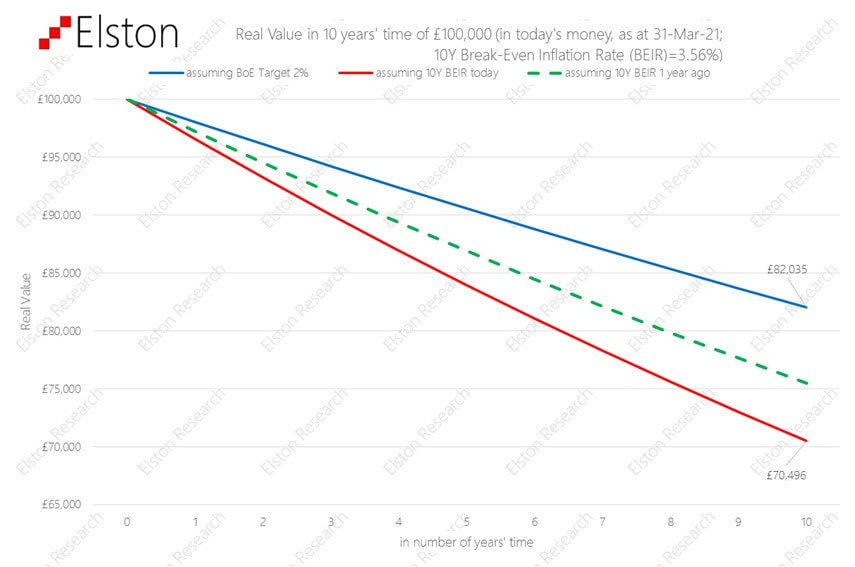
Real assets can help
A bank note is only as valuable as the value printed on it. This is called its “nominal value”. Remember the days when a £5 note went a long way? When inflation rises, money loses its real value. By contrast, real assets are things that have a real intrinsic value over time whose value is set by supply, demand and needs: like copper, timber, gold, oil, and wheat. Real assets can also mean things that produce an regular income which goes up with inflation, like infrastructure companies (pipelines, toll roads, national grid etc) and commercial property with inflation-linked rents. Rethinking portfolio construction Including “real assets” into the mix can help diversify a portfolio, and protect it from inflation. Obviously there are no guarantees it will do so perfectly, but it can be done as a measured approach to help mitigate the effects of inflation. The challenge is how to do this without taking on too much risk. Find out more about our Liquid Real Assets Index [5min read, open as pdf]
We agree it’s time to rethink the 60/40 portfolio. It’s a useful benchmark, but a problematic strategy. What is the 60/40 portfolio, and why does it matter? What it represents? Trying to find the very first mention of a 60/40 portfolio is proving a challenge, but it links back to Markowitz Modern Portfolio Theory and was for many years seen as close to the optimal allocation between [US] equities and [US] bonds. Harry Markowitz himself when considering a “heuristic” rule of thumb talked of a 50/50 portfolio. But the notional 60/40 equity/bond portfolio has been a long-standing proxy for a balanced mandate, combining higher-risk return growth assets with lower-risk-return, income generating assets. What’s in a 60/40? Obviously the nature of the equity and the nature of the bonds depends on the investor. US investor look at 60% US equities/40% US treasuries. Global investors might look at 60% Global Equities/40% Global Bonds. For UK investors – and our Elston 60/40 GBP Index – we look at 60% predominantly Global Equities and 40% predominantly UK bonds Why does it matter? In the same way as a Global Equities index is a useful benchmark for a “do-nothing” stock picker, the 60/40 portfolio is a useful benchmark for a “do-nothing” multi-asset investor. Multi-asset investors, with all their detailed decision making around asset allocation, risk management, hedging overlays and implementation options either do better than, or worse than this straightforward “do-nothing” approach of a regularly rebalanced 60/40 portfolio. Indeed – its simplicity is part of its appeal that enables investors to access a simple multi-asset strategy at low cost. The problem with Bonds in a 60/40 framework In October 2019, Bank of America Merrill Lynch published a research paper “The End of 60/40” which argues that “the relationship between asset classes has changed so much that many investors now buy equities not for future growth but for current income, and buy bonds to participate in price rallies”. This has prompted a flurry of opinions on whether or not 60/40 is still a valid strategy The key challenges with a 60/40 portfolio approach is more on the bond side:
So is 60/40 really dead? In short, as a benchmark no. As a strategy – we would argue that for serious investors, it never was one. We therefore think it’s important to distinguish between 60/40 as an investment strategy and 60/40 as a benchmark. We think that a vanilla 60/40 equity/bond portfolio remains useful as a benchmark to represent the “do nothing” multi-asset approach. However, we would concur that a vanilla 60/40 equity/bond portfolio, as a strategy offered by some low cost providers does – at this time – face the significant challenges identified in the 2019 report, that have been vindicated in 2020 and 2021. For example, during the peak of the COVID market crisis in March 2020, correlations between equities and bonds spiked upwards meaning there was “no place to hide”. The growing inflation risk has put additional pressure on nominal bonds. Real yields are negative. Interest rates won’t go lower. But outside of some low-cost retail products, very few portfolio managers, would offer a vanilla equity/bond portfolio as a client strategy. The inclusion of alternatives have always had an important role to play as diversifiers. Rethinking the 40%: What are the alternatives? When it comes to rethinking the 60/40 portfolio, investors will have a certain level of risk budget. So if that risk budget is to be maintained, there is little change to the “60% equity” part of a 60/40 portfolio. What about the 40%? We see opportunity for rethinking the 40% bond allocation by: We nonetheless think it is important to:
1. Rethinking the bond portfolio Whilst more extreme advocates of the death of 60/40 would push for removing bonds entirely, we would not concur. Bonds have a role to play for portfolio resilience in terms of their portfolio function (liquidity, volatility dampener), so would instead focus on a more nuanced approach between yield & duration. We would concur that long-dated nominal bonds look problematic, so would suggest a more “barbell” approach between shorter-dated bonds (as volatility dampener), and targeted, diversified bond exposures: emerging markets, high yield, inflation-linked (for diversification and real yield pick-up). 2. Incorporating sensible alternative assets Allocating a portfolio of the bond portfolio to alternatives makes sense, but we also need to consider what kind of alternatives. Whilst some managers are making the case for hedge funds or private markets as an alternative to bonds, we think there are sensible cost-efficient and liquid alternatives that can be considered for inclusion that either have bond-like characteristics (regular stable income streams), or provide inflation protection (real assets). For regular diversified income and inflation protection, we would consider: asset-backed securities, infrastructure, utilities and property. The challenge, however, is how to incorporate these asset classes without materially up-risking the overall portfolio. For inflation protection, we would consider real assets: property, diversified, commodities, gold and inflation-protected bonds. Properly incorporated these can fulfil a portfolio function that bonds traditionally provided (liquidity, income, ballast and diversification). 3. Consider risk-based diversification as an alternative strategy One of the key reasons for including bonds in a multi-asset portfolio is for diversification purposes from equities on the basis that one zigs when the other zags. In the short-term, and particularly at times of market stress, correlations between asset classes can increase, this reduces the diversification effect if bonds zag when equities zag. We would argue risk-based diversification strategies have a role to play to here, on the basis that rather than relying on long-run theoretical correlation, they systematically focus on short-run actual correlation between asset classes and adapt their asset allocation accordingly. Traditional portfolios means choosing asset weights which then drive portfolio risk and correlation metrics. Risk-based diversification strategies do this in reverse: they use short-run portfolio risk and correlation metrics to drive asset weights. If the ambition is to diversify and decorrelate, using a strategy that has this as its objective makes more sense. Summary So 60/40 is not dead. It will remain a useful benchmark for mult-asset investors. As an investment strategy, vanilla 60/40 equity/bond products will continue to attract assets for their inherent simplicity. But we do believe a careful rethink of the “40” is required. Compared to traditional retail funds, ETFs offer transparency, liquidity and efficiency [7 min read, Open as pdf] In this series of articles, I look at some of the key topics explored in my book “How to Invest With Exchange Traded Funds” that also underpin the portfolio design work Elston does for discretionary managers and financial advisers. Indexes: the DNA of an ETF An Exchange Traded Fund is an index-tracking investment fund that aims to track (perform exactly in line) with the benchmark index in the fund’s name. The index defines an ETF’s “DNA”. An index is a collective measure of value for a defined group of securities, where criteria for inclusion and weighting within that group are defined by a systematic set of rules. Indices can represent a basket of equities like the FTSE 100 Index (the “Footsie”) or a basket of bonds like the FTSE Actuaries UK Conventional Gilts All Stocks Index (the “gilts” index). Indices can be used as benchmarks to represent the performance of an asset class or exposure. ETFs aim to track these benchmark indices by holding the same securities in the same weights as the index. Whilst ETFs can be an equity fund or bond fund (amongst others) with respect to its underlying holdings and the index it tracks, the shares in those ETFs trade on an exchange like an equity. This means ETFs combine the diversification advantages of a collective investment scheme, with the accessibility advantages of a share, all at a management fee that is substantially lower than traditional active funds. These features make ETFs easy to buy, easy to switch and easy to own, revolutionising the investment process as well as reducing investment costs. Indices enable transparency ETFs are regulated collective investment schemes (often UCITS[1] schemes) that can be traded on a recognised exchange, such as the London Stock Exchange. Whereas the manager of a traditional active fund aims to outperform an index such as the FTSE 100 by overweighting or underweighting particular securities within that index or holding non-index securities, an ETF aims to deliver the same returns as the index by holding within the fund the same securities as the index in the same proportion as the index. If the index represents a basket of securities weighted by their respective size, it is a “Capitalisation-weighted index”: this is the traditional index approach. If the index represents a basket of securities weighted by a criteria other than their respective size, it is an “Alternatively-weighted” index. For example, an equal weighted index means all the securities in an index are given an equal weight. [1] UCITS: Undertakings for Collective Investment in Transferable Securities (the European regulatory framework for retail investment funds) 
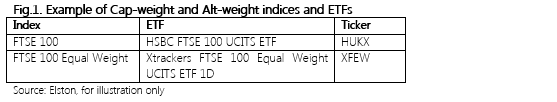
ETFs track indices, and indices have rules. Index rules are publicly available and set out how an index selects and weights securities and how frequently that process is refreshed. Indices therefore represent a range of investment ideas and strategies, but codified using a rules-based approach. This makes ETFs’ investment approach transparent, systematic and predictable, even if the performance of securities within the index is not. Furthermore, ETFs publish their full holdings every day so investors can be sure of what they own. This makes ETFs’ investment risks transparent. The investment risk-return profile of an ETF is directly link to the risk-return profile of the index that it tracks. Hence ETFs tracking emerging market equity indices are more volatile than those tracking developed market indices, which in turn are more volatile than those tracking shorter-duration bond indices. As with direct shares, traditional active mutual funds and index-tracking funds, when investing in ETFs, capital is at risk, hence the value of investments will vary and the initial investment amount is not guaranteed. ETFs vs traditional funds An ETF is different to other types of investment fund in the following ways:
The primary advantage of ETFs is the additional liquidity that a “secondary market” creates in the shares of that ETF (meaning the ability for investors to buy or sell existing shares of that ETF amongst themselves via a recognised exchange). However it is important to note that ultimately the liquidity of any ETF is only as good as its underlying assets. Traditional mutual funds can be traded once a day and investors transact with the fund issuer who must buy or sell the same amount of underlying securities. Fund issuers have the right to “gate” funds and refuse to process redemptions to protect the interests of the broader unitholders of the fund. If this happens, there is no secondary market for shares/units in the fund. Recent examples of “gating” include UK property funds after the Brexit vote[1] and strategic bond funds as interest rates expectations rose[2]. By contrast, Exchange Traded Funds can be traded throughout the day and investors generally transact with each other via the exchange. If necessary the fund issuer must create (or redeem) more units to meet demand and then buy (or sell) the same amount of underlying securities. Whilst, the liquidity of the fund is ultimately only as good as the underlying assets, there is, however, additional liquidity in the secondary market for shares in the fund which can be bought or sold amongst investors. For example, there have been circumstances when some markets have closed, and the underlying shares aren’t traded, the ETF continues to trade (albeit a premium or discount to Net Asset Value (NAV) may appear owing to the inability of the ETF to create/redeem units when there is no access to the underlying shares) and indeed becomes a vehicle of price discovery for when the market eventually reopens[3]. As regards fees, whereas funds have different fee scales for different types of investor based on share classes available, the fees on ETFs are the same for all investors meaning that the smallest investors benefit from the economies of scale that the largest investors bring. Whilst the active/passive (we prefer the terms non-index/index) debate grabs the headlines, it is this targeted acces to specific asset classes, fee fairness and secondary market liquidity that makes ETFs so appealing to investors of any size. A summary of similarities and differences of ETFs to other types of fund is presented in the table below: [1] https://seekingalpha.com/article/3986464-investors-u-k-property-etfs-affected-9b-fund-lock [2] https://www.ft.com/content/a007d563-4454-3c92-aeaa-4d0dc64e425b [3] https://www.cnbc.com/id/41354109 
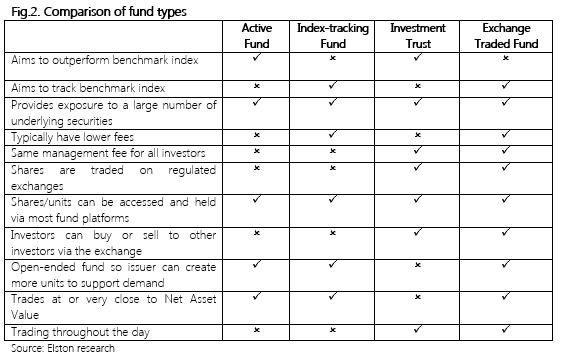
From the table above, we see how, ETFs offer the combined functionality of a collective investment scheme with the flexibility and access of an exchange traded instrument. Ways to use ETFs We see three key applications for ETFs in portfolio construction: “core”, “blended” and “pure”. Using ETFs for a core portfolio means creating and managing a core asset allocation constructed using ETFs, with satellite “true active” fund holdings for each of the same exposures in an attempt to capture some manager alpha at a fund level. This enables a portfolio manager to reduce partially the overall client costs without forsaking their hope of higher expected returns from “true active” non-index fund holdings for each exposure. Using ETFs for a blended portfolio means creating and managing an asset allocation constructed using ETFs for efficient markets or markets where a portfolio managers may lack sufficient research or experience; and active funds for asset class exposures where the manager has high conviction in their ability to deliver alpha from active fund or security selection. For example, a UK portfolio manager with high conviction in UK stock picking may prefer to access US equity exposure using an ETF that tracks the S&P500 rather than attempting to pick stocks in the US. Use of ETFs for a pure ETF Portfolio means creating and managing an asset allocation constructed using ETFs entirely. For example, a portfolio manager looking to substantially reduce overall client costs without compromising on diversification is able to design a portfolio using ETFs for each asset class and risk exposure. Fig.3. Illustration representing core, blended and pure approaches to ETF adoptio 
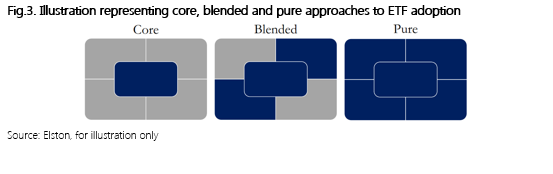
Who uses ETFs and why?
ETFs are used by investors large and small to build and manage their portfolios. As well as providing low cost, diversified and transparent access to a market or asset class, the liquidity of ETFs namely that 1) they only invest in liquid securities that index-eligible and 2) the ETF can itself be bought or sold between market participants means that investors can adapt their portfolio in a timely basis, if required. Put differently traditional funds are one of the few things in the world that you can only sell back to the person you bought it from (the fund issuer), and that fund issuer has the right to say no. Furthermore, the dealing cycles for traditional funds are long. If you want to sell one to buy another, it could take 4-5 days to sell and 4-5 days to buy. An 8-10 day round trip is hardly timely. In the meantime you may be out of the market, which could dramatically impact performance, particularly in periods of extreme volatility. By contrast, ETFs are designed to be tradable on a secondary market via an exchange, and can be bought and sold between market participants on the same day without the fund manager’s involvement. This means that if investors want to alter their risk posture to respond to changing events, they can do so instantly and effectively if required. ETFs have therefore grown in popularity as a core part of institutional and retail investor’s toolkit for portfolio and risk management. [7 min read, open as pdf] Whether or not investors enjoy creating and managing their own ETF portfolios, ready-made portfolios and funds of ETFs and index funds offer a convenient alternative In this series of articles, I look at some of the key topics explored in my book “How to Invest With Exchange Traded Funds” that also underpin the portfolio design work Elston does for discretionary managers and financial advisers. Who needs or wants a ready-made portfolio? Individual investors of all wealth levels may find the prospect of engaging with their investment daunting, time-consuming, or both. This is heightened by the high number of investment products and services available. In the UK, there are over 70 discretionary management firms, and over 3,000 investment funds and ETFs. For this reason, DIY investors may want ready-made portfolios that are an easy-to-buy and easy-to-own investment. Not only do these solutions look like a simple alternative but they can also address and can potentially mitigate behavioural mistakes. We look at three alternative ways of delivering ready-made portfolios for DIY investors in more detail: multi-asset funds, ETF portfolios and multi-asset ETFs. Multi-Asset Funds Multi-Asset Funds (also known as Asset Allocation Funds or Multi-Manager Funds) are the most established type of ready-made portfolios. By owning a single fund (or in some cases an investment trust), investors get exposure to a diversified portfolio of underlying funds to reflect a specific asset allocation. This means that having selected a strategy, the investor does not need to worry about asset allocation, or about the portfolio construction to achieve that asset allocation, or about security selection within each asset class exposure. We categorise Multi-Asset Funds into different categories by investment strategy:
Despite the cost of wrapping underlying funds within a fund structure, economies of scale mean that Multi-Asset Funds can be delivered to investors at highly competitive price points with very low minimums. However, the disadvantage is that Multi Asset Funds have a one-size-fits-all approach that means there is little scope for customisation to the individual needs and characteristics of the investor’s objectives and constraints. ETF Portfolios ETF Portfolios are basket of individual ETFs providing an asset allocation. Rather than wrapping an investment strategy within a fund, a model portfolio is made available as a basket of ETFs that can be bought individually to create the strategy. Model portfolios may be “strategic” (rebalanced to fixed weights of the same securities) or “tactical” (rebalanced to changing weights of the same or different ETFs). Model portfolios are research portfolios meaning that the model portfolio provider has no control of client assets so it is up to a portfolio manager, adviser or DIY investor to implement any changes should they wish to follow a given model portfolio strategy. The advantages of ETF Portfolios include: firstly, potentially lower fees owing to removal of a fund wrapper to hold the strategy; secondly greater flexibility and specificity with regards to asset allocation design; and lastly agility as strategies can be launched or closed with ease. An example of an ETF Portfolio could be as simple as a classic global 60/40 Equity/Bond strategy constructed with ETFs. Whilst ostensibly very simple – a two security portfolio – the underlying holdings of each ETF means that investors get exposure to 3,133 equities in global and developed markets (approximately 47 countries) and 1,660 investment grade bonds in over 24 countries. Put simply, the investor is able to buy the bulk of the global equity and bond markets with two simple trades. When manager, advisers or research firms create model portfolios, the weighting scheme can be one of three types as summarised in the table below. The ability to design and create ETF Portfolios with an increasing number of ETF building blocks means that both traditional (asset managers, stock brokers) and non-traditional providers (e.g. trade publications, investment clubs, industry experts) can create investment strategies that can be “followed” by investors. However, the usual due diligence rules for any investment provider should be applied as regards their investment process. Whilst the rise of more bespoke ETF strategies is welcome, the convenience of having a single strategy delivered as a single security from a portfolio construction perspective is attractive. This is where Multi-Asset ETFs could have a role to play. Multi-Asset ETFs Multi-Asset ETFs are an emerging way of delivering the returns of a managed ETF Portfolio using a single instrument. Whereas multi-asset funds are often funds of index-tracking funds, Multi-Asset ETFs can be viewed as an “ETF of ETFs”. In the US, there are a number of multi-asset ETFs available providing a ready-made allocation within a single trade. In the UK, there are currently only two ranges of multi-asset ETFs available. Multi-Asset Infrastructure (launched April 2015) SPDR® Morningstar Multi-Asset Global Infrastructure UCITS ETF ESG Multi-Asset ETFs (launched September 2020) BlackRock ESG Multi-Asset Conservative Portfolio UCITS ETF (MACG) BlackRock ESG Multi-Asset Moderate Portfolio UCITS ETF (MAMG) BlackRock ESG Multi-Asset Growth Portfolio UCITS ETF (MAGG) We expect multi-asset funds, constructed with ETFs and index funds, to gain more traction than multi-asset ETFs because as a “buy and hold” ready-made portfolio multi-asset funds do not need the intraday dealing availability that ETFs provide. Multi-asset funds (constructed with index funds/ETFs), ETF Portfolios, and Multi-asset ETFs provide a ready-made one stop for delivering a multi-asset investment strategy for all or part of an investment portfolio, whether defined by a multi-asset index or not. The advantages of a multi-asset fund of ETFs as a ready-made portfolio The advantages of a “one and done” approach include collectivisation, convenience and consistency. Firstly, is collectivisation of investor’s by objective which creates cost efficiency from the economies of scale. Adopting a collectivised approach, can be done where each group of clients shares the same goal (as defined by, for example, a target risk level or income objective, or volatility objective or target date). This can help achieve economies of scale and lower the cost of offering professionally managed asset allocations in at least three different ways. Firstly, each cohort becomes a multi-million pound ‘client’ of an asset manager who can deploy institutional-type bargaining power on the pricing of the underlying funds within their asset allocation. Secondly, the collective scale reduces frictional trading costs of implementing the asset allocation decisions: one managed investment journey is more efficient to manage and deliver than thousands of individual ones. Finally, by focusing on actively managing the asset allocation as the main determinant of the level and variability of returns[1] the asset allocation can be implemented with index-tracking ETFs to keep costs down. Secondly is convenience. Rather than focusing solely on building optimal multi-asset class portfolios that need monitoring, the proposition of investment offerings can be engineered to eliminate poor behavioural tendencies that prevent effective management. Engineering funds so that they offer a single investment journey which investors do not necessarily need to monitor regularly in order to reach their goals can help reduce the perceived hassle of investing. This can motivate individuals to invest. Such professionally managed funds prevent investors from either not rebalancing the portfolio or doing it in an improper fashion due to behavioural tendencies such as status quo bias[2] and disposition effect[3]. Furthermore, a professionally managed strategy can respond to other risks aside from market risk such as shortfall, concentration or longevity risks which lay investors can overlook. An additional advantage of offering managed diversified funds is that it automatically curtails the number of products offered, thereby reducing cognitive load of making an investment decision and can prevent decision deferral.[4] Finally is consistency. Investors in each strategy experience the same time-weighted investment returns thereby reducing the likely dispersion of returns that a group of investors would experience through an entirely self-directed approach. This consistency is why multi-asset funds have also been adopted by some financial advisers as a core or complete holding within a centralised investment proposition. The disadvantage of a ready-made portfolio are not secret. They are designed as a “one-size-fits-all” product with no scope for customisation. The respective features of the various types of ready-made portfolio are set out below. Whereas multi-asset funds of ETFs, and multi-asset ETFs can be accessed via a single trade, their scope for customisation is low. ETF Portfolios have the highest degree of flexibility for creating custom strategies, but are not accessible via a single trade. Summary Ready-made portfolios are easy to buy and easy to own. They enable a “set and forget” approach to investment management which can help design out key behavioural risks, or provide a useful core holding to a broader strategy. Obviously the primary choice is which strategy an investor must choose, or their adviser should recommend depending on their risk-return objectives and suitability considerations. [1] Ibbotson, “The Importance of Asset Allocation.” [2] Samuelson and Zeckhauser, “Status Quo Bias in Decision Making.” [3] Shefrin and Statman, “The Disposition to Sell Winners Too Early and Ride Losers Too Long”; Weber and Camerer, “The Disposition Effect in Securities Trading.” [4] Iyengar and Jiang, “How More Choices Are Demotivating”; Iyengar, Huberman, and Jiang, “How Much Choice Is Too Much?” [7min read, open as pdf]
After deciding on an asset allocation and which funds or ETFs to populate it, how best to put the plan into action? All at once or in stages? If in stages, how many and for how long? Looking out for portfolio “drift” and the options for rebalancing. These implementation decisions can have far greater impact on the value of investments than picking the “right” fund or portfolio. In this series of articles, I look at some of the key topics explored in my book “How to Invest With Exchange Traded Funds” that also underpin the portfolio design work Elston does for discretionary managers and financial advisers. Implementation is the process of putting an investment strategy plan into action. Implementation is key to investment outcomes whether transitioning an existing portfolio from one strategy to another, or whether investing fresh capital. Implementing a new portfolio Having decided on an amount to invest, the next hardest decision is when and how to start investing. Your entry level will be directly impacted by the immediate direction (sequence of returns) from the day you invest. You could think the market is too high and wait but it could climb higher. You could think you’ve bought the dip only to be catching a falling knife that marks the start of a steady and protracted decline. Deciding the “right time” to move assets from cash into risk assets can be tricky but staying out of the market is much more costly in the long run. So how best to invest: with a lump sum, or gradually phased over time? Lump sum investing: in the very long run research suggests that investing with a lump sum delivers better returns in the long run (as capital is in the market for longer, despite near-term fluctuations). However in the short-run it can be a scary and stressful experience, particularly for new investors, if they see immediate paper losses. If the sight of those paper losses is likely to cause an investor to withdraw their capital from the market then real damage is done. So whilst from an academic perspective lump sum investing makes sense, for practitioners considering investor experience and behavioural risks, a phased approach may be less stressful. Phased investing: Phased investing is a less stressful approach. By investing in regular intervals, short-term fluctuations smoothen out, and the investor achieves an entry price to risk assets that is the average over that implementation period. The pace of phased investing consideration should be given to client needs, portfolio size and market conditions. If markets are upward trending, implementation should be rapid. If markets are uncertain or downward trending, implementation should be gradual. Timing the markets is impossible, hence the best approach is to make a plan and stick to it. This enables better acceptance of the outcome. Implementing an existing portfolio where the asset allocation changes Implementing an existing portfolio where there is a change in the asset allocation may also benefit from a phased approach to help smooth returns (ignoring any tax considerations). A rolling benchmark can be used to calibrate performance evaluation. An implementation window should be agreed and any evaluation metric adjusted accordingly. Changes in tactical asset allocation should continue to be reflected immediately. By using a phased approach this can reduce portfolio sensitivity to short term market directional movements as it transitions to its new strategic posture. Implementing an existing portfolio where there are only changes to underlying holdings Implementing an existing portfolio where there is no change in asset allocation, but a material change in the underlying holdings (for example switching from active funds to ETFs) we recommend an immediate approach (assuming no tax considerations). This is because with no change in asset allocation, there is no change in the risk profile of the portfolio. Changes in tactical asset allocation should continue to be reflected immediately. Drift and rebalancing A key implementation decision is around portfolio rebalancing. Once a strategic allocation is set, investors need to decide what is an acceptable amount of drift, how frequently or infrequently to rebalance and on what basis to do so[1]. Allocation ranges As the asset returns of each asset class in the allocation vary, the weight of each asset class will “drift” from its start weight. Left unchecked, or if rebalancing is too infrequent, the risk profile (expected risk-return) of the allocation may vary significantly from target weights. Investors should specify to what extent they will allow such “drift” by specifying the minimum and maximum asset allocation ranges for each asset class. This can be expressed arithmetically (e.g. a 50% strategic allocation to equities can drift between +/-2.5ppts from the target weight), or geometrically (e.g. a 50% strategic allocation to equities can drift between 0.95x and 1.05x of the target weight). Rebalancing policy After deciding on allowable ranges of drift, investors must consider the frequency of rebalancing. The advantages of frequent rebalancing are:
The disadvantages of frequent rebalancing are:
In conclusion, for contrarian investors, regular rebalancing makes sense, but investors need to achieve a balance between frequency and trading and other frictional costs. Hence the more long-term your portfolio, the less frequently you need to rebalance. The more short-term your portfolio the more frequently you need to rebalance. A useful rule of thumb would be to consider quarterly rebalancing for medium-term portfolios (3-10 years), semi-annual rebalancing for long-term portfolios (10-20 years) and annual rebalancing for longer term portfolios (>20 years). It follows that the less frequent the rebalancing, the greater the range of allowable drift should be. Bringing this together, the investment time horizon, rebalancing frequency, and allowable drift ranges will differ from mandate to mandate. Rebalancing triggers When selecting a rebalancing trigger, investors can select one of the following:
After deciding on frequency of review, drift ranges, and type of trigger investors need to decide on what weighting scheme to implement. Types of rebalancing When selecting a weighting scheme, investors can select one of the following:
Rebalancing and cash flow Finally there investors can use cashflows where available to mitigate trading costs. Where there is no new capital introduced, the rebalancing process will necessarily consists of sales and purchases of each asset class to realign to target weights. Where there is sufficient capital being introduced, that opportunity can be used to make purchases only, to realign the portfolio to target weights. This reduces trading costs. Rebalancing enforces investment discipline, but there is a balance to be struck between accuracy of target weights and trading costs. The degree to which a portfolio is traded (with associated transaction costs) is called portfolio turnover, and this is one of the technical considerations for portfolio implementation. Technical considerations Portfolio turnover Decisions around rebalancing will directly impact portfolio turnover. Turnover is the measure of the extent to which a portfolio is changed. Annual turnover is calculated by taking the lesser of the value of securities purchased or sold during one year and dividing that by the average monthly value of the portfolio for that period. Lower portfolio turnover (e.g. 0-20%) is closer to a “buy-and-hold” strategy which has lower transaction costs. Higher portfolio turnover (e.g. 80% or more) is closer to a frequent trading strategy, which has higher transaction costs. The type of strategy and related turnover should be consistent with the investment objectives. Taking the inverse of the annual turnover figure gives the average holding period. For example, for a portfolio with annual turnover of 20%, the average holding period for a security is 5 years, For 200% it is 0.5 years. Whilst evidence suggests that lower turnover strategies tend to outperform higher turnover strategies[4], the main value of the turnover ratio is to ensure that the portfolio is being managed in alignment with the agreed mandate. Regular investing with Pound Cost Averaging For DIY investors who don’t have large lump sums to invest one of the most effective ways to resolve implementation risk is to adopt a permanent phased investment approach known as a regular investment plan. The benefit of this approach is known as pound cost averaging. Pound-cost averaging is a popular investment strategy where the same dollar amount is invested sequentially over a number of time-periods. Pound cost averaging[5] smooths the entry point for investments over each year. It means investors are topping up when markets are down and are buying less when markets are up. In this respect the approach is contrarian. The primary benefit of pound cost averaging is not necessarily that it improves returns, but it reduces the stress and anxiety associated with worrying about market levels. By breaking one large investment decision into a sequence of investments, the investor essentially diversifies their risk to obtain an entry price of an investment closer to the average price of an investment for the given time frame that was used to purchase it. While the majority of academic research notes the inferior performance of pound-cost averaging relative to lump sum investing over the long run[6], there is evidence that pound-cost averaging can lead to higher returns in the case of lower volatility funds or when there is a substantial chance of an investment losing value[7]. There is also the practical considerations ignored by academics that many DIY investors find it easier to allocate a certain portion of monthly income to their investments rather than a lump sum. For example, for most DIY investors it’s easier from a cashflow perspective to invest £500 per month into an ISA than to make a lump-sum investment of £6,000. Finally, evidence suggest that DIY investors tend to be their own worst enemy when attempting to time the market. Analysis of equity allocations for the period 1992-2002 for over a million accounts reveals that individuals frequently end up buying high and selling low[8] and there is also evidence that an average investor performs worse than the corresponding benchmark[9]. A disciplined investment approach of pound-cost averaging mitigates investors’ temptation to time the market[10] and therefore protects against the cognitive errors that lead to suboptimal investment outcomes[11]. Furthermore, it nudges right decisions in a bear market, “buy low”, precisely when investors’ confidence in the stock market is weakened[12]. Studies in the UK market suggest that retail net fund flows are broadly influenced by the direction of the market with inflows chasing up-markets, and out-flows chasing down-markets. This contrary to the principles of value investing. Pound cost averaging is therefore an antidote to many of the behavioural pitfalls that can catch investors out. Summary These are the main implementation considerations when setting up a new or transitioning an existing portfolio.
[1] Dayanandan and Lam, “Portfolio Rebalancing–Hype or Hope?” [2] O’Neill, “Overcoming Inertia”; Benartzi and Thaler, “Heuristics and Biases in Retirement Savings Behavior.” [3] Sharpe, “Adaptive Asset Allocation Policies.” [4] Cremers and Pareek, “Patient Capital Outperformance.” [5] Agarwal, “Exploring the Benefits of Pound Cost Averaging”; Morningstar Equity Analysts, “The Benefits of Pound Cost Averaging.” [6] for example see http://www.morningstar.co.uk/uk/news/96177/is-pound-cost-averaging-overrated.aspx/ [7] Leggio and Lien, “An Empirical Examination of the Effectiveness of Dollar-Cost Averaging Using Downside Risk Performance Measures.” [8] Benartzi and Thaler, “Heuristics and Biases in Retirement Savings Behavior.” [9] Dalbar, Inc. & Lipper, “Quantitative Analysis of Investor Behavior.” [10] Kahneman and Tversky, “Prospect Theory.” [11] Statman, “A Behavioral Framework for Dollar-Cost Averaging”; Benartzi and Thaler, “Heuristics and Biases in Retirement Savings Behavior.” [12] Cohen, Zinbarg, and Zeikel, Investment Analysis and Portfolio Management, Homewood, Illinois. High risk, complex Exchange Traded Products that amplify (with “leverage”) index’ moves in the same (“long”) or opposite (“short”) direction are designed for sophisticated investors who want to trade and speculate over the short-term, rather than make a strategic or tactical investment decisions. Whilst they can have a short-term role to play, they should be handled with care. If you think you understand them, then you’ve only just begun. In this series of articles, I look at some of the key topics explored in my book “How to Invest With Exchange Traded Funds” that also underpin the portfolio design work Elston does for discretionary managers and financial advisers. For more speculators and or more sophisticated risk managers there are a range of inverse (short) and leveraged (geared) ETPs that can rapidly add or remove upside or downside risk exposure in short-term (daily) market movements. The difference between speculating and investing should be clearly defined.
Owing to the higher degree of risk management and understanding required to use these products, they may not be suitable for DIY or long-term investors. However a degree of knowledge is helpful to identify them within a managed portfolio or amongst research sites. Defining terms Unlike their more straightforward unleveraged ETF cousins, leveraged and inverse or “short” ETNs should be for sophisticated investor or professional use only. So hold onto your seat. Shorting and leverage are important tools in a professional manager’s arsenal. But first we need to define terms. Going long: means buying a security now, to sell it at a later date at a higher value. The buyer has profited from the difference in the initial buying price and final selling price. Going short: means borrowing a security from a lender and selling it now, with an intent to buy it back at a later date at a lower value. Once bought, the security can be returned to the lender and the borrower (short-seller) has profited from the difference in initial selling and final buying price. Leverage: means increasing the magnitude of directional returns using borrowed funds. Leverage can be achieved by:
Underlying index: is the underlying index exposure against which a multiplier is applied. The underlying index could be on a particular market, commodity or currency. Potential applications Managers typically have a decision only whether to buy, sell or hold a security. By introducing products that provide short and/or leveraged exposure gives managers more tools at their disposal to manage risk or to speculate. Going short, and using leverage can be done for short-term risk management purposes, or for speculative purposes. Leverage in either direction (long-short) can be used either to amplify returns, profit from very short market declines, or change the risk profile of a portfolio without disposing of the underlying holdings. Short/Leveraged ETPs available to DIY investors The following types of short/leveraged ETPs are available to implement these strategies. Fig.1. Potential application of inverse/leveraged ETPs The ability to take short and/or leveraged positions was previously confined to professional managers and ultra-high net worth clients. The availability of more complex Exchange Traded Products gives investors and their advisers the opportunity to manage currency risk, create short positions (profit from a decline in prices) and create leveraged positions (profit more than the increase or decrease in prices).
Risks Leveraged and short ETPs have significantly greater risks than conventional ETFs. Some of the key risks are outlined below:
If concerned regarding risk of deploying short/leveraged ETPs, set a capped allocation i (eg no more than 3% to be held in leveraged/inverse ETPs, and a holding period for leveraged/inverse ETPs not to exceed 1-5 days). US Case Study: Inverse Volatility Blow Up VelocityShares Daily Inverse VIX Short-Term ETN (IVX) and ProShares Short VIX Short-Term Futures ETF were products created in the US for professional investors who wanted to profit from declining volatility on the US equity market by tracking the inverse (-1x) returns of the S&P VIX Short-Term Futures Index. The VIX is itself an reflecting the implied volatility of options on the S&P 500. As US equity market volatility steadily declined the stellar performance of the strategy in prior years not only made it popular with hedge funds[2], but also lured retail investors who are unlikely to have understood the complexity of the product. By complexity, we would argue that a note inversely tracking a future on the implied volatility of the stock market is hardly simple. On 5th February, the Dow Jones Industrial Average suffered its largest ever one day decline. This resulted in the VIX Index spiking +116% (from implied ~12% volatility to implied ~33% volatility). The inverse VIX ETNs lost approximately 80% of their value in one day which resulted in an accelerated closure of the product, and crystallising the one day loss for investors[3]. The SEC (US regulator) focus was not on the product itself but whether and why it had been mis-sold to retail investors who would not understand its complexity[4]. Summary In conclusion, on the one hand, Leveraged/Inverse ETP are convenient ways of rapidly altering risk-return exposures and provide tools with which speculators can play short-term trends in the market. Used by professionals, they also have a role in supporting active risk management. However, the risks are higher than for conventional ETFs and more complex to understand and quantify. RISK WARNING! Short and/or Leveraged ETPs are highly complex financial instruments that carry significant risks and can amplify overall portfolio risk. They are intended for financially sophisticated investors who understand these products, and their potential pay offs. They can be used to take a very short term view on an underlying index, for example, for day-trading purposes. They are not intended as a buy and hold investment. [1] https://seekingalpha.com/article/1457061-how-to-beat-leveraged-etf-decay [2] https://www.cnbc.com/2018/02/06/the-obscure-volatility-security-thats-become-the-focus-of-this-sell-off-is-halted-after-an-80-percent-plunge.html [3] https://www.bloomberg.com/news/articles/2018-02-06/credit-suisse-is-said-to-consider-redemption-of-volatility-note [4] https://www.bloomberg.com/news/articles/2018-02-23/vix-fund-blowups-spur-u-s-to-probe-if-misconduct-played-a-role Which asset classes are not indexable; what proxies do they have that can be indexed; and why it can make sense to blend ETFs and Investment Trusts for creating an allocation to alternative asset classes In this series of articles, I look at some of the key topics explored in my book “How to Invest With Exchange Traded Funds” that also underpin the portfolio design work Elston does for discretionary managers and financial advisers. Non-indexable asset classes Whilst Equities, Bonds and Cash are readily indexable, there are also exposures that will remain non-indexable because they are:
It is however possible to represent some of these alternative class exposures using liquid index proxies. Index providers and ETF issuers have worked on creating a growing number of indices for specific exposures in the Liquid Alternative Asset space. Some examples are set out below:
Alternative asset index proxies Whilst these liquid proxies for those asset classes are helpful from a diversification perspective, it is important to note that they necessarily do not share all the same investment features, and therefore do not carry the same risks and rewards as the less liquid version of the asset classes they represent. While ETFs for alternatives assets will not replicate holding the risk-return characteristics of that exposure directly, they provide a convenient form of accessing equities and/or bonds of companies that do have direct exposure to those characteristics. Using investment trusts for non-index allocations Ironically, the investment vehicle most suited for non-indexable investments is the oldest “Exchange Traded” collective investment there is: the Investment Company (also known as a “closed-end fund” or “investment trust”). The first UK exchange traded investment company was the Foreign & Colonial Investment Trust, established in 1868. Like ETFs, investment companies were originally established to bring the advantages of a pooled approach to the investor of “moderate means”. For traditional fund exposures, e.g. UK Equities, Global Equities, our preference is for ETFs over actively managed Investment Trusts owing to the performance persistency issue that is prevalent for active (non-index) funds. Furthermore, investment trusts have the added complexity of internal leverage and the external performance leverage created by the share price’s premium/discount to NAV – a problem that can become more intense during periods of market stress.
However, for accessing hard-to-reach asset classes, Investment Trusts are superior to open-ended funds, as they are less vulnerable to ad hoc subscriptions and withdrawals. The Association of Investment Company’s sector categorisations gives an idea of the non-indexable asset classes available using investment trusts: these include Hedge Funds, Venture Capital Trusts, Forestry & Timber, Renewable Energy, Insurance & Reinsurance Strategies, Private Equity, Direct Property, Infrastructure, and Leasing. A blended approach Investors wanting to construct portfolios accessing both indexable investments and non-indexable investments could consider constructing a portfolio with a core of lower cost ETFs for indexable investments and a satellite of higher cost specialist investment trusts providing access to their preferred non-indexable investments. For investors, who like non-index investment strategies, this hybrid approach may offer the best of both world. Summary The areas of the investment opportunity set that will remain non-indexable, are (in our view) those that are hard to replicate as illiquid in nature (hard to access markets or parts of markets); and those that require or reward subjective management and skill. Owing to the more illiquid nature of underlying non-indexable assets, these can be best accessed via a closed-ended investment trust that does not have the pressure of being an open-ended fund. ETFs provide a convenient, diversified and cost-efficient way of accessing liquid alternative asset classes that are indexable and provide a proxy or exposure for that particular asset class. Examples include property securities, infrastructure equities & bonds, listed private equity, commodities and gold. There’s no such thing as passive. Index investors make active decisions around asset allocation, index selection and index methodology. In this series of articles, I look at some of the key topics explored in my book “How to Invest With Exchange Traded Funds” that also underpin the portfolio design work Elston does for discretionary managers and financial advisers. If indices represent exposures, what is index investing and what are the ETFs that track them? Does using an index approach to investing mean you are a ‘passive investor’? I am not comfortable with the terms “active” and “passive”. A dynamically managed approach to asset allocation using index-tracking ETFs is not “passive”. The selection of an equal weighted index exposure over a cap weighted index is also an active decision. The design of an index methodology, requires active parameter choices. Hence our preference for the terms “index funds” and “non-index funds”. Indices represent asset classes. ETFs track indices. Index investing is the use of ETFs to construct and manage an investment portfolio. The evolution of indices The earliest equity index in the US is the Dow Jones Industrial Average (DJIA) which was created by Wall street Journal editor Charles Dow. The index launched on 26 May 1896, and is named after Dow and statistician Edward Jones and consists of 30 large publicly owned U.S. companies. It is a price-weighted index (meaning the prices of each security are totalled and divided by the number of each security to derive the index level). The earliest equity index in the UK is the FT30 Index (previously the FN Ordinary Index) was created by the Financial Times (previously the Financial News). The index launched on 1st July 1935 and consists of 30 large publicly owned UK companies. It is an equal-weighted index (meaning each of the 30 companies has an equal weight in the index). The most common equity indices now are the S&P500 (launched in 1957) for the US equity market and the FTSE100 (launched in 1984) for the UK Equity market. These are both market capitalisation-weighted indices (meaning the weight of each company within the index is proportionate to its market capitalisation (the share price multiplied by the number of shares outstanding)). According to the Index Industry Association, there are now approximately 3.28m indices, compared to only 43,192 public companies . This is primarily because of demand for highly customised versions of various indices used for benchmarking equities, bonds, commodities and derivatives. By comparison there are some 7,178 index-tracking ETPs globally. The reason why the number of indices is high is not because they are all trying to do something new, but because they are all doing something slightly different. For example, the S&P500 Index, the S&P500 (hedged to GBP) Index and the S&P 500 excluding Technology Index are all variants around the same core index. So the demand for indices is driven not only by investor demand for more specific and nuanced analysis of particular market exposures, but also for innovation from index providers. What makes a good index benchmark? For an index to be a robust benchmark, it has to meet certain criteria. Indices provided a combined price level (and return level) for a basket of securities for use as a reference, benchmark or investment strategy. Whilst a reference point is helpful, the use of indices as benchmarks enables informed comparison of fund or portfolio strategies. An index can be used as a benchmark so long as it has the following qualities (known as the “SAMURAI” test based on the mnemonic based on key benchmark characteristics in the CFA curriculum). It must be:
Alternative weighting schemes Whereas traditional equity indices took a price-weighted, equal-weighted or market capitalisation weighted approach, there are a growing number of indices that have alternative weighting schemes: given the underlying securities are the same, these variation of weighting scheme also contributes to the high number of indices relative to underlying securities. The advent of growing data and computing power means that indices have become more granular to reflect investors desire for more nuanced exposures and alternative weighting methodologies . Whether indices are driven by investor needs for isolated asset class exposures or by other preferences, there is a growing choice of building blocks for portfolio constructors.
Index investing Whilst indices have traditionally been used for performance measurement, if the Efficient Markets Hypothesis holds true, it makes sense to use an index as an investment strategy. A fund that matches the weightings of the securities within an index is an index-tracking fund. The use of single or multiple funds that track indices to construct and manage a portfolio is called “index investing”. We define index investing as 1) using indices (whether traditional cap-weighted or alternatively weighted) to represent the various exposures used within a strategic or tactical asset allocation framework, and 2) using index-tracking ETFs to achieve access to that exposure and/or asset allocation. The advantages of index investing with ETFs are:
As index investors we have a choice of tools at our disposal. The primary choice is to whether to use Index Funds or ETPs to get access to a specific index exposure. Index funds and ETPs Exchange Traded Products (ETPs) is the overarching term for investment products that are traded on an exchange and index-tracking. There are three main sub-sets:
Individual investors are most likely to come across physical Exchange Traded Funds and some Exchange Traded Commodities such as gold. Professional investors are most likely to use any or all types of ETPs. Both individual and professional investors alike are using ETPs for the same fundamental purposes: as a precise quantifiable building block with which to construct and manage a portfolio. Index investors have the choice of using index funds or ETFs. Index funds are bought or sold from the fund issuer, not on an exchange. ETFs are bought or sold on an exchange. For individual investors index funds may not be available at the same price point as for institutional investors. Furthermore, the range of index funds available to individual investors is much less diverse than ETFs. Trading index funds takes time (approximately 4-5 days to sell and settle, 4-5 days to purchase, so 8-10 days to switch), whereas ETFs can be bought on a same-day basis, and cash from sales settles 2 days after trading reducing unfunded round-trip times to 4 days for switches. If stock brokers allow it, they may allow purchases of one transaction to take place based on the sales proceeds of another transaction so long as they both settle on the same day. The ability to trade should not be seen as an incentive to trade, rather it enables the timely reaction to material changes in the market or economy. For professional investors, some index funds are cheaper than ETFs. Where asset allocation is stable and long-term, index funds may offer better value compared to ETFs. Where asset allocation is dynamic and there are substantial liquidity or time-sensitive implementation requirements, ETFs may offer better functionality than index funds. Professional investors can also evaluate the use of ETFs in place of index futures . For significant trade sizes, a complete cost-benefit analysis is required. The benefit of the ETF approach being that futures roll can be managed within an ETF, benefitting from economies of scale. For large investors, detailed comparison is required in order to evaluate the relative merits of each. The benefits of using ETFs There are considerable benefits of using ETFs when constructing and managing portfolios. Some of these benefits are summarised below:
Summary There’s no such thing as “passive investing”. There is such a thing as “index investing” and it means adopting a systematic (rules-based), diversified and transparent approach to access target asset class, screened, factor or strategy exposures in a straightforward, or very nuanced way. It is the systematisation of the investment process that enables competitive pricing, relative to active, “non-index” funds. This is a trend which has a long way to run before any “equilibrium” between index and active investing is reached. Most investors, automatically enrolled into a workplace pension scheme are index investors without knowing it. The “instutionalisation of retail” means that a similar investment approach is permeating into other channels such as discretionary managers, financial advisers, and self-directed investors. © Elston Consulting 2020 all rights reserved Investors should prefer the certainty of index funds which track the index less passive fees, than the hope and disappointment of active funds which, in aggregate, track the index less active fees.
In this series of articles, I look at some of the key topics explored in my book “How to Invest With Exchange Traded Funds” that also underpin the portfolio design work Elston does for discretionary managers and financial advisers. Clarifying terms We believe that typically an index fund or ETF can perfectly well replace an active fund for a given asset class exposure. As with all disruptive technologies, many column inches have been dedicated to the “active vs passive” debate. However, with poorly defined terms, much of this is off-point. If active investing is referring to active (we prefer “dynamic”) asset allocation: we fully concur. There need be no debate on this topic. Making informed choices on asset allocation – either using a systematic or non-systematic decision-making process – is an essential part of portfolio management. If, however, active investing refers to fund manager or security selection, this is more contentious, and this should be the primary topic of debate. Theoretical context: the Efficient Market Hypothesis The theoretical context for this active vs passive debates is centred on the notion of market efficiency. The efficient market hypothesis is the theory that all asset prices reflect all the available past and present information that might impact that price. This means that the consistent generation of excess returns at a security level is impossible. Put differently, it implies that securities always trade at their fair value making it impossible to consistently outperform the overall market based on security selection. This is consistent with the financial theory that asset prices move randomly and thus cannot be predicted . Putting the theory into practice means that where markets are informationally efficient (for example developed markets like the US and UK equity markets), consistent outperformance is not achievable, and hence a passive investment strategy make sense (buying and holding a portfolio of all the securities in a benchmark for that asset class exposure). Where markets are informationally inefficient (for example frontier markets such as Bangladesh, Sri Lanka and Vietnam ) there is opportunity for an active investment strategy to outperform a passive investment strategy net of fees. Our view is that liquid indexable markets are efficient and therefore in most cases it makes sense to access these markets using index-tracking funds and ETFs, in order to obtain the aggregate return for each market, less passive fees. This is because, owing to the poor arithmetic of active management, the aggregate return for all active managers is the index less active fees. The poor arithmetic of active management Bill Sharpe, the Nobel prize winner, and creator of the eponymous Sharpe Ratio, authored a paper “The Arithmetic of Active Management” that is mindblowing in its simplicity, and is well worth a read. We all know the criticism of passive investing by active managers is that index fund [for a given asset class] delivers the performance of the index less passive fees so is “guaranteed” to underperform. That’s true, but it misses a major point. The premise of Sharpe’s paper is that the performance, in aggregate, of all active managers [for a given asset class] is the index less active fees. Wait. Read that again. Yes, that’s right. The performance of all active managers is, in aggregate (for a given asset class) the index less active fees. Sounds like a worse deal than an index fund? It’s because it is. How is this? Exploring the arithmetic of active Take the UK equity market as an example. There are approximately 600 companies in the FTSE All Share Index. Now imagine there are only two managers of two active UK equity funds, Dr. Star and Dr. Dog. Dr. Star consistently buys, with perfect foresight, the top 300 performing shares of the FTSE All Share Index each year, year in year out, consistently over time. This is because he avoids the bottom 300 worst performing shares. His performance is stellar. That means there are 300 shares that Dr. Star does not own, or has sold to another investor, namely to Dr. Dog. Dr. Dog therefore consistently buys, with perfect error, the worst 300 performing shares of the FTSE All Share Index each year, year in year out, consistently over time. His performance is terrible. However, in aggregate, the combined performance of Dr. Star and Dr. Dog is the same as the performance of the index of all 600 stocks, less Dr. Star’s justifiable fees, and Dr. Dog’s unjustifiable fees. The performance of both active managers is, in aggregate, the index less active fees. It’s a zero sum game. In the real world the challenge of persistency – persistently outperforming the index to be Dr.Star – means that over time it is very hard, in efficient markets to persistently outperform the index. So investors have a choice. They can either pay a game of hope and fear, hoping to consistently find Dr. Star as their manager. Or they can be less exciting, rational investor who focus on asset allocation and implement it using index fund to buy the whole market for a given asset exposure keep fees down. Given this poor “arithmetic” of active management, why would you ever chose an active fund (in aggregate, the index less active fees) over a passive fund (in aggregate the index less passive fees)? Quite. Monitoring performance consistency The inability of non-index active funds to consistently outperform their respective index is evidenced both in efficient market theory, and in practice. Consistent with the Efficient Market Hypothesis, studies have shown that actively managed funds generally underperform their respective indices over the long-run and one of the main determinant of performance persistency is fund expenses . Put differently, lower fee funds offer better value for money than higher fee funds for the same given exposure. This is a key focus area from the UK regulator as outlined in the Asset Management Market Study. In practice, the majority of GBP-denominated funds available to UK investors have underperformed a related index over longer time horizons. Whilst the percentage of funds that have beaten an index over any single year may fluctuate from year to year, no active fund category evaluated has a majority of outperforming active funds when measured over a 10-year period. This tendency is consistent with findings on US and European based funds, based on the regularly published “SPIVA Study”. The poor value of active managers who “closet index” “Closet indexing” is a term first formalised by academics Cremers and Petajisto in 2009 . It refers to funds whose objectives and fees are characteristic of an active fund, but whose holdings and performance is characteristic of a passive fund. Their study and metrics around “active share” and “closet indexing” caused a stir in the financial pages on both sides of the Atlantic as active fund managers started to watch the persistent rise of ETFs and other index-tracking products. The issue around closet index funds is not simply about fees. It’s as much about transparency and customer expectations. Understanding Active Share Active Share is a useful indicator developed by Cremers and Petajisto as to what extent an active (non-index) fund is indeed “active”. This is because whilst standard metrics such as Tracking Error look at the variability of performance difference, active share looks at to what extent the weight of the holdings within a fund are different to the weight of the holdings within the corresponding index. The higher the Active Share, the more likely the fund is “True Active”. The lower the Active Share, the more likely the fund is a “Closet Index”. How can you define “closet indexing”? There has been some speculation as to what methodology the Financial Conduct Authority (FCA) used to deem funds a “closet index”. In this respect, the European Securities and Markets Authority (ESMA), the pan-European regulator’s 2016 paper may be informative. Their study applied a screen to focus on funds with 1) assets under management of over €50m, 2) an inception date prior to January 2005, 3) Fees of 0.65% or more, and 4) were not marketed as index funds. Having created this screen, ESMA ran three metrics to test for a fund’s proximity to an index: active share, tracking error and R-Squared. On this basis, a fund with low active share, low tracking error and high R-Squared means it is very similar to index-tracking fund. Based on ESMA’s criteria, we estimate that between €400bn and €1,200bn of funds available across the EU could be defined as “closet index” funds. That’s a lot of wasted fees. Defining “true active” We believe there is an essential role to play for “true active”. By this we mean high conviction fund strategies either at an asset allocation level. True active (asset allocation level): at an asset allocation level, hedge funds which have the ability to invest across assets and have the ability to vary within wide ranges their risk exposure (by going both long and short and/or deploying leverage) would be defined as “true active”. Target Absolute Return (TAR) funds could also be defined as true active given the nature of their investment process. Analysing their performance or setting criteria for performance evaluation is outside the scope of this book. However given the lacklustre performance both of Hedge Funds in aggregate (as represented by the HFRX index) and of Target Absolute Return funds (as represented by the IA sector performance relative to a simple 60/40 investment strategy), emphasises the need for focus on manager selection, performance consistency and value for money. True active (fund level): we would define true active fund managers as those which manage long-only investments, either in hard-to-access asset classes or those which manage investments in readily accessible asset classes but in a successfully idiosyncratic way. It is the last group of “active managers” that face the most scrutiny as their investment opportunity set is identical to that of the index funds that they aim to beat. True active managers in traditional long-only asset classes must necessarily take an idiosyncratic non-index based approach. In order to do so, they need to adopt one or more of the following characteristics, in our view:
Their success, or otherwise, will depend on the quality of their skill and judgement, the quality of their internal research resource, and their ability to absorb and process information to exploit any information inefficiencies in the market. True active managers who can consistently deliver on objectives after fees will have no difficulty explaining their skill and no difficulty in attracting clients. By blending an ETF portfolio with a selection of true active funds, investors can reduce fees on standard asset class exposures to free up fee budget for genuinely differentiated managers. Summary In conclusion, “active” and “passive” are lazy terms. There is no such thing as passive. There is static and dynamic asset allocation, there is systematic and non-systematic tactical allocation, there is index-investing and non-index investing, there are traditional index weighting and alternative index weighting schemes. The use of any or all of these disciplines requires active choices by investors or managers. What kind of investor are you: a stock selector, a manager selector or an index investor?
In this series of articles, I look at some of the key topics explored in my book “How to Invest With Exchange Traded Funds” that also underpin the portfolio design work Elston does for discretionary managers and financial advisers. In previous articles, we looked at things to consider when designing a multi-asset portfolio. Let’s say, for illustration, an investor decides on a balanced portfolio invested 60% in equities and 40% in bonds. The “classic” 60/40 portfolio. You now have a number of options of how to populate the equity allocation within that portfolio. We look at each option in turn. Equity exposure using direct equities: “the stock selectors” This is the original approach, and, for some, the best. We call this group “Stock Selectors”: investors who prefer to research and select individual equities and construct, monitor and manage their own portfolios. To achieve diversification across a number of equities, a minimum of 30 stocks is typically required (at one event I went to for retail investors I was slightly nervous when it transpired that most people attending held fewer than 10 stocks in their portfolio). Across these 30 or more stocks, investors should give due regards to country and sector allocations. Some golden rules of stock picking would include:
The advantage of investing in direct equities is the ability to design and manage your own style, process and trading rules. Also by investing direct equities there are no management fees creating performance drag. But when buying and selling shares, there are of course transactional, and other frictional costs, such as share dealing costs and Stamp Duty. The most alluring advantage of this approach is the potential for index-beating and manager-beating returns. But whilst the potential is of course there, as with active managers, persistency is the problem. The more developed markets are “efficient” which means that news and information about a company is generally already priced in. So to identify an inefficiency you need an information advantage or an analytical advantage to spot something that most other investors haven’t. Ultimately you are participant in a zero-sum game, but the advantage is that if you can put the time, hours and energy in, it’s an insightful and fascinating journey. The disadvantage of direct equity is that if it requires at least 30 stocks to have a diversified portfolio, then it requires time, effort and confidence to select and then manage those positions. The other disadvantage is the lack of diversification compared to a fund-based approach (whether active or passive). This means that direct investors are taking “stock specific risks” (risks that are specific to a single company’s shares), rather than broader market risk. In normal markets, that can seem ok, but when you have occasional outsize moves owing to company-specific factors, you have to be ready to take the pain and make the decision to stick with it or to cut and run. What does the evidence say? The evidence suggests that, in aggregate, retail investors do a poor job at beating the market. The Dalbar study in the US, published since 1994, compares the performance of investors who select their own stocks relative to a straightforward “buy-and-hold” investment in an index funds or ETF that tracks the S&P500, the benchmark that consists of the 500 largest traded US companies. The results consistently show that, in aggregate, retail investors fare a lot worse than an index investor. Reasons for this could be for a number of reasons, including, but not limited to:
But selecting the “right” 30 or more stocks is labour-intensive, and time-consuming. So if you enjoy this and are confident doing this yourself, then there’s nothing stopping you. Indeed, you may be one of the few who can, or think you can, consistently outperform the index year in, year out. But it’s worth remembering that the majority of investors don’t manage to. For most people, a direct equity/direct bond portfolio is overly complex to create, labour intensive to manage and insufficiently diversified to be able to sleep well at night. Furthermore owning bonds directly is near impossible owing to the high lot sizes. So why bother? Investors who want to leave stock picking to someone else have two options to be “fund” investors selecting active funds. Or “index” investors selecting passive funds. Equity exposure using active funds: the “manager selectors” A fund based approach means holding a single investment in fund which in turn holds a large number of underlying equities, or bonds, or both. Investor who want to leave it to an expert to actively pick winners and avoid losers can pick an actively managed fund. We call this group “Manager Selectors”. But then you have to pick the “right” actively managed fund, which also takes time and effort to research and select a number of equity funds from active managers, or seek out “star” managers who aim to consistently outperform a designated benchmark for their respective asset class. And whilst we all get reminded that past performance is not an indicator of future performance, there isn’t much else to go by. In this respect access to impartial independent research and high quality,unbiased fund lists is an invaluable time-saving resource. The advantage of this approach that with a single fund you can access a broadly diversified selection of stocks picked by a professional. The disadvantage of this approach is that management fees are a drag on returns and yet few funds persistently outperform their respective benchmark over the long-run raising the question as to whether they are worth their fees. This is evidenced in a quarterly updated study known as the SPIVA Study, published by S&P Dow Jones Indices, which compares the persistency of active fund performance relative to asset class benchmarks. For efficient markets, such as US & UK equities, the results are usually quite sobering reading for those who are prefer active funds. Indeed many so-called active funds have been outed as “closet index-tracking funds” charging active-style fees, for passive-like returns. So of course there are “star” managers who are in vogue for a while or even for some time. But it’s more important to make sure a portfolio is properly allocated, and diversified across managers, as investors exposed to Woodford found out. In my view, an all active fund portfolio is overly expensive for what it provides. Whilst the debate around stock picking will run and run (and won’t be won or lost in this article), consider at least the bond exposures within a portfolio. An “active” UK Government Bond fund has the same or similar holdings to a “passive” index-tracking UK Government Bond fund but charges 0.60% instead of 0.20%, with near identical performance (except greater fee drag). Have you read about a star all-gilts manager in the press? Nor have I. So why pay the additional fee? What about hedge funds? Hedge funds come under the “true active” category because overall allocation exposure can vary greatly, and there is the ability to position a fund to benefit from falls or rises in securities or whole markets, and the ability to borrow money to invest more than the fund’s original value. But most “true active” hedge funds are not available to retail investors who are more limited to traditional “long-only” retail funds for each asset class. Equity exposure using index funds: the “index investor” Investors who don’ want the time, hassle or cost of picking active managers, or believe that markets are “efficient” often use passive index-tracking funds. We call this group “Index Investors” (full disclosure: I am a member of this group!). These are investors who want to focus primarily on getting the right asset allocation to achieve their objectives, and implement and actively manage that asset allocation but using low cost index funds and/or index-tracking ETFs. The advantage of this approach is transparency around the asset mix, broad diversification and lower cost relative to active managers. The disadvantage of this approach is that it sounds, well, boring. Ignoring the news on companies’ share prices are up or down and which single-asset funds are stars and which are dogs would mean 80% of personal finance news and commentary becomes irrelevant! On this basis, my preference is to be a 100% index investor – the asset allocation strategy may differ for the different objectives between my parents, myself and my kids. But the building blocks that make up the equity, bond and even alternative exposures within those strategies can all index-based. A blended approach Whilst my preference is to be an index investor, I don’t disagree, however, that it’s interesting, enjoyable and potentially rewarding for some retail investors and/or their advisers to spend time choosing managers and picking stocks, where they have high conviction and/or superior insight. Traditionally the bulk of retail investors were in active funds. This is extreme. More and more are becoming 100% index investors: this is also extreme. There’s plenty of ground for a common sense blended approach in the middle. For cost, diversification and liquidity reasons, I would want the core of any portfolio to be in index funds or ETFs. I would want the bulk of my equity exposure to be in index funds, with moderate active fund exposure to selected less efficient markets (for example) small caps, and up to 10% in a handful of direct equity holdings that you follow, know and like. What would a blended approach look like for a 60/40 equity/bond portfolio? 60% equity of which Min 70% index funds/ETFs Max 20% active funds Max 10% direct equity “picks”/ideas 40% bonds of which 100% index funds Summary For most investors, investing is something that needs to get done, like opening a bank account. If you are in this group then using a ready-made model portfolio or low-cost multi-asset fund, like a Target Date Fund, may make sense. For some investors, investing is more like a hobby – something that you are happy to spend time and effort doing. If you are in this group, you have to decide if you are a Stock Selector, Manager Selector or Index Investor, or a blend of all three, and research and build your portfolio accordingly. While there are no shortage of limitations and no “right” answers, portfolio theory nonetheless remains, rightly, the bedrock of traditional multi-asset portfolio design.
In this series of articles, I look at some of the key topics explored in my book “How to Invest With Exchange Traded Funds” that also underpin the portfolio design work Elston does for discretionary managers and financial advisers. Portfolio theory in a nutshell Portfolio theory, in a nutshell, is a framework as to how to construct an “optimised” portfolio using a range of asset classes, such as Equities, Bonds, Alternatives (neither equities nor bonds) and Cash. An “optimised” portfolio has the highest unit of potential return per unit of risk (volatility) taken. The aim of a multi-asset portfolio is to maximise expected portfolio returns for a given level of portfolio risk, on the basis that risk and reward are the flipside of the same coin. The introduction of “Alternative” assets, that are not correlated with equities or bonds (so that one “zigs” when the other “zags”), helps diversify portfolios, like a stabilizer. Done properly, this can help reduce portfolio volatility to less than the sum of its parts. Whilst the framework of Modern Portfolio Theory was coined by Nobel laureate Harry Markowitz in 1952, the key assumptions for portfolios theory – namely which asset classes, their returns, risk and correlations are, by their nature, just estimates. So using portfolio theory as a guide to designing portfolios is only as good as the quality of the inputs assumptions selected by the user. And those assumptions are ever-changing. Furthermore, the constraints imposed when designing or optimising a portfolio will determine the end shape of the portfolio for any given optimisation. And those constraints are subjective to the designer. So portfolio design is part art, part science, and part common sense. Whilst there are no shortage of limitations and no “right” answers, portfolio theory nonetheless remains, rightly, the bedrock of traditional multi-asset portfolio design. What differentiates multi-asset portfolios? A portfolio’s asset allocation is the key determinant of portfolio outcomes and the main driver of portfolio risk and return. Ensuring the asset allocation is aligned to an appropriate risk-return objective is therefore essential. Getting and keeping the asset allocation on track for the given objectives and constraints is how portfolio managers – whether of model portfolios or of multi-asset funds – can add most value for their clients. There are no “secrets” to asset allocation in portfolio management. It is perhaps one of the most well-studied and researched fields of finance. Stripping all the theory down to its bare bones, there are, in my view, three key decisions when designing multi-asset portfolios:
Strategic allocation is expected to answer the key questions of what are a portfolio’s objectives, and what are its constraints. The mix of assets is defined such as to maximise the probability of achieving those objectives, subject to any specified constraints. Objectives can be, for example:
Strategic allocations should be reviewed possibly each year and certainly not less than every 5 years. This is because assumptions change over time, all the time. Static vs Dynamic One of the key considerations when it comes to managing an allocation is to whether to adopt a static or dynamic approach. A strategy with a “static” allocation, means the portfolios is rebalanced periodically back to the original strategic weights. The frequency of rebalancing can depend on the degree of “drift” that is allowed, but constrained by the frictional costs involved in implementing the rebalancing. A strategy with a “dynamic” approach, means the asset allocation of the portfolios changes over time, and adapts to changing market or economic conditions. Dynamic or Tactical allocation, can be either with return-enhancing objective or a risk-reducing objective or both, or optimised to some other portfolio risk or return objective such as income yield. For very long-term investors, such as endowment funds, a broadly static allocation approach will do just fine. Where very long-term time horizons are involved, the cost of trading may not be worthwhile. As time horizons shorten, the importance of a dynamic approach becomes increasingly important. Put simply, if you were investing for 50 years, tactical tweaks around the strategic allocation, won’t make as big a difference as if you were investing for just 5 years. This is because risk (as defined by volatility) is different for different time frames, and is higher for shorter time periods, and lower for longer time periods. In a way this is also just common sense. If you are saving up funds to buy a house, you will invest those funds differently if you are planning to buy a house in 3 years or 30 years. Time matters so much as it impacts objectives and constraints, as well as risk and return. Access Preferences Managers need to make implementation decisions as regards how they access particular asset classes or exposures – with direct securities, higher cost active/non-index funds, or lower cost passive/index funds and ETFs. Fund level due diligence as regards underlying holdings, concentrations, round-trip dealing costs and internal and external fund liquidity profiles are key in this respect. The choice between direct equities, higher cost active funds or lower cost index funds is a key one and is the subject of a later article. Types of multi-asset strategy There is a broad range of multi-asset strategies available to investors, whose relevance depends on the investor’s needs and preferences. To self-directed investors, these multi-asset portfolios are made easier to access and monitor through multi-asset funds, many of which are themselves constructed wholly or partly with index funds and/or ETFs. We categorise multi-asset funds into the following groups (using our own naming conventions based on design: these do not exist as official “multi-asset sectors”, unfortunately): Relative Risk Relative risk strategies target a percentage allocation to equities so the risk and return of the strategy is in consistent relative proportion the (ever-changing) risk and return of the equity markets. This is the most common approach to multi-asset strategies. Put differently, asset weights drive portfolio risk. Examples include Vanguard LifeStrategy, HSBC Global Strategy and other traditional multi-asset funds. Target Risk Target risk strategies target a specific volatility level or range. This means the percentage allocation to equities is constantly changing to preserve a target volatility band. Put differently, portfolio risk objectives drive asset weights. Examples of this approach include BlackRock MyMap funds. Target Return Target return strategies target a specific return level in excess of a benchmark rate e.g. LIBOR, and take the required risk to get there. This is good in theory for return targeting, but results are not guaranteed. Examples of this approach include funds in the Target Absolute Return sector, such as ASI Global Absolute Return. Target Date Target Date Funds adapt an asset allocation over time from higher risk to lower, expecting regular withdrawals after the target date. This type of strategy works as “ready-made” age-based fund whose risk profile changes over time. Examples of target date funds include Vanguard Target Retirement Funds, and the Architas BirthStar Target Date Funds (managed by AllianceBernstein)*. Target Income Target income funds target an absolute level of income or a target distribution yield. Examples of this type of fund include JPMorgan Multi-Asset Income. Target Term Funds These exist in the US, but not the UK, and are a type of fund that work like a bond: you invest a capital amount at the beginning, receive a regular distribution, and then receive a capital payment at the end of the target term. For self-directed investors, choosing the approach that aligns best to your needs and requirements, and then selecting a fund within that sub-sector that has potential to deliver on those objectives – at good value for money – is the key decision for building a robust investment strategy. The (lack of) secrets The secret is, there are no secrets. Good portfolio design is about informed common senses. It means focusing on what will deliver on portfolio objectives and making sure those objectives are clearly identifiable by investors. Designing and building your own multi-asset portfolio is interesting and rewarding. Equally there are a range of ready-made options to chose from. The most important question is to consider to what extent a strategy is consistent with your own needs and requirements. * Note: funds referenced do not represent an endorsement or personal recommendation. Disclosure: until 2015, Elston was involved in the design and development of this fund range, but now receives no commercial benefit from these funds. |
ELSTON RESEARCHinsights inform solutions Categories
All
Archives
October 2023
|