

A recent ruling on DFM fees implied that VAT is not chargeable on intermediated Model Portfolio Service offered by a DFM. This throws into question when is VAT chargeable on DFM services and when isn’t it, and how, if at all, does it impact the VAT on advice. Whilst we are not tax lawyers, we try and disentangle the guidance as it stands today and what the recent ruling could mean, to help frame the right questions rather than provide definitive answers. First of all we need to break DFM services into 3 parts:
Non-intermediated Direct DFM service Where DFMs contract directly with clients to manage portfolios either on an advisory basis (seeking confirmation with client), or on discretionary basis (investing as the manager sees fit, for pre-agreed mandate), the VAT position seems clear-cut. The DFM fees are VAT-able. See HMRC manual VATFIN5800 for more information. Fund/security dealing commissions are VAT exempt where charged separately. If charged within a bundled “all-in” fee, the whole fee is VAT-able. For intermediated DFM fees, we have to consider two different types of DFM relationships – direct DFM (where DFM contracts with client directly to manage a portfolio in its custody), and platform-based MPS (where DFM contracts with platform to manage investments, and advisers “link” clients to that model). Intermediated Direct DFM service Where advisers introduce and monitors a “direct DFM” relationship – where the client contracts directly with the manager (albeit with the adviser’s involvement and fees are referenced in the contract), the VAT position is likely to be the same as above. Namely VAT on the DFM fee is chargeable. This is because the manager is providing a service directly to the client. Both the adviser and the manager have separate direct contractual relationships with the client. Importantly, because the adviser is introducing the client to a VAT-able service, the advice fees in relation to “direct DFM” services are also potentially VAT-able. See HMRC manual VATFIN7600 for more information. Intermediated MPS service Where advisers recommend and oversee a platform-based model portfolio service (MPS), the adviser’s fee may not be VAT-able, as it is an intermediation of a non-VATable service (the platform). The primary service the platform supplies in return for such fees (however comprised) are made up of the following functions:
HMRC’s position has been that charges for additional platform-based services, such as portfolio management services would be liable to VAT under VIN5800 above. However, although the details of the Tatton case are not public, it’s possible that Tatton sought to differentiate MPS service from direct-to-client DFM service and position it more as a quasi “fund” rather than an individual service. Under VAT5800, there is a clear exemption for the management of Specialist Investment Funds, such as authorised unit trusts and OEICs. This is outlined in more detail in VATFIN5100 If MPS can be viewed more like a “fund”, then it’s possible that model portfolios of funds could be added to this list of exemptions. Who does this ruling benefit? If this change is confirmed in guidance (rather than on a case-by-case basis), and other MPS-based DFMs can obtain similar refund, then it will be for those DFMs to decide whether to return those fees to clients. As Tatton was clear that it’s fee was gross, and any VAT costs were absorbed, it’s fair enough for Tatton to retain the refund – it took that risk and won. For DFMs that have specifically charged for VAT additionally, then expectations may be different. As well as providing good news for platform-based DFMs and their end-clients, any potential VAT exemption on MPS services is also good news for advisers that rely on an intermediation exemption from VAT on adviser fees. Some advisers fear that intermediating VAT-able DFM services on platform could potentially require them to charge VAT too. By intermediating a non-VAT-able MPS service, those advisers’ fees remain clearly non VAT-able. VAT and the value chain The only – broader – question remaining is that if the whole value chain – advice, platform, DFM MPS and underlying funds are relying on complex and potentially conflicting VAT exemptions, then there is a broader policy questions as to whether, when and why should VAT be paid on the advice and/or management of client’s investments, at some stage in the value chain. If the answer is no, never, that’s good news for the industry and clients alike, but I can’t believe that HMRC will be so knowingly or unknowingly generous for too long. Clarity needed Whilst HMRC won’t comment on individual cases, some further – clearer – guidance would be welcome. For clarity on this point, advisers should seek information from platform-based DFMs as regards their VAT status. DFMs should seek legal advice before revising their charging structure, and, if necessary, obtain case-specific guidance from HMRC. However given the gaps in the published guidance from HMRC, as outlined above – it would be helpful if their guidance could be tightened up too as MPS services are not explicitly referenced in guidance anywhere, which has allowed uncertainty to prevail.
The second quarter of 2020 saw a rebound in Global Equity markets with a total return of +17.6% in GBP terms. Unsurprisingly a 60/40 equity/bond portfolio captured approximately 60% of this upside with a total return of +11.2%. Of the multi-asset risk-based strategies we track, a Maximum Deconcentration approach (also known as an equal weight approach, because each asset class is equally weight), fared best with a return of +10.3%. By contrast a Min Variance approach and Risk Parity approach returned +9.0% and +5.7% respectively. Given their relative betas to Global Equity, the results are not surprising. Fig.1. Total Return (discrete quarter, GBP terms) 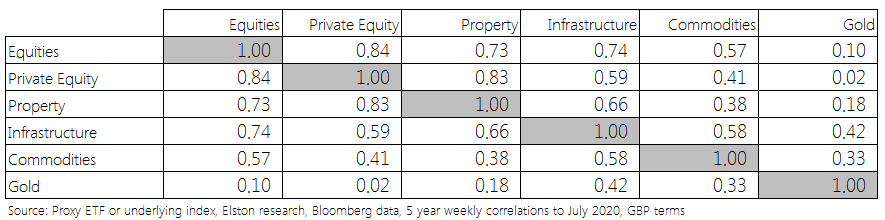 Risk-adjusted basis On a risk-adjusted 1 year basis, Risk Parity outperformed Global Equities, UK Bonds, a 60/40 portfolio and other multi-asset strategies. Fig.2. Risk-Return to 30-Jun-20 (1 year, GBP terms) 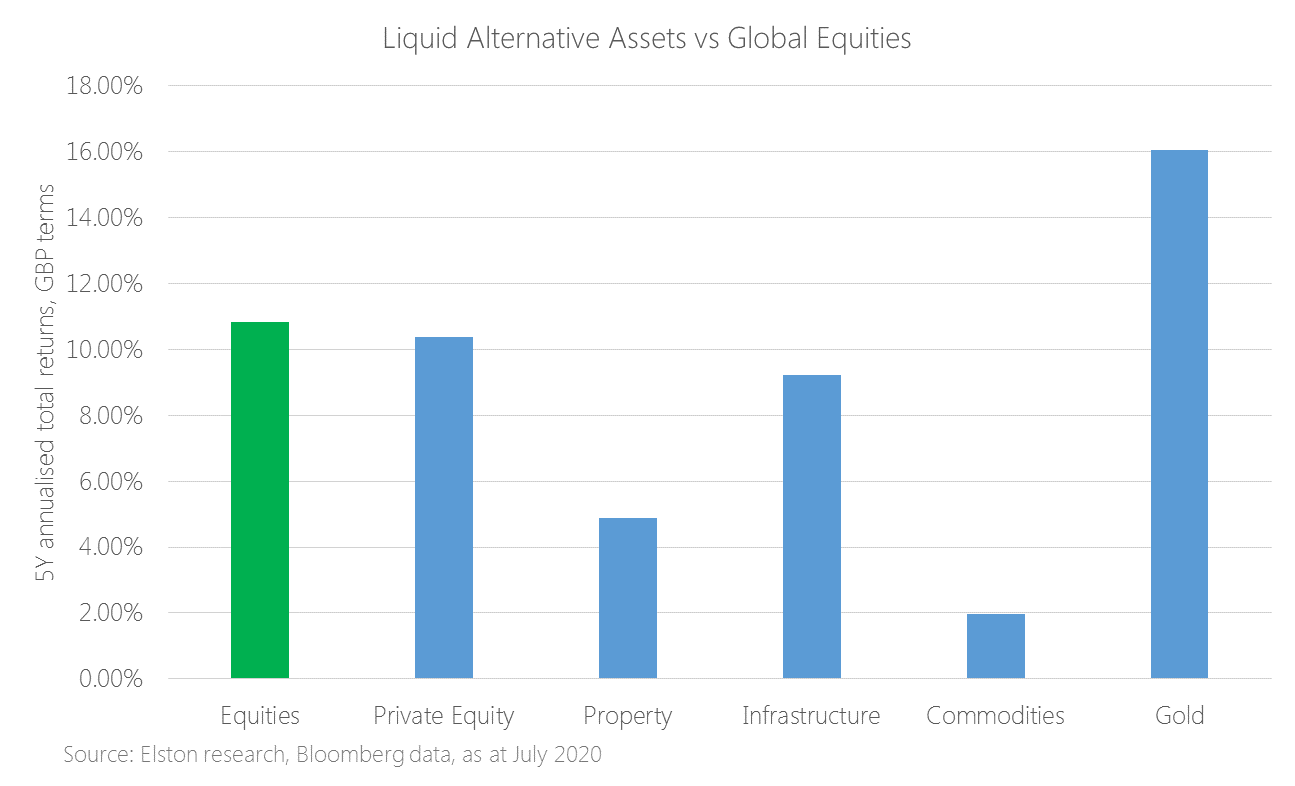 On a 5 year basis, Risk Parity also has the best risk-adjusted returns, with the highest Sharpe ratio at 0.94. Fig.3. Sharpe Ratio to 30-Jun-20 (5 year, GBP terms) 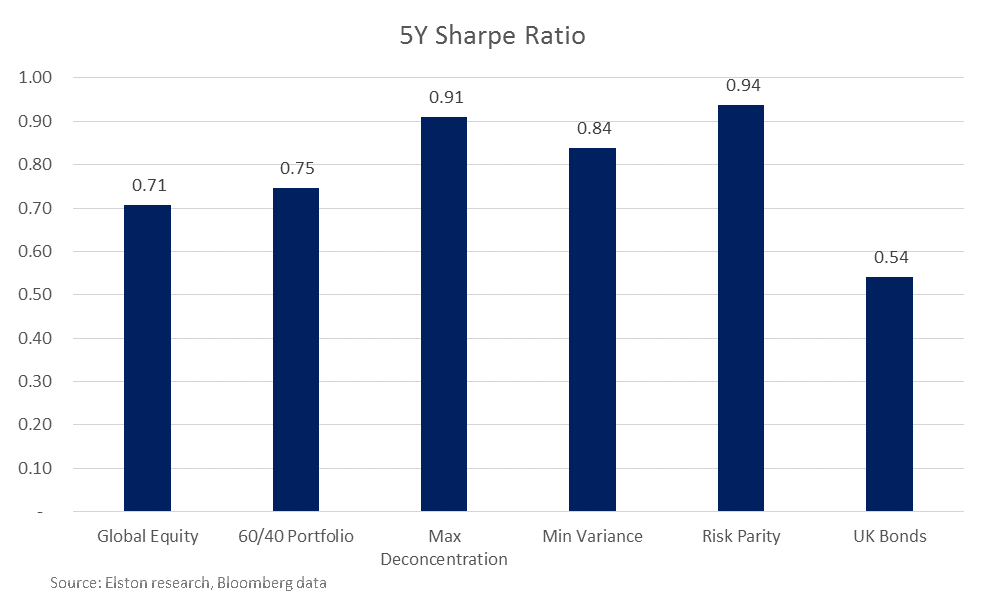 Risk-based strategies for “true diversification” If we define “true diversification” as combining two or more uncorrelated asset classes such that the combined volatility is less than its constituent parts, then a traditional 60/40 portfolio fails to deliver. We look at correlation reduction and beta reduction to articulate “differentiation impact”. The greater the reduction of both, the greater the differentiation. Over the 5 years to 30th June, a 60/40 portfolio (as represented by the Elston 60/40 GBP Index [ticker 6040GBP Index] delivers a reduction in Beta of -41.1% (broadly commensurate with its equity allocation), it only reduces correlation to Global Equities by -2.8%. Put differently a 60/40 portfolio is almost 100% correlated with Global Equities, and does not therefore provide “true” diversification. By contrast, a Risk Parity approach not only delivered better risk-adjusted returns, it also delivered “true diversification”. With a beta reduction of -78.3% and a correlation reduction of -46.6%. The Differentiation impact of the various multi-asset strategies is summarised below. Fig.4. Differentiation impact to 30-Jun-20 (5 year, GBP terms) 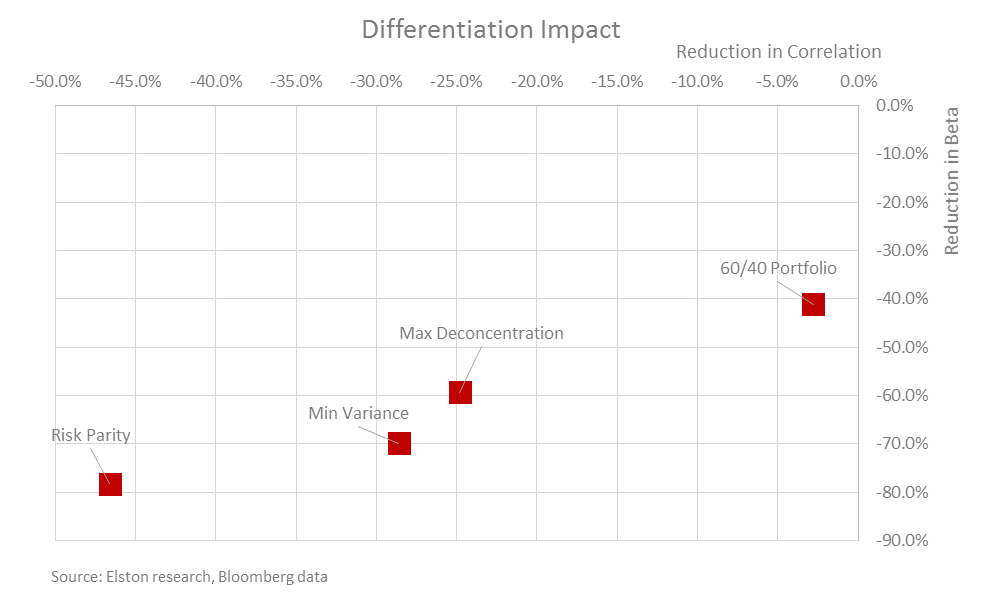 Summary
Max Deconcentration provided the highest level of returns in 2q20. On a 1, 3 and 5 year basis, Risk Parity offers better risk-adjusted returns. The differentiation impact is greatest for Risk Parity, relative to other multi-asset strategies for "true diversification". NOTICES Commercial Interest: Elston Consulting Limited creates research portfolios and administers indices that may or may not be referenced in this article. If referenced, this is clearly designated and is to raise awareness and provide purely factual information as regards these portfolios and/or indices. 
Targeted Absolute Return (TAR) funds were meant to be “all-weather” funds that could deliver returns in up markets, whilst protecting capital in down markets. If that sounds like a “goldilocks” strategy, it’s because it is. However, the way these funds-of-strategies are managed can be complex and/or opaque, and the performance has been inefficient. They are not delivering. Given there’s been a lot of bad weather globally in the first half of this year, we look at how four leading (by AUM) TAR funds have fared against our Elston Dynamic Risk Parity Index. Absolute Return funds Targeted Absolute Return funds are designed to fulfil a diversification function within a portfolio. This means performing in a way that is less or not correlated with equity markets, whilst offering greater return than cash or bonds. The portfolio construction approach to TAR funds differs from manager to manager. But the guiding principle is to achieve diversification by “spreading risk” across multiple, uncorrelated strategies, and “having the potential to make money in falling markets”. Risk-based strategies as an alternative Our view is that if the objective is diversification, a risk-based approach to portfolio construction makes sense, using strategies such as Risk Parity for diversification purposes. Risk Parity ensures “true diversification” by allowing the ever-changing risk characteristics of each asset class to determine portfolio weights, such that each asset class contributes equally to overall portfolio risk. Furthermore, by constructing the strategy as a straightforward “long-only” approach that does not use leverage, the holdings within the strategy are liquid, transparent and low-cost ETFs, whilst the dynamic weighting scheme is the tool for ensuring equal risk contribution and volatility constraint.
So how have the strategies fared? Relative Performance Year to date, through an extreme stress-test, absolute return strategies have underperformed a Risk Parity approach by 2-4.5%. Fig.1. YTD performance 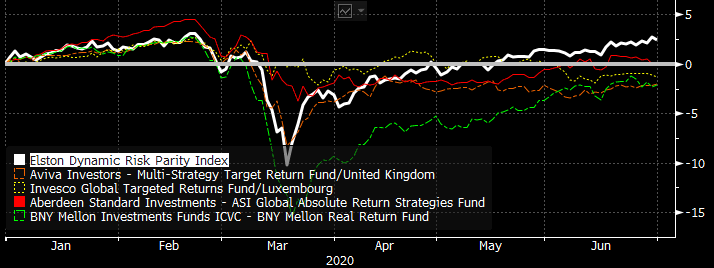 Source: Elston research, Bloomberg data. Total returns, GBP terms, as at end June 2020 On a 1 year view, these absolute return strategies have underperformed a Risk Parity approach by 6-8%. Fig.2. 1 year cumulative performance 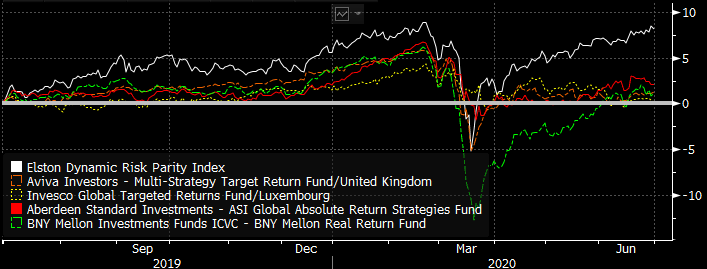 Source: Elston research, Bloomberg data. Total returns, GBP terms, as at end June 2020 On a 3 year view, these absolute return strategies have underperformed a Risk Parity approach by 7-20%. Fig.3. 3 year cumulative performance 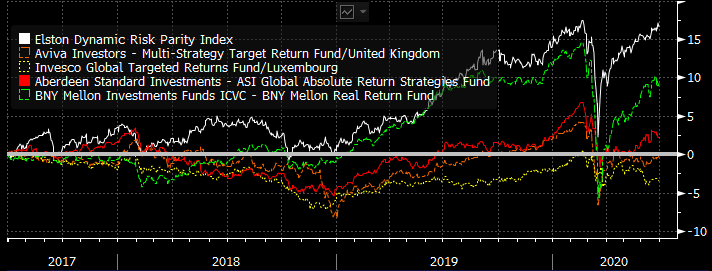 Source: Elston research, Bloomberg data. Total returns, GBP terms, as at end June 2020 Mixing metaphors: a goldilocks approach to an all-weather portfolio To achieve all-weather diversifier status is a tall order for any investment strategy. It requires a “goldilocks” portfolio that:
On this basis, our Risk Parity strategy fares well as a decorrelated “diversifier”, without foregoing returns, for a similar level of risk to TAR funds. What’s wrong with TAR funds? We can’t analyse the individual strategies within the funds, but in aggregate, the statistics below suggest that as a result of their complexity, TAR funds have potentially “over de-correlated”, with insufficient beta to capture the returns available for the risk (volatility) being taken. Findings are summarised in the table below. Fig.4. 3Y Performance Statistics 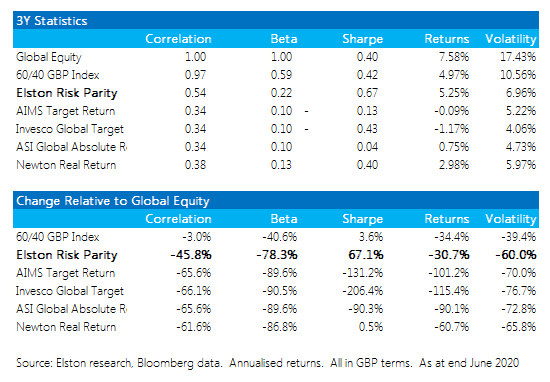 Risk-based strategies: an alternative to absolute return funds?
Targeted Absolute Return funds are opaque, complex and inefficient. Creating a true diversification strategy is challenging but achievable. A systematic risk-based approach that adapts to changing relationships between each asset classes is an alternative. By ensuring that each asset class contributes equally to the risk of the overall portfolio, without resorting to leverage, could provide a more dependable approach to incorporating a “true diversifier” into a portfolio, without necessarily compromising returns. NOTICES Commercial Interest: Elston Consulting Limited creates research portfolios and administers indices that may or may not be referenced in this article. If referenced, this is clearly designated and is to raise awareness and provide purely factual information as regards these portfolios and/or indices. 
Traditionally, UK pension fund managers and UK private client managers alike would have a bias towards home (i.e. UK) equities. Why is this, what does the research say and what does recent experience show? Understanding “home bias” First of all, what do we mean by home bias? We define home bias is allocating substantially more to the investor’s “home” market, relative to its capitalisation-based weight in a global equity index. Given the UK’s weight in global (developed markets + emerging markets) equity indices is now approximately 4% (it has been on a steady drift lower), any allocation above that level can be considered a home bias, from a UK investor’s perspective. Yet traditionally UK pension schemes and private client managers would split an equity allocation between broadly 50% UK and 50% international (ex-UK) equities. This represents a massive home equity bias, with a UK weight that is over 10x its market-cap based weight. Why does this home bias exist? The reasons given for such a massive home bias are typically the following:
We can look at each of these in turn. Firstly, we would argue that investing in equities is not for currency/liability matching, but for return seeking and inflation beating: in which case, the broader the opportunity set, the greater the potential for returns. Put differently, a UK only investor is not only wilfully or accidentally ignoring 96% of the opportunities available in equities, by value, but would also thereby miss out almost entirely on the technology revolution led by US companies, for example, or the demographic revolutions of emerging markets. So whilst a home bias makes sense for a bond portfolio (matching changes in inflation and interest rates), a home bias for equities does not. Secondly, whilst the largest UK companies within the FTSE 100 are indeed “global” in nature, the broader, and more diversified (by sector and constituents), all share index is not. Furthermore the sector allocation of the UK market is skewed by domestic giants, can be out of step with the sector allocation for world equity markets. A UK equity bias is therefore a structural bias towards Consumer Staples, Materials and Energy, and a structural bias against Information Technology. Fig. 1. Sector Comparison UK Equities relative to World Equities 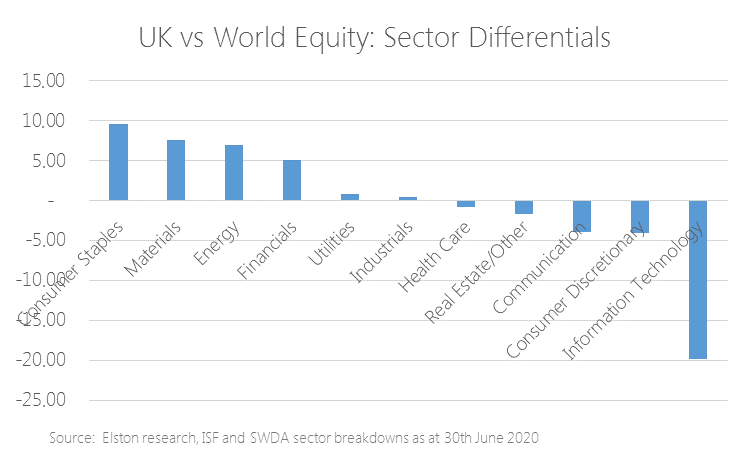 Thirdly, whilst it is indeed true that UK managers will be able to get more access and insight to UK companies than, say, an overseas-based manager, for portfolio managers who focus on asset allocation over security selection, this access to management is less relevant and less valuable. Whilst we can debate the detail of all three of these arguments, they are not individually or together enough to justify an allocation to UK equities that is over 10 times its market weight. This is not a question of a rational overweight, it’s simply an irrational bias. What does the research say? There has been extensive research into why individual investors and professional managers have a preference for creating an equity portfolio with a strong home bias[1]. French & Porterba (1991) observed the predominantly home equity bias of investors based on the domestic ownership shares (as at 1989) of the largest stock markets. In each case the high domestic ownership of each respective market implies a high home equity bias at that time: US (92.2%), Japan (95.7%), and the UK (92%), for example. In 1990 UK pension funds held 21% of their equity allocation in international equities from just 6% in 1979 (Howell & Cozzini 1990). Now the figure could be closer to 50%, or even higher. The shift away from home equity bias has been steady and pronounced in the UK institutional market, but is still ingrained. However, it’s worth noting that subsequent home bias research is written in the US. Given the US represents approximately 66% of the world equity market (a share that has been steadily increasing), the central tenet of that research is that home-biased US managers miss out on the diversification benefits and increased opportunity set available from investing in markets outside the US. Hence home-bias for a US manager creates a smaller “skew” vs Global Equities than it does for a UK manager. What is current practice? Whilst the institutional UK managers have been gradually reducing home bias within equity allocations, what about UK retail portfolio managers? We looked at the MSCI PIMFA Private Investor Indices[2] – and predecessor indices – to gain an insight as to what current asset allocation practice looks like for UK-based managers in the retail market. These weightings of these indices are “determined by the PIMFA Private Indices Committee, which is responsible for regularly surveying PIMFA members and reflecting in each index the industry’s collective view for each strategy objective”[3]. Based on the “Balanced” index (and predecessor indices[4]), within a typical balanced mandate, the allocation within the allocation equities have decreased from a 70/30 UK/international split in 2000, to a 48/52 split today (see Fig.2.). Whilst this reflects a reduction in the home equity bias, it is nonetheless a material bias towards UK equities by retail investment managers. Fig.2. UK/international equity split within an indicative UK retail balanced mandate 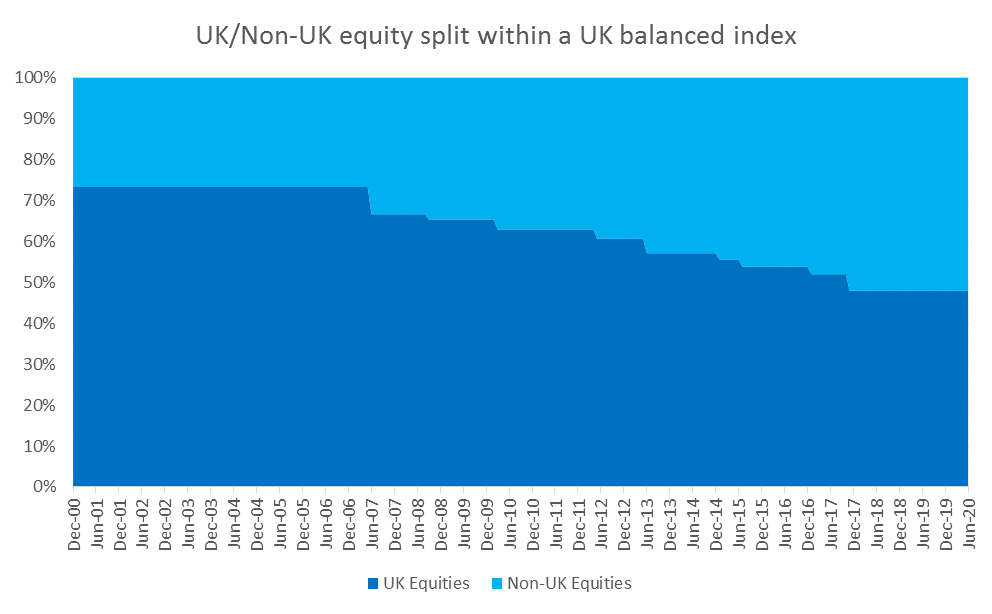 Source: Elston research, FTSE data, MSCI data In fairness, PIMFA has responded to this through the creation of a “Global Growth” index, which is 90% allocated to developed markets, and 10% allocated to emerging markets – so no UK home bias at all: but this is also a different risk profile to the Growth Index (100% equities, rather than 77.5% equities). Zimbabwean investors go global – UK investors should too We would make the case to advisers that if you were advising someone who lived in Zimbabwe, gut instinct would suggest that having the bulk of their equity allocation in Zimbabwean equities would feel like a poor and restrictive recommendation. After all, Zimbabwe makes up only a fraction of the global equity market. Without wanting to do UK plc down, the same gut instinct should apply to UK equities. If the UK is only 4% of global equities – why allocate much more than that? If you believe in equities for growth, it follows you believe in global equities to access that growth. Clients benefit from being shareholders in the changing mix of the world’s best and largest companies, not just the local champions. What does recent experience showing This debate was largely confined to theory given the relative stability of GBP to USD prior to Brexit. But given the dramatic currency weakness on the Brexit referendum, and the UK’s lack of exposure to the technology “winners” from the COVID-19 crisis, the disconnect between UK and Global Equity performance could not be more acute. Over the 5 years to 30th June, the FTSE All Share has delivered an annualised return of +2.87%p.a. in GBP terms, and MSCI World has delivered +7.53%p.a. in USD terms. That represents the difference in the performance of the underlying securities within those markets. Adjusting for currency effect too, and MSCI World has delivered +12.79%p.a. in GBP terms: an approximately 10ppt outperformance annually for 5 years. When expressed, in cumulative terms, the disconnect is more clear: over the 5 years to 30th June, the FTSE All Share has returned +15.22% in GBP terms, and MSCI World has delivered +43.80% in USD terms, and +82.66% in GBP terms: a 67.44% cumulative performance difference between those indexes, and the ETFs that track them. Fig.3. World vs UK Equity performance, 5Y to June 2020, GBP terms 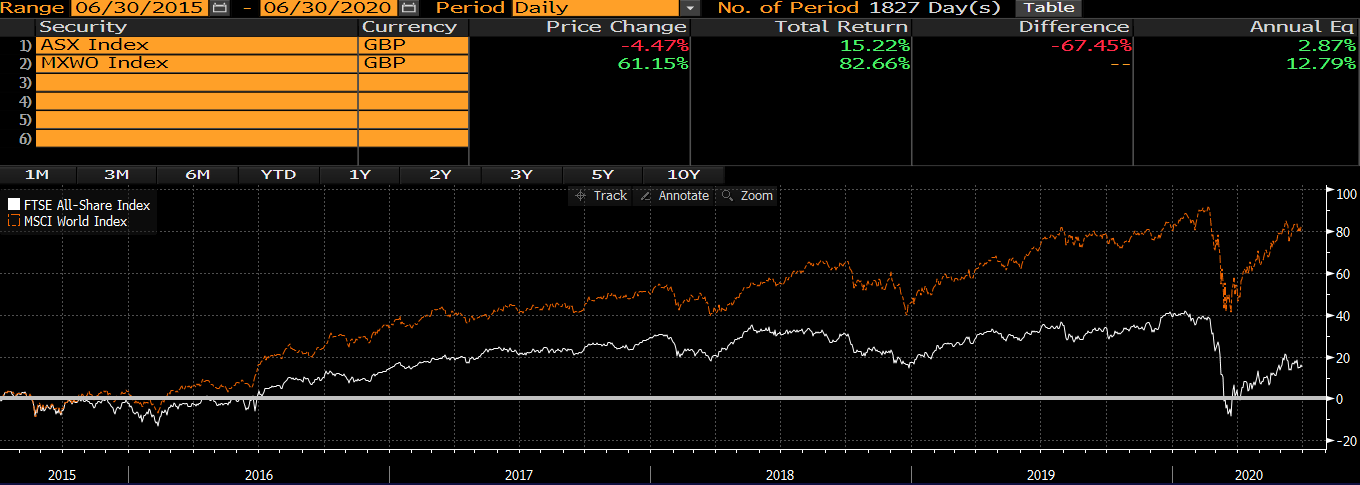 Source: FTSE All Share, MSCI World, Bloomberg data Delivering good portfolio returns is less about picking individual winners within each stock market, but making sure you have access to the right asset classes for the right reasons. Index funds and ETFs are a low-cost, liquid and transparent way of accessing those asset classes. UK multi-asset perspective From a multi-asset perspective, the performance difference between MSCI PIMFA Global Growth (100% equity, no home bias), MSCI PIMFA Growth (77.5% equity, with home bias) and other risk profiles is presented in Fig.4. below. Fig.4. MSCI PIMFA Private Investor Index Performance, 5Y to June 2020, GBP terms 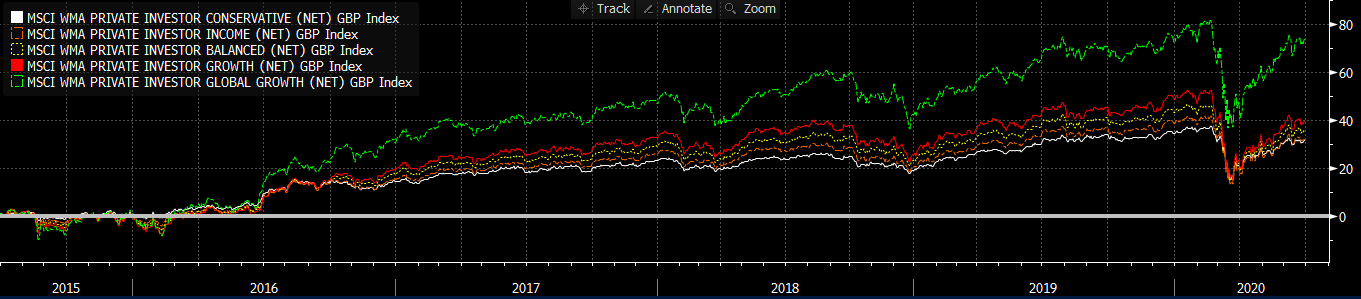 Source: MSCI PIMFA Private Investor Indices (formerly WMA), Bloomberg data The choice whether to embrace a UK home bias or avoid it has been critical and material and the main determinant of differences between multi-asset portfolio and multi-asset fund performance. The lack of UK home equity bias, is one of the key underpins of strong performance of the popular HSBC Global Strategy Portfolios and Vanguard LifeStrategy range, for example. A question of design Our preference for avoiding entirely any UK home bias for equities (but not for bonds) underpinned the construct of multi-asset funds and multi-asset portfolios that we have developed with and for asset managers. End investors in those products have benefitted from that key design parameter. Whilst we welcome managers launching global-bias multi-asset portfolios – it’s a bit late in the day as it won’t help their existing clients stuck in UK equities claw back the foregone performance of the last 5 years. The irony is that one of the reasons for the persistence of home equity bias is sustained by asset allocation providers used by wealth managers to construct multi-asset funds and portfolios. A closer interrogation of those research firms’ methodologies, parameters and constraints is required to think what makes best sense for end investors. Take action Looking to create your own investment strategy? Watch|Copy|Adapt our research portfolios Notes
[1] French, Kenneth; Poterba, James (1991). "Investor Diversification and International Equity Markets". American Economic Review. 81 (2): 222–226. JSTOR 2006858 [2] https://www.pimfa.co.uk/indices/ [3] https://www.pimfa.co.uk/about-us/pimfa-committees/private-investor-indices-committee/ [4] We define the predecessor indices to the MSCI PIMFA Private Investor Indices as: MSCI WMA Private Investor Indices, FTSE WMA Private Investor Indices, FTSE APCIMS Private Investor Indices Notices Image credit: Lunar Dragoon Commercial interest: Elston Consulting is a research and index provider promoting multi-asset research portfolios and indices. For more information see www.elstonetf.com Liquid Alt ETPs: success for alternative asset class exposure, less so for alternative strategies9/7/2020

Following the severe market turbulence of 2020, it’s worth taking a fresh look at “Liquid Alts” within the ETF space. What are Liquid Alternative ETFs? We define Liquid Alternative ETFs as any ETF that is:
Rise in popularity post GFC The increased popularity in the US of “Liquid Alts” came after the Global Financial Crisis and related liquidity crunch. Following the crisis, there was a demand for portfolio diversifiers that were an alternative to bonds, but with a keen focus on liquidity profile of the underlying holdings. In the US, the tradability of the ETF format meant that a broad range of “Liquid Alt” ETFs were launched, providing access to asset classes such as gold, commodities, and property securities, as well as long/short and more sophisticated “active” or systematic investment strategies packaged up within an ETF. Liquid Alts became in vogue. What about Liquid Alts in the UK? First we need to distinguish between the “type” of Liquid Alts available. We distinguish between those Liquid Alts that give exposure to an alternative asset class; and those that give exposure to an alternative asset allocation strategy. In the UK, following the financial crisis, we saw the launch of ETFs that gave exposure to alternative asset classes – gold, commodities, property, listed private equity, and infrastructure, for example. In this respect, the growth – in depth and breadth – of Liquid Alts has been impressive, particularly in the commodities and property sectors. But when it comes to Liquid Alts to deliver an alternative strategy, the ETP format has not been popular: the preferred format remains daily-dealing funds. Diversifier strategies, for example absolute return funds such as GARS, systematic trading strategies, long/short funds and funds-of-structured-products, have all been typically manufactured as funds in the UK rather than exchange traded products. Reviewing the marketing in 2016, we were expecting the range of Liquid Alt strategies available to UK investors to broaden both in the mutual fund format and the ETP format. As regards mutual funds, that has proven to be the case. As regards ETPs, Liquid Alt strategies have failed to catch on. Only a handful of liquid alternative strategy ETPs were launched, and they have largely failed to gain any traction. Why is this? Whilst straightforward Liquid Alt asset class ETPs have been successful in the UK, Liquid Alt strategy ETPs have failed to gain traction in the UK for 4 reasons, in our view:
Evaluating success: complexity fails To summarise, in the UK, within the Liquid Alt ETF space, the more straightforward a product, the more traction it’s got. Importantly, the reverse applies. “Straightforward” liquid alt ETFs Straightforward liquid alt ETFs provide liquid exposure to a specific asset class, or proxy for an asset class. Fig.1. Liquid Alternative Asset Classes 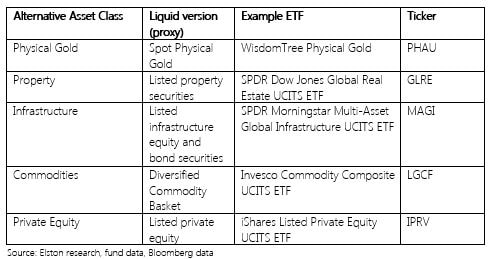 We find these “Liquid Alt” ETFs very useful building blocks to build in some diversifiers in a targeted and transparent way. “Complex” liquid alt ETFs The more complex liquid alt ETFs launched into the European market, have had far less success, and have ended up in the ETF graveyard.. Examples of complex strategies include: ETFs tracking a proxy of the HFRX Hedge Fund Index, an equity long/short ETF, and a market neutral ETF. Fig. 2. Liquid Alternative Strategies 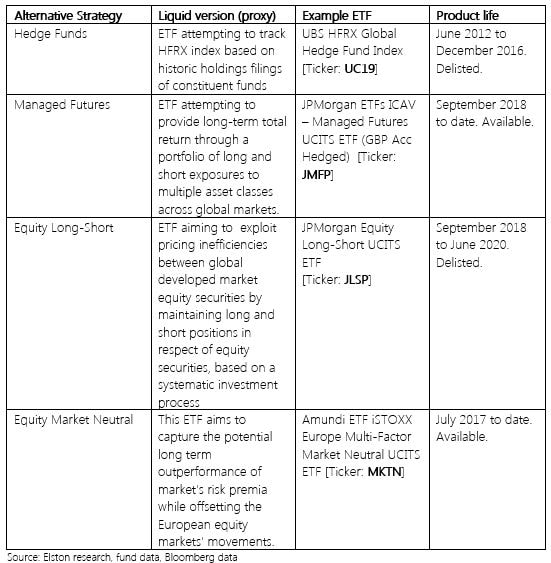 Liquidity lessons learned and relearned There were painful liquidity lessons learned in the 2008 GFC. Those liquidity lessons have been relearned for “less liquid alts” delivered by traditional fund formats, where investors were gated in direct property funds during Brexit in 2016 and Coronavirus this year. By comparison, investors who chose property securities ETFs as their “liquid” way of accessing that exposure experienced no such gating. Furthermore, the high profile gating of Woodford’s Equity Income fund and GAM absolute return bonds fund are further reminders as to why liquidity of the underlying asset, whether, within a fund or ETF, is so important. Where next? We see potential for increased competition in the single-asset class liquid alts, particularly infrastructure and listed private equity where there is little choice. Whilst we expect some ETF providers to continue to create liquid alt trading strategies, we are not convinced that ETPs are the best format for these diversifiers. Where we do expect innovation is in index-tracking funds that can be held on platform and provide a transparent, liquid and systematic approach to delivering true diversification strategies, as an alternative to opaque, higher cost absolute return funds. NOTICES Commercial Interest: Elston Consulting Limited creates research portfolios and administers indices that may or may not be referenced in this article. If referenced, this is clearly designated and is to raise awareness and provide purely factual information as regards these portfolios and/or indices. |
ELSTON RESEARCHinsights inform solutions Categories
All
Archives
July 2024
|
 RSS Feed
Company |
Solutions |
|