
The second quarter of 2020 saw a rebound in Global Equity markets with a total return of +17.6% in GBP terms. Unsurprisingly a 60/40 equity/bond portfolio captured approximately 60% of this upside with a total return of +11.2%. Of the multi-asset risk-based strategies we track, a Maximum Deconcentration approach (also known as an equal weight approach, because each asset class is equally weight), fared best with a return of +10.3%. By contrast a Min Variance approach and Risk Parity approach returned +9.0% and +5.7% respectively. Given their relative betas to Global Equity, the results are not surprising. Fig.1. Total Return (discrete quarter, GBP terms)  Risk-adjusted basis On a risk-adjusted 1 year basis, Risk Parity outperformed Global Equities, UK Bonds, a 60/40 portfolio and other multi-asset strategies. Fig.2. Risk-Return to 30-Jun-20 (1 year, GBP terms)  On a 5 year basis, Risk Parity also has the best risk-adjusted returns, with the highest Sharpe ratio at 0.94. Fig.3. Sharpe Ratio to 30-Jun-20 (5 year, GBP terms) 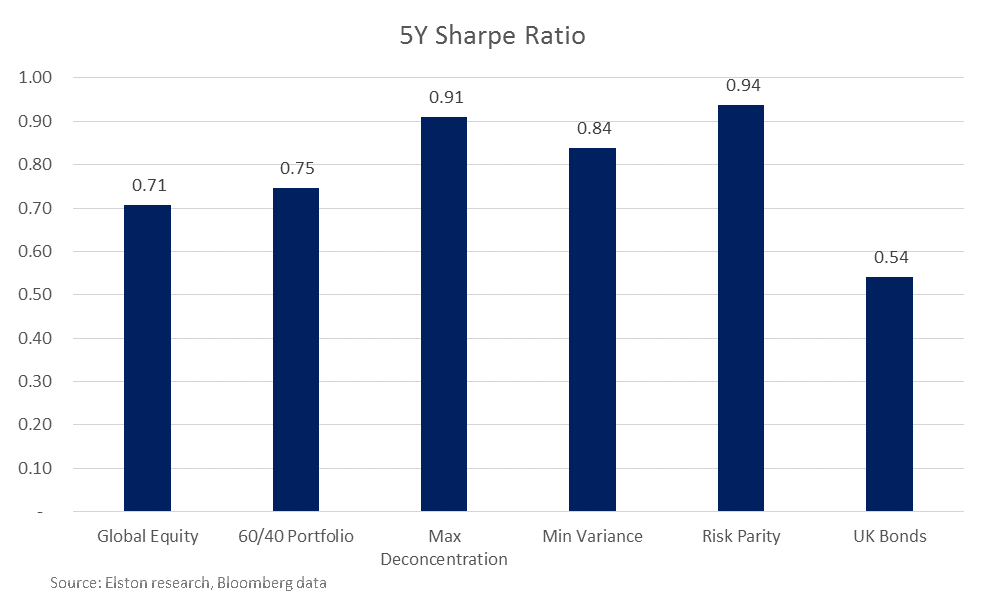 Risk-based strategies for “true diversification” If we define “true diversification” as combining two or more uncorrelated asset classes such that the combined volatility is less than its constituent parts, then a traditional 60/40 portfolio fails to deliver. We look at correlation reduction and beta reduction to articulate “differentiation impact”. The greater the reduction of both, the greater the differentiation. Over the 5 years to 30th June, a 60/40 portfolio (as represented by the Elston 60/40 GBP Index [ticker 6040GBP Index] delivers a reduction in Beta of -41.1% (broadly commensurate with its equity allocation), it only reduces correlation to Global Equities by -2.8%. Put differently a 60/40 portfolio is almost 100% correlated with Global Equities, and does not therefore provide “true” diversification. By contrast, a Risk Parity approach not only delivered better risk-adjusted returns, it also delivered “true diversification”. With a beta reduction of -78.3% and a correlation reduction of -46.6%. The Differentiation impact of the various multi-asset strategies is summarised below. Fig.4. Differentiation impact to 30-Jun-20 (5 year, GBP terms) 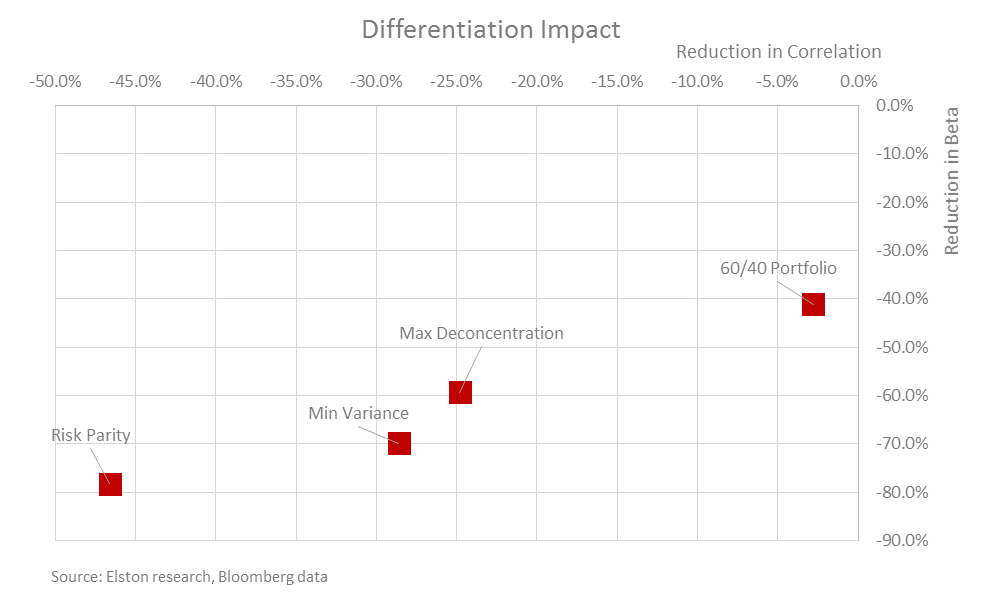 Summary
Max Deconcentration provided the highest level of returns in 2q20. On a 1, 3 and 5 year basis, Risk Parity offers better risk-adjusted returns. The differentiation impact is greatest for Risk Parity, relative to other multi-asset strategies for "true diversification". NOTICES Commercial Interest: Elston Consulting Limited creates research portfolios and administers indices that may or may not be referenced in this article. If referenced, this is clearly designated and is to raise awareness and provide purely factual information as regards these portfolios and/or indices. Comments are closed.
|
ELSTON RESEARCHinsights inform solutions Categories
All
Archives
July 2024
|
 RSS Feed
Company |
Solutions |
|