|
[5 min read, open as pdf]
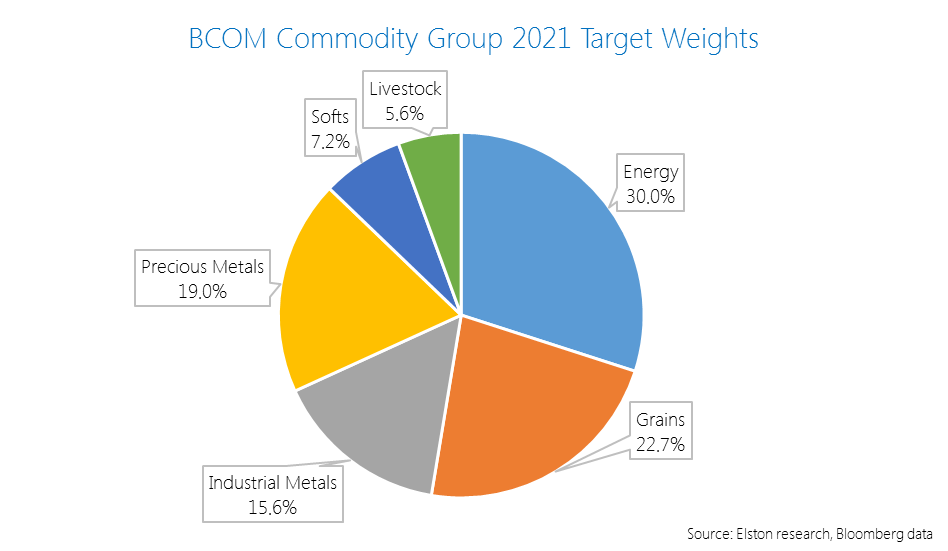
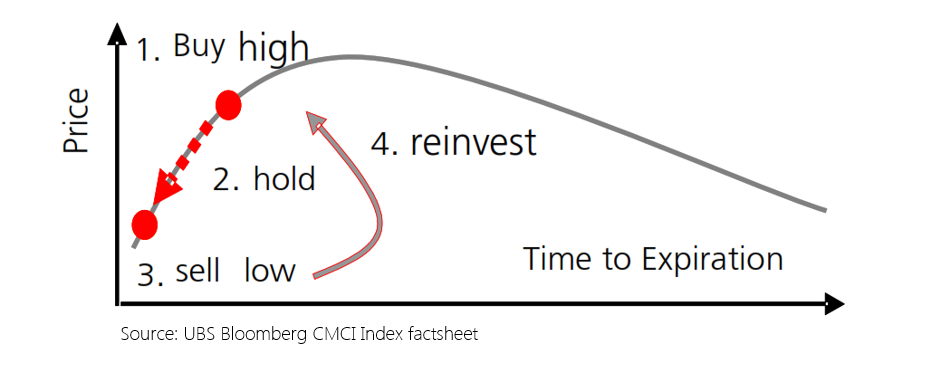
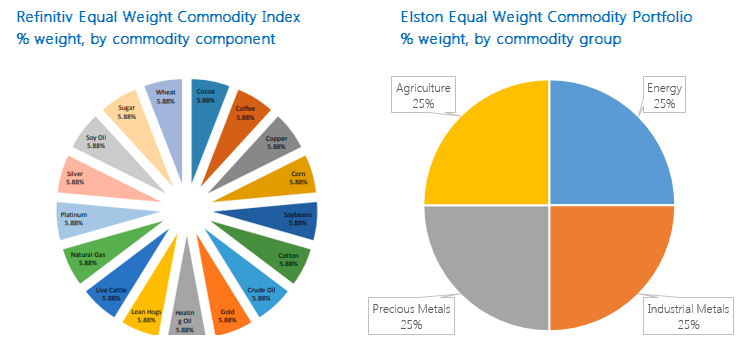
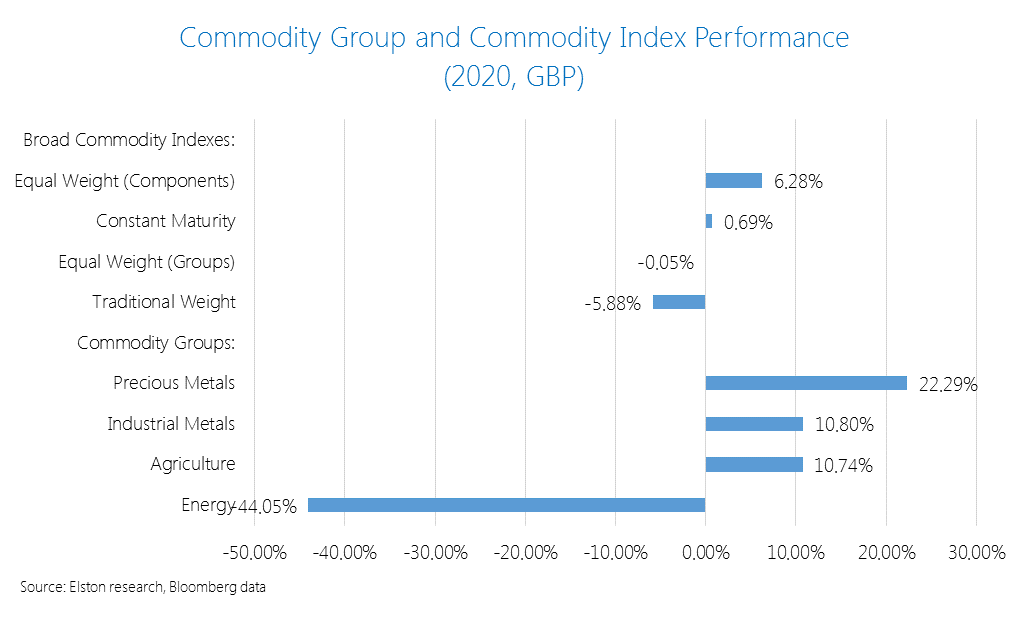
Commodity indices, and the ETPs that track them provide a convenient way of accessing a broad commodity basket exposure with a single trade. What’s inside the basket? Commodity indices represent baskets of commodities constructed using futures prices. The Bloomberg Commodity Index which was launched in 1998 as the Dow Jones-AIG Commodity Index has a weighting scheme is based on target weights for each commodity exposure. These weights are subject to the index methodology rules that incorporate both liquidity (relative amount of trading activity of a particular commodity) and production data (actual production data in USD terms of a particular commodity) to reflect economic significance. The index subdivides commodities into “Groups”, such as: Energy (WTI Crude Oil, Natural Gas etc), Grains (Corn, Soybeans etc), Industrial Metals (Copper, Aluminium etc), Precious Metals (Gold, Silver), Softs (Sugar, Coffee, Cotton) and Livestock (Live Cattle, Lean Hogs). The index rules include diversification requirements such that no commodity group constitutes more than 33% weight in the index; no single commodity (together with its derivatives) may constitute over 25% weight); and no single commodity may constitute over 15% weight. The target weights for 2021 at Group and Commodity level is presented below: Owing to changes in production and or liquidity, annual target weights can vary. For example the material change in weight in the 2021 target weights vs the 2020 target weights was a +1.6ppt increase in Precious Metals (to 19.0%) and a -1.9pp decrease in Industrial Metals to 15.6%. Traditional vs “Smart” weighting schemes One of the drawbacks of the traditional production- and liquidity-based weighting scheme is that they are constructed with short-dated futures contracts. This creates a risk when futures contracts are rolled because for commodities where the forward curve is upward sloping (“contango”), the futures price of a commodity is higher than the spot price. Each time a futures contract is rolled, investors are forced to “buy high and sell low”. This is known as “negative roll yield”. A “smart” weighting scheme looks at the commodity basket from a constant maturity perspective, rather than focusing solely on short-dated futures contracts. This approach aims to mitigate the impact of negative roll yield as well as potential for reduced volatility, relative to traditional indices. This Constant Maturity Commodity Index methodology was pioneered by UBS in 2007 and underpins the UBS Bloomberg BCOM Constant Maturity Commodity Index and products that track it. Illustration of futures rolling for markets in contango An Equal Weighted approach Whilst the traditional index construction considers economic significance in terms of production and liquidity, investors may seek alternative forms of diversified commodities exposure, such as Equal Weighted approach. There are two ways of achieving this, equal weighting each commodity, or equal weighting each commodity group. The Refinitiv Equal Weight Commodity Index equally weights each if 17 individual commodity components, such that each commodity has a 5.88% (1/17th) weight in the index. This results in an 18% allocation to the Energy Group, 47% allocation to the Agriculture group, 12% allocation to the Livestock group and 23% allocation to Precious & Industrial Metals. An alternative approach is to equally weight each commodity group. This is the approach we take in the Elston Equal Weight Commodity Portfolio, which has a 25% allocation to Energy, a 25% allocation to Precious Metals, a 25% Allocation to Industrial Metals and a 25% Allocation to Agricultural commodities. This is on the basis that commodities components within each group will behave more similarly than commodity components across groups. These two contrasting approaches are summarised below: Performance In 2020, the Equal Weight component strategy performed best +6.28%. The Constant Maturity strategy delivered +0.69%. The Equal Weight Group strategy was flat at -0.05% and the traditional index was -5.88%, all expressed in GBP terms. Informed product selection This summarises four different ways of accessing a diversified commodity exposure: traditional weight, constant maturity weighting, equal component weighting and equal group weighting. Understanding the respective strengths and weaknesses of each approach is an important factor for product selection. [3 min read, open as pdf]
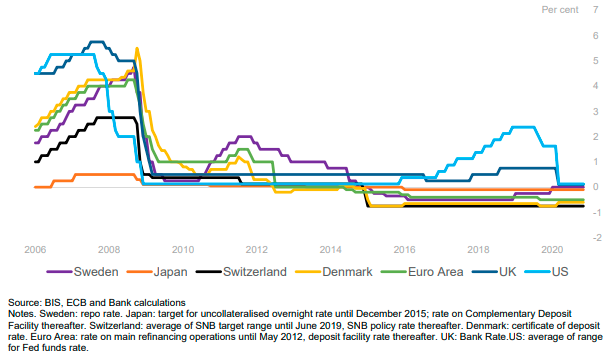
A “last resort” policy tool Zero & Negative Interest Rate Policy are Non-Traditional forms of Monetary Policy is a way of Central banks creating a disincentive for banks to hoard capital and get money flowing. Zero Interest Rate Policy (ZIRP) is when Central Banks set their “policy rate” (a target short-term interest rate such as the Fed Funds rate of the Bank of England Base Rate) at, or close to, zero. ZIRP was initiated by Japan in 1999 to combat deflation and stimulate economic recovery after two decades of weak economic growth. Negative Interest Rate Policy (NIRP) is when Central Banks set their policy rate below zero. Japan, Euro Area, Denmark, Sweden are currently using a NIRP. US & UK are currently using a ZIRP, and are considering a NIRP. Fig.1. Advanced economy policy rates Whilst bond prices may imply negative real yield, or negative nominal yields, a NIRP impacts the rates at which the Central Bank interact with the wholesale banking system and is intended to stimulate economic activity by disincentivising banks to hold cash and get money moving. A NIRP could translate to negative wholesale rates between banks, and negative interest rates on large cash deposits, but not necessarily retail lending rates (e.g. mortgages).
Ready, steady, NIRP Negative Interest Rates were used in the 1970s by Switzerland as an intervention to dampen currency appreciation. . It was the subject of academic studies and was seen as a last resort Non-Traditional Monetary policy during the Financial Crisis of 2008 and during the COVID crisis of 2020. Sweden adopted NIRP in 2009, Denmark in 2012, and Japan & Eurozone in 2014. The Fed started looking closely at NIRP in 2016. According Bank of England MPC minutes of 3rd March 2021, wholesale markets are generally prepared for negative interest rates as have already been operating in a negative yield environment. By contrast, retail banks may need more time to prepare for negative interest rates to consider aspect such as variable mortgage rates. There are arguments for and against NIRP. The main argument for is that NIRP is stimulatory. The main argument against is that NIRP failed to address stagnation and deflation in Japan and can create a “liquidity trap” where corporates hoard capital rather than spend and invest. The hunt for yield With negative interest rates, there will be an even greater hunt for yield. We look at the some of the options that advisers might be invited to consider.
Getting the balance right between additional non-negative income yield and additional downside risk will be key for investors and their advisers when preparing for and reacting to a NIRP environment. [3 min read, open as pdf]
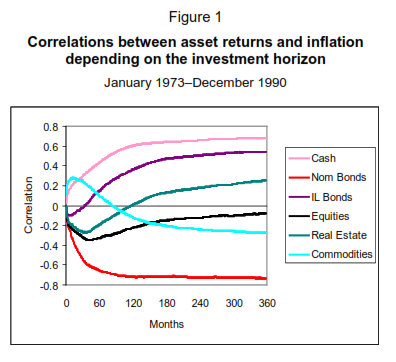
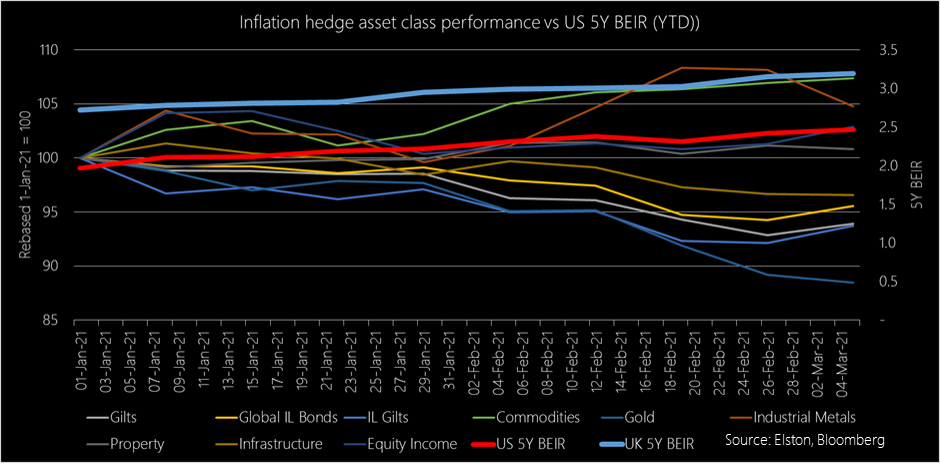
Focus on inflation In our recent Focus on Inflation webinar we cited the study by Briere & Signori (2011) looking at the long run correlations between asset returns and inflation over time. We highlighted the “layered” effect of different inflation protection strategies (1973-1990) with cash (assuming interest rate rises), and commodities providing best near-term protection, inflation linked bonds and real estate providing medium-term protection, and equities providing long-term protections. Nominal bonds were impacted most negatively by inflation. Source: Briere & Signori (2011), BIS Research Papers Given the growing fears of inflation breaking out, we plotted the YTD returns of those “inflation-hedge” asset classes, in GBP terms for UK investors, with reference to the US and UK 5 Year Breakeven Inflation Rates (BEIR). Figure 2: Inflation-hedge asset class performance (GBP, YTD) vs US & UK 5Y BEIR Source: Elston research, Bloomberg data, as at 5th March 2021
Winners and Losers so far We looked at the YTD performance in GBP of the following broad “inflation hedge” asset classes, each represented by a selected ETF: Gilts, Inflation Linked Gilts, Commodities, Gold, Industrial Metals, Global Property, Multi-Asset Infrastructure and Equity Income. Looking at price performance year to date in GBP terms:
So Inflation-Linked Gilts don’t provide inflation protection? Not in the short run, no. UK inflation linked gilts have an effective duration of 22 years, so are highly interest rate sensitive. Fears that inflation pick up could lead to a rise in interest rates therefore reduces the capital value of those bond (offset by greater level of income payments, if held to maturity). So whilst they provide medium- to long-term inflation protection, they are poor protection against a near-term inflation shock. Conclusion In conclusion, we observe:
|
ELSTON RESEARCHinsights inform solutions Categories
All
Archives
July 2024
|
Company |
Solutions |
|




 RSS Feed