Elston supports UK financial advisers CIP/CRP/MPS
  • WHO WE ARE
    • About
    • Our Journey
  • WHAT WE DO
    • Elston Portfolios >
      • Our Portfolios
      • Adaptive Portfolios
      • Retirement Portfolios
      • Sustainable Portfolios
      • Multi-Asset Income
      • All Weather Portfolio UK
      • Money Market Portfolio
    • Custom Portfolios >
      • Custom Portfolios
    • CGT Solutions >
      • Our CGT Solutions
      • GIA Portfolios
      • Onshore Bonds
      • Direct Gilts
    • Adviser Support >
      • Our Adviser Support
      • CIRP
      • Investment Committee Support
      • Regulatory Support
      • Analytics, Factsheets & Reporting
      • CPD
    • Fund Solutions >
      • Our Funds
      • Custom Funds
    • Index Solutions >
      • Our Indices
      • Sector Equal Weight
      • UK Equity Income
      • Liquid Real Assets
      • Gold and Precious Metals
      • Custom Indices
  • WHO WE HELP
    • Financial Advisers
    • Discretionary Managers
  • Insights
  • Contact

Asset Allocation Research for UK Advisers

Know your Commodity basket

19/3/2021

 
Picture
[5 min read, open as pdf]

  • We look at Commodity Index basket weighting schemes
  • Compare Traditional vs “Smart” weighting schemes
  • Contrast equal weighted approaches
 
Commodity indices, and the ETPs that track them provide a convenient way of accessing a broad commodity basket exposure with a single trade. 
​
What’s inside the basket?
Commodity indices represent baskets of commodities constructed using futures prices.  The Bloomberg Commodity Index which was launched in 1998 as the Dow Jones-AIG Commodity Index has a weighting scheme is based on target weights for each commodity exposure.

These weights are subject to the index methodology rules that incorporate both liquidity (relative amount of trading activity of a particular commodity) and production data (actual production data in USD terms of a particular commodity) to reflect economic significance.

The index subdivides commodities into “Groups”, such as: Energy (WTI Crude Oil, Natural Gas etc), Grains (Corn, Soybeans etc), Industrial Metals (Copper, Aluminium etc), Precious Metals (Gold, Silver), Softs (Sugar, Coffee, Cotton) and Livestock (Live Cattle, Lean Hogs).

The index rules include diversification requirements such that no commodity group constitutes more than 33% weight in the index; no single commodity (together with its derivatives) may constitute over 25% weight); and no single commodity may constitute over 15% weight.

The target weights for 2021 at Group and Commodity level is presented below: 
Picture
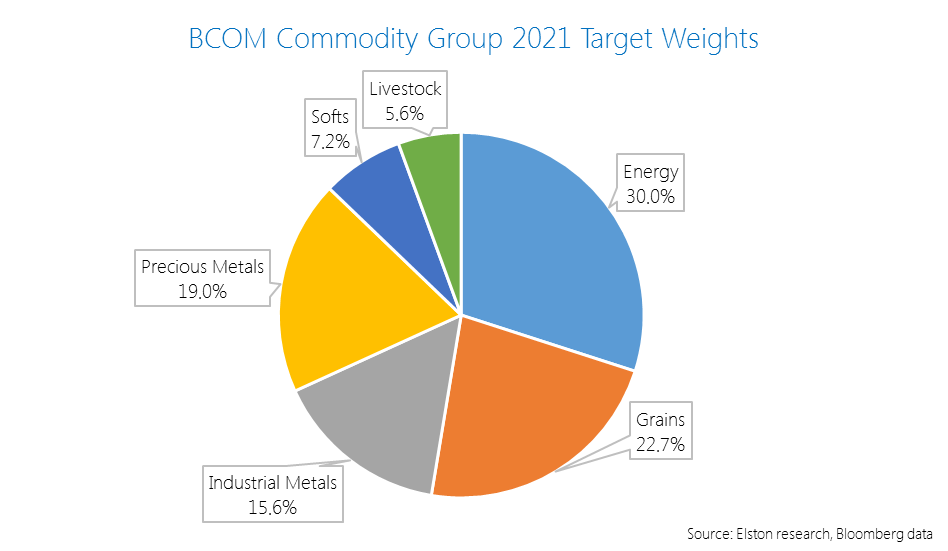
Owing to changes in production and or liquidity, annual target weights can vary.  For example the material change in weight in the 2021 target weights vs the 2020 target weights was a +1.6ppt increase in Precious Metals (to 19.0%) and a -1.9pp decrease in Industrial Metals to 15.6%.

Traditional vs “Smart” weighting schemes
One of the drawbacks of the traditional production- and liquidity-based weighting scheme is that they are constructed with short-dated futures contracts.  This creates a risk when futures contracts are rolled because for commodities where the forward curve is upward sloping (“contango”), the futures price of a commodity is higher than the spot price.  Each time a futures contract is rolled, investors are forced to “buy high and sell low”.  This is known as “negative roll yield”.

A “smart” weighting scheme looks at the commodity basket from a constant maturity perspective, rather than focusing solely on short-dated futures contracts.  This approach aims to mitigate the impact of negative roll yield as well as potential for reduced volatility, relative to traditional indices.
​
This Constant Maturity Commodity Index methodology was pioneered by UBS in 2007 and underpins the UBS Bloomberg BCOM Constant Maturity Commodity Index and products that track it.

Illustration of futures rolling for markets in contango
Picture
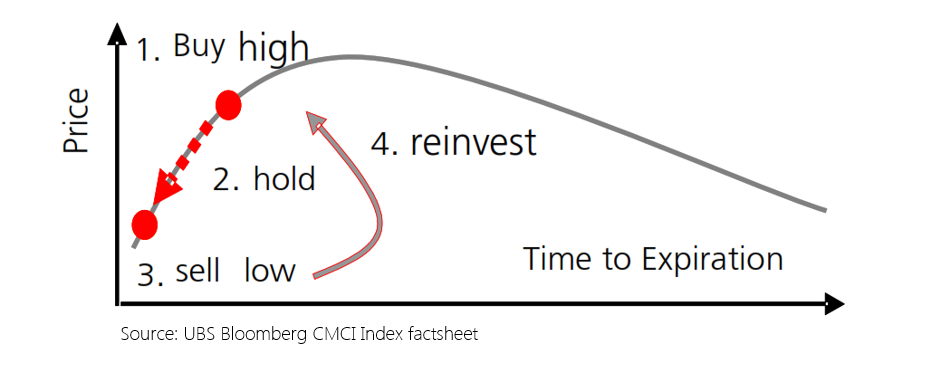
An Equal Weighted approach
Whilst the traditional index construction considers economic significance in terms of production and liquidity, investors may seek alternative forms of diversified commodities exposure, such as Equal Weighted approach.

There are two ways of achieving this, equal weighting each commodity, or equal weighting each commodity group.

The Refinitiv Equal Weight Commodity Index equally weights each if 17 individual commodity components, such that each commodity has a 5.88% (1/17th) weight in the index.  This results in an 18% allocation to the Energy Group, 47% allocation to the Agriculture group, 12% allocation to the Livestock group and 23% allocation to Precious & Industrial Metals.

​An alternative approach is to equally weight each commodity group.  This is the approach we take in the Elston Equal Weight Commodity Portfolio, which has a 25% allocation to Energy, a 25% allocation to Precious Metals, a 25% Allocation to Industrial Metals and a 25% Allocation to Agricultural commodities.  This is on the basis that commodities components within each group will behave more similarly than commodity components across groups.

These two contrasting approaches are summarised below:
Picture
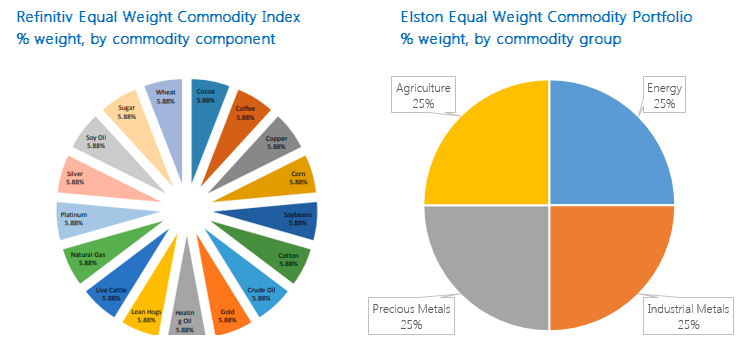
​Performance
In 2020, the Equal Weight component strategy performed best +6.28%.  The Constant Maturity strategy delivered +0.69%.  The Equal Weight Group strategy was flat at -0.05% and the traditional index was -5.88%, all expressed in GBP terms.
Picture

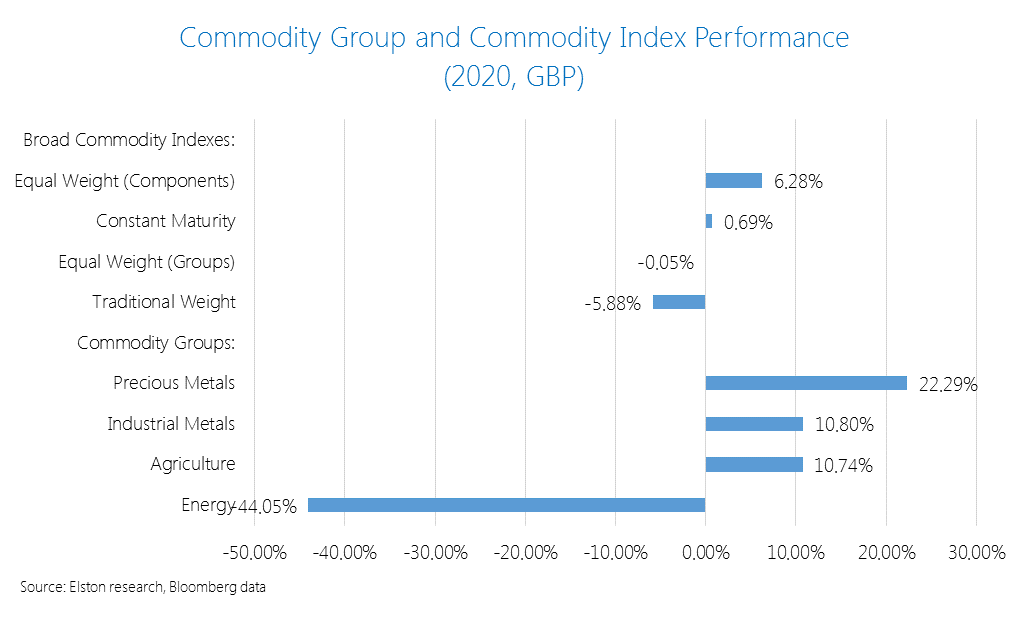
​Informed product selection

This summarises four different ways of accessing a diversified commodity exposure: traditional weight, constant maturity weighting, equal component weighting and equal group weighting.  Understanding the respective strengths and weaknesses of each approach is an important factor for product selection.

Comments are closed.

    ELSTON RESEARCH

    insights inform solutions

    Get our weekly newsletter

    Categories

    All
    All Weather Portfolio
    Alternative Assets
    Alternative Strategies
    Bonds
    Business Practice
    Capital Market Assumptions
    CPD
    Direct Gilts
    Equities
    Equity Income
    Equity Sectors
    ESG
    ETFs
    Evidence Based Investing
    Factor Investing
    Geopolitics
    Gold & Precious Metals
    Guide To Investing
    Index Investing
    Inflation
    Investment Trusts
    Macro
    MULTI ASSET
    Multi Asset Income
    Net Zero
    Outlook
    Permanent Portfolio
    Podcast
    Portfolio Construction
    Private Markets
    Real Assets
    Retirement Investing
    Risk Parity
    Thematic Investing
    Value Factor
    Video

    Archives

    June 2025
    May 2025
    April 2025
    March 2025
    February 2025
    January 2025
    December 2024
    November 2024
    October 2024
    September 2024
    August 2024
    July 2024
    June 2024
    May 2024
    April 2024
    March 2024
    February 2024
    January 2024
    December 2023
    November 2023
    October 2023
    September 2023
    August 2023
    July 2023
    June 2023
    May 2023
    April 2023
    March 2023
    February 2023
    January 2023
    December 2022
    November 2022
    October 2022
    September 2022
    August 2022
    July 2022
    June 2022
    May 2022
    April 2022
    March 2022
    February 2022
    January 2022
    December 2021
    November 2021
    October 2021
    September 2021
    August 2021
    July 2021
    June 2021
    May 2021
    April 2021
    March 2021
    February 2021
    January 2021
    December 2020
    November 2020
    October 2020
    September 2020
    August 2020
    July 2020
    June 2020
    May 2020
    April 2020
    March 2020
    February 2020
    January 2020
    December 2019
    November 2019
    September 2019
    June 2019
    April 2019
    March 2019
    February 2019
    January 2019
    December 2018
    November 2018
    October 2018
    September 2018
    August 2018
    July 2018
    June 2018
    May 2018
    April 2018
    March 2018
    February 2018
    January 2018
    December 2017
    November 2017
    October 2017
    July 2017
    May 2017
    March 2017
    February 2017
    January 2017
    November 2016
    October 2016
    September 2016
    July 2016
    June 2016
    May 2016
    February 2016
    January 2016
    August 2015
    June 2015
    January 2014
    June 2012

    RSS Feed

Company
Home
About
​Our Journey
​​​Contact
Terms of Use
​Our Solutions
​​Insights
​Our Portfolios
Custom Portfolios
​Retirement Portfolios
Our CGT Solutions
Our Funds
Custom Funds
Our Indices
Custom Indices
​Adviser Support
CIRP
Investment Committee Support
Regulatory Support
Analytics, Factsheets & Reporting
CPD


By client type:
For Advisers
For Discretionary Managers


© COPYRIGHT 2012-25. ALL RIGHTS RESERVED.
 Elston Consulting Limited (Company Registration Number 07125478) is registered in
England & Wales, Registered address:  1 King William Street, London EC4N 7AF
  • WHO WE ARE
    • About
    • Our Journey
  • WHAT WE DO
    • Elston Portfolios >
      • Our Portfolios
      • Adaptive Portfolios
      • Retirement Portfolios
      • Sustainable Portfolios
      • Multi-Asset Income
      • All Weather Portfolio UK
      • Money Market Portfolio
    • Custom Portfolios >
      • Custom Portfolios
    • CGT Solutions >
      • Our CGT Solutions
      • GIA Portfolios
      • Onshore Bonds
      • Direct Gilts
    • Adviser Support >
      • Our Adviser Support
      • CIRP
      • Investment Committee Support
      • Regulatory Support
      • Analytics, Factsheets & Reporting
      • CPD
    • Fund Solutions >
      • Our Funds
      • Custom Funds
    • Index Solutions >
      • Our Indices
      • Sector Equal Weight
      • UK Equity Income
      • Liquid Real Assets
      • Gold and Precious Metals
      • Custom Indices
  • WHO WE HELP
    • Financial Advisers
    • Discretionary Managers
  • Insights
  • Contact