
 [3 min read, open as pdf]
Watch the CISI-endorsed CPD webinar on this topic  [3 min read, open as pdf]
 [5 min read, open as pdf]
 [5 min read, open as pdf]
A private market allocation is structurally hard to reverse if things go wrong with any of 1) the investor’s liquidity needs, 2) the private market fund’s underlying investments, or 3) the realised returns relative to risk-free investments (e.g. gilts) for a given term. As such, an allocation to private markets should be seen more like an irreversible decision, unlike almost all other investments available to institutional investors which can be sold at a day, week or month’s notice. In this brief note, we do not set out the case for investing in private markets – that has been set out extensively elsewhere. We do however raise some points of challenge to those stated advantages. [Read full paper as pdf] 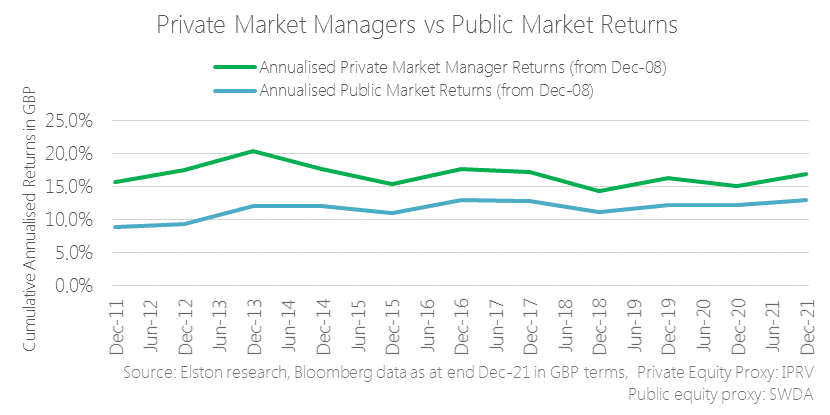 [3 min read, open as pdf]
Estimating the “illiquidity premium” of private markets versus public markets is complex and cannot be done using public data. As an alternative we focus on the returns premium of private market managers to public markets. By comparing the performance of listed private market managers (whose shares are publicly traded) to a mainstream public markets benchmark, we can get a picture of the liquid return premium of the sector as a whole, relative to public markets. Read the article in full as pdf Watch the CPD webinar on this topic  [5 min read, open as pdf]
In our 2022 outlook, we explained why inflation will remain hotter for longer and will settle above pre-pandemic levels. Advisers should consider how to adapt portfolios for inflation across each asset class – equities, bonds and alternatives. Research demonstrates how different asset classes exhibit different degrees of inflation protection over different time-frames. Equities therefore provide a long-term inflation hedge.
In this article, we explore how to adapt portfolios for inflation within and across each asset class: Equities, Bonds and Alternatives. For full article, read as pdf 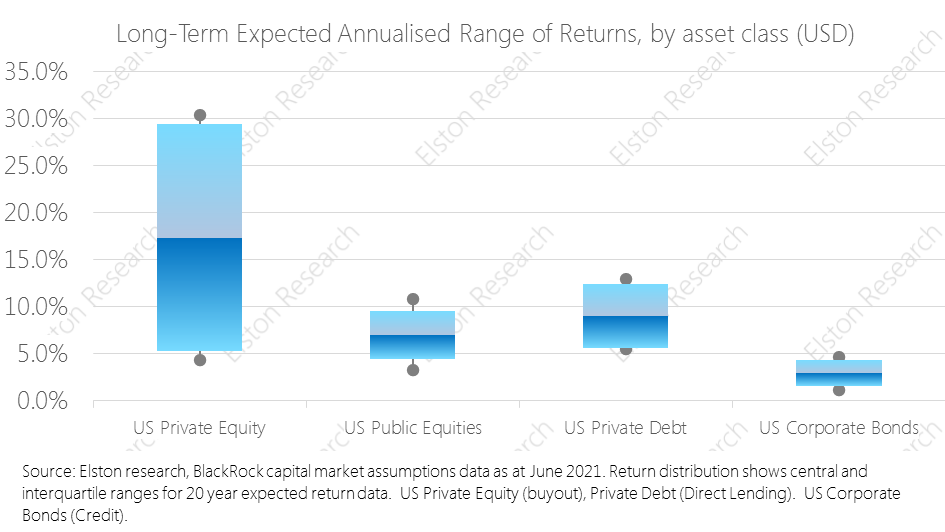 The illiquidity premium is the additional rewarded risk associated with holding an illiquid investment.
One of the attractions of private markets relative to public markets is the trade-off between enhanced returns and reduced liquidity, known as the “illiquidity premium”. Private market deals often require investors’ money to be “locked up” (i.e. non-realisable and cannot be withdrawn) for anything up to ten years. By way of compensation, investors’ should enjoy potentially much higher rates of return. In the chart, we contrast the long-term expected returns, and range of returns, for US private equity vs a proxy for public equity and US private debt vs a proxy for US corporate bonds. Whilst the potential for returns is clearly higher, the range of potential outcomes is much higher too, reflecting the higher risk-reward trade off. Contrasting public market and private market expected & variability of returns reflects their different characteristics, risks and opportunities. Request our Access to Private Markets white paper Register for our Introduction to Private Markets webinar 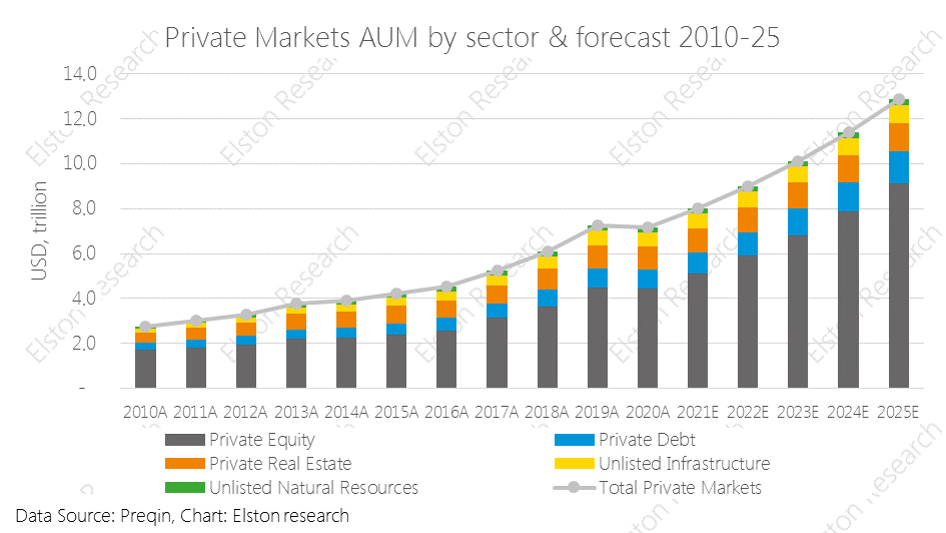 [3 min read]
Private markets exposure is growing in terms of both assets and popularity and offers potential for “true active” returns. We explore why and how advisers get access to this trend. Why private markets are in demand Private markets – incorporating private equity, private debt (direct lending), private real estate, unlisted infrastructure, unlisted natural resources – are characterised by attributes traditionally at odds with retail investing. Opacity, illiquidity, lengthy lock-up periods to name a few, and for that reason have largely been the domain of the institutional investor. But the growth in volume of private market strategies has become hard to ignore, as have the increasingly eye-watering returns enjoyed by private market managers. Overall private market AUM has increased from US$2.7tr in 2010 to US$7.2tr in 2020 and is expected to grow to US$12.9tr by 2025[1], with the majority of this in private equity. How can advisers access private market trends for their clients? In our white paper, we explore:
Request our Access to Private Markets white paper Register for our Introduction to Private Markets webinar [1] Preqin estimates, 2021 |
ELSTON RESEARCHinsights inform solutions Categories
All
Archives
July 2024
|
 RSS Feed
Company |
Solutions |
|