
 [3 min read, open as pdf ]
 Central Banks' policy rates are expected to pivot towards cuts in 2024 with a material impact on asset class perspectives.
Read the full article in FT Adviser 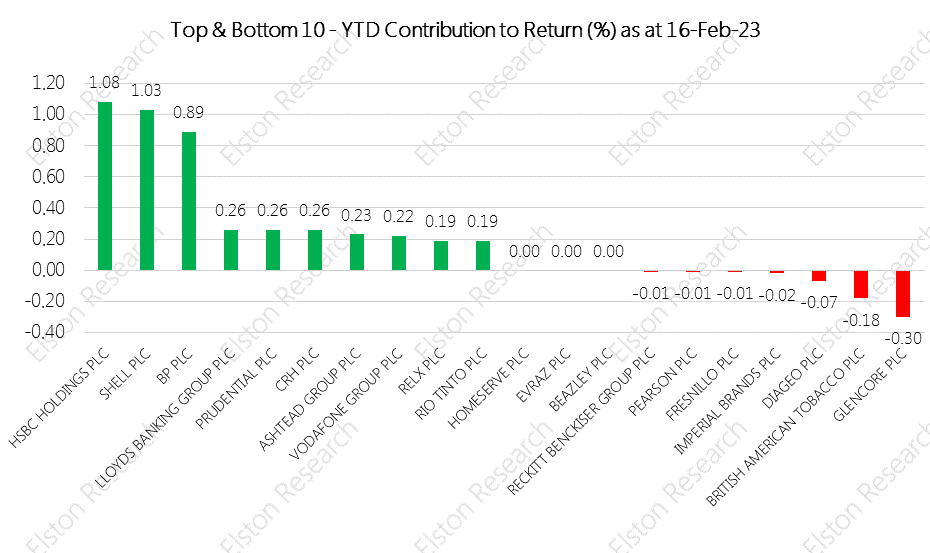 [5 min read, open as pdf]
 Wealth Manager's Ross Miller chats to Elston Consulting's Henry Cobbe. They discuss the return of yield and how it plays out across equities, bonds and alternatives.
Listen to the podcast 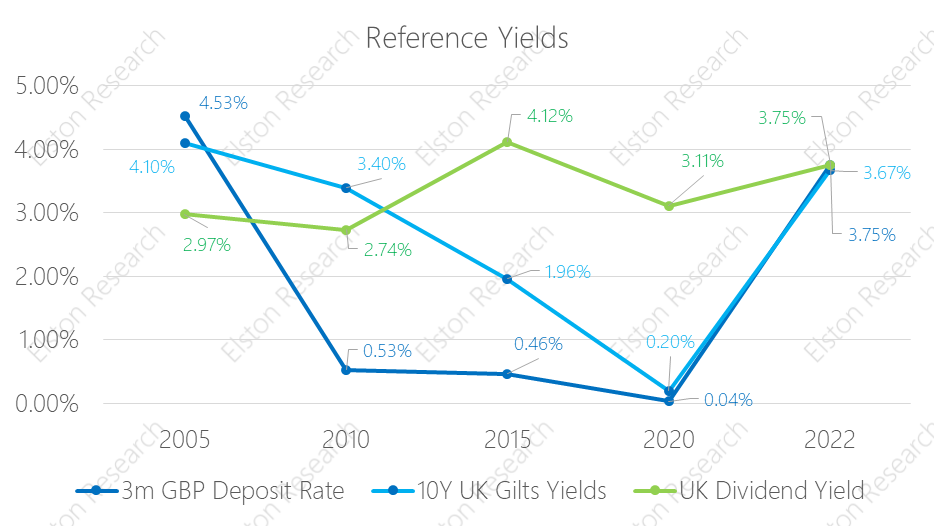 [5min read, open as pdf]
 [5 min read]
1. Yield is back: for equities, bonds and alternatives - the yield drought is over 2. Selectivity matters more: within and across asset classes 3. Inflation is getting stickier: getting past the peak, but still a problem Read the summary article Find out more:
 [5 min, open as pdf]
 [5 min read, open as pdf]
With low growth, soaring inflation and spiking interest rates, advisers need to rethink the definition of risk. Focus on volatility is focus on the “wrong problem”. Instead, advisers should focus on preserving purchasing power (mitigate inflation risk) to protect client outcomes. That requires a fundamental rethink around traditional definitions of risk, asset allocation and diversification. For full article including charts, open as pdf 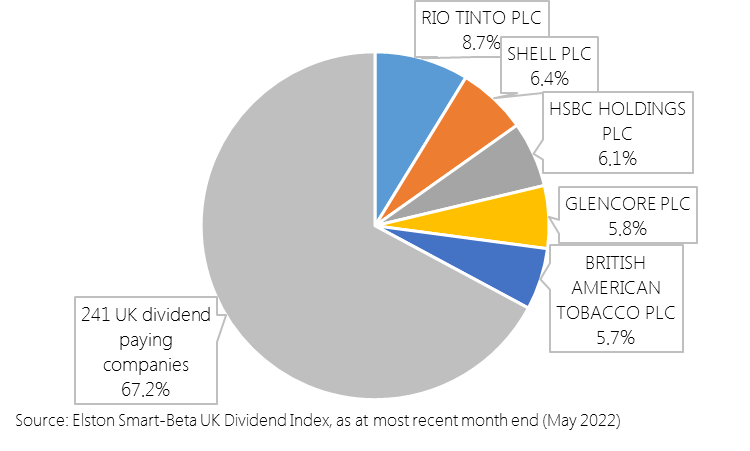 [5 min read, open as pdf]
Each quarter we are publishing the Top 5 holdings of our Elston Smart-Beta UK Dividend Index. These are the UK’s largest dividend payers as a proportion of the total dividend pool. For full report open as pdf 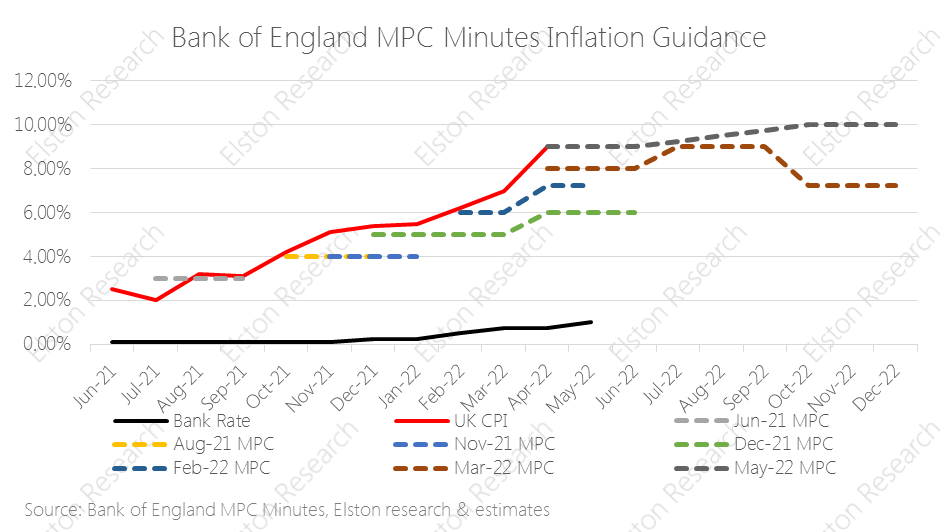 [5 min read, open as pdf]
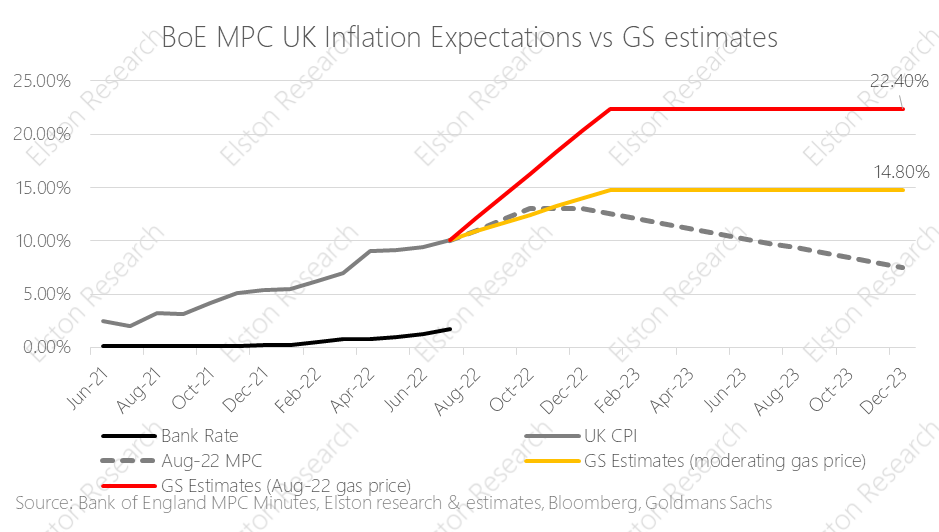
Inflation hits 40 year high UK inflation figures came out today with a print of +9.0%yy (April), from +7.0% (March) and slightly below +9.1%yy consensus estimate. This is the highest level in 40 years, putting renewed focus on the “cost of living crisis”. Rising energy and food costs are the primary drivers, linked to the sanctions regime and the Russia/Ukraine war. The Bank of England has been “behind the curve” as regards to inflation risk. A look at inflation guidance contained in recent Monetary Policy Committee (MPC) minutes shows. Near-term inflation guidance has consistently under-estimated inflation since August 2021 – rising from “above 2%”, to 4%, 6%, 8%,, 9% and now 10%. Read full article with charts  [5 min read, open as pdf]
In a recent CPD webinar, Elston’s Henry Cobbe interviewed Patrick Minford, Professor of Applied Economics at Cardiff University and economic adviser to Margaret Thatcher in the late 1970s and early 1980s to ask about the fight with inflation in the 1970s and any comparisons for today. While it is tempting to look for similarities with the energy shock and period of sustained inflation that the UK suffered in the late 1970s and early 1980s, Professor Minford highlighted some significant differences. The lower risk of a wage-price spiral, central bank independence and a track record of manging inflation means lower risk of inflation getting out of control in the long-term. But the short- to medium-term remains under pressure. In Minford’s opinion, the risk to the growth is the bigger risk: and this would be the right time for HM Treasury to worry less about debt ratios, and turn on Government spending taps. Read full article, open as pdf Watch the CPD webinar (50mins) 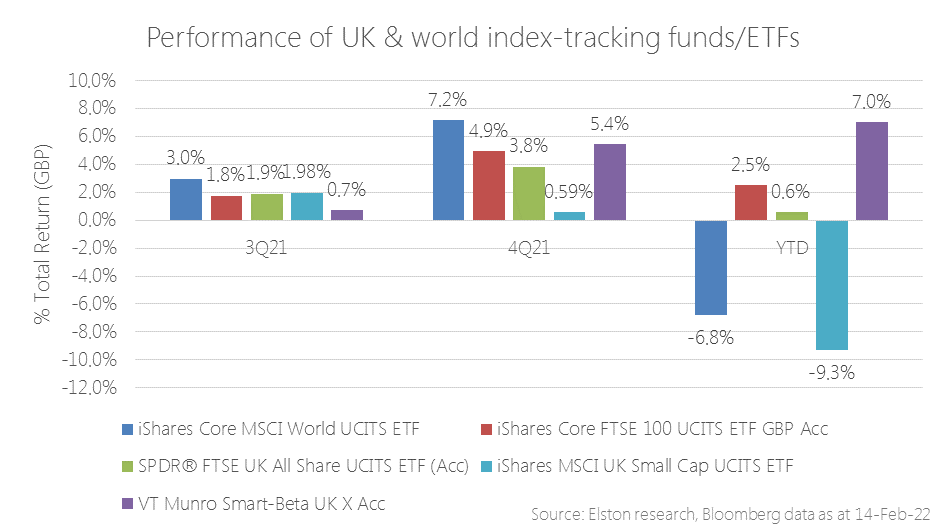 [3min read, open as pdf]
Value/Income bias for inflation protection In our 2022 outlook, we explained why inflation will remain hotter for longer and will settle above pre-pandemic levels. Within equities, we outlined our rationale for being overweight Value-factor equities with an Income bias to shorten equity duration. This built on our May 2021 view on UK equity income providing a helpful inflation hedge. The rapidity and severity of market movements against the prospect of faster-than-expected inflation and greater-than-expected interest rate tightening have only served to reinforce these views, as reflected by performance. Whereas world equities have struggled year to date, UK equities have been a relative bright spot. Within UK equity index exposures, indices that focus on dividends (with an inherent value bias), over size (market cap) have delivered best results. Our Smart-Beta UK Dividend Index [ticker ELSUKI Index] has delivered positive returns YTD ahead of more mainstream UK equity indices, driving the absolute and relative returns of the VT Munro Smart-Beta UK Fund, which is benchmarked to this index[1]. Read full article as pdf [1] Note & Commercial Interest Disclosure: Elston Indices is the benchmark administrator for the Freedom Smart-Beta UK Dividend Index, to be renamed the Elston Smart-Beta UK Dividend Index with effect from 1st March 2022. The VT Munro Smart-Beta UK Fund is benchmarked to this index.  [5 min read, open as pdf]
In our 2022 outlook, we explained why inflation will remain hotter for longer and will settle above pre-pandemic levels. Advisers should consider how to adapt portfolios for inflation across each asset class – equities, bonds and alternatives. Research demonstrates how different asset classes exhibit different degrees of inflation protection over different time-frames. Equities therefore provide a long-term inflation hedge.
In this article, we explore how to adapt portfolios for inflation within and across each asset class: Equities, Bonds and Alternatives. For full article, read as pdf 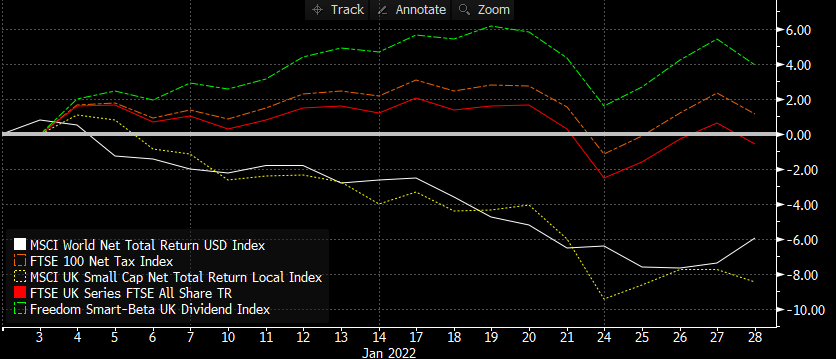 [7 min read, open as open as pdf]
Year to date performance The dispersion between styles and segments within equities is pronounced in the UK. Given recent market stress over the prospect of a rising interest rate environment, inflationary pressure, and geopolitical tensions, year-to-date performance underscores the relative resilience of equities with a Value/Income bias relative to other UK equity segments and world equities. Year to date, world equities are down -5.93%, the FTSE All Share is flat at -0.55%. UK Small Caps are down -8.49%, the FTSE 100 is +1.14% and UK Equity Income (Freedom Smart-Beta UK Dividend Index) is +3.97%. This is because returns are underpinned by dividend income as well as exposure to energy and financials which benefit respectively from a high oil price/rising rate environment. Read in full as pdf  [3 min read, open as pdf]
2021 in review Our 2021 market roundup summarises another strong year for markets in almost all asset classes except for Bonds which remain under pressure as interest rates are expected to rise and inflation ticks up. Listed private equity (shares in private equity managers) performed best at +43.08%yy in GBP terms. US was the best performing region at +30.06%. Real asset exposures, such as Water, Commodities and Timber continued to rally in face of rising inflation risk, returning +32.81%, +28.22% and +17.66% respectively. 2022 outlook We are continuing in this “curiouser, through-the-looking glass” world. Traditionally you bought bonds for income, and equity for risk. Now it’s the other way round. Only equities provide income yields that have the potential to keep ahead of inflation. Bonds carry increasing risk of loss in real terms as inflation and interest rates rise. Real yields, which are bond yields less the inflation rate, are negative making traditional Bonds which aren’t linked to inflation highly unattractive. Bonds that are linked to inflation are highly sensitive to rising interest rates (called duration risk), so are not attractive either. How to navigate markets in this context? The big three themes for the year ahead are, in our view:
See full report in pdf Attend our 2022 Outlook webinar 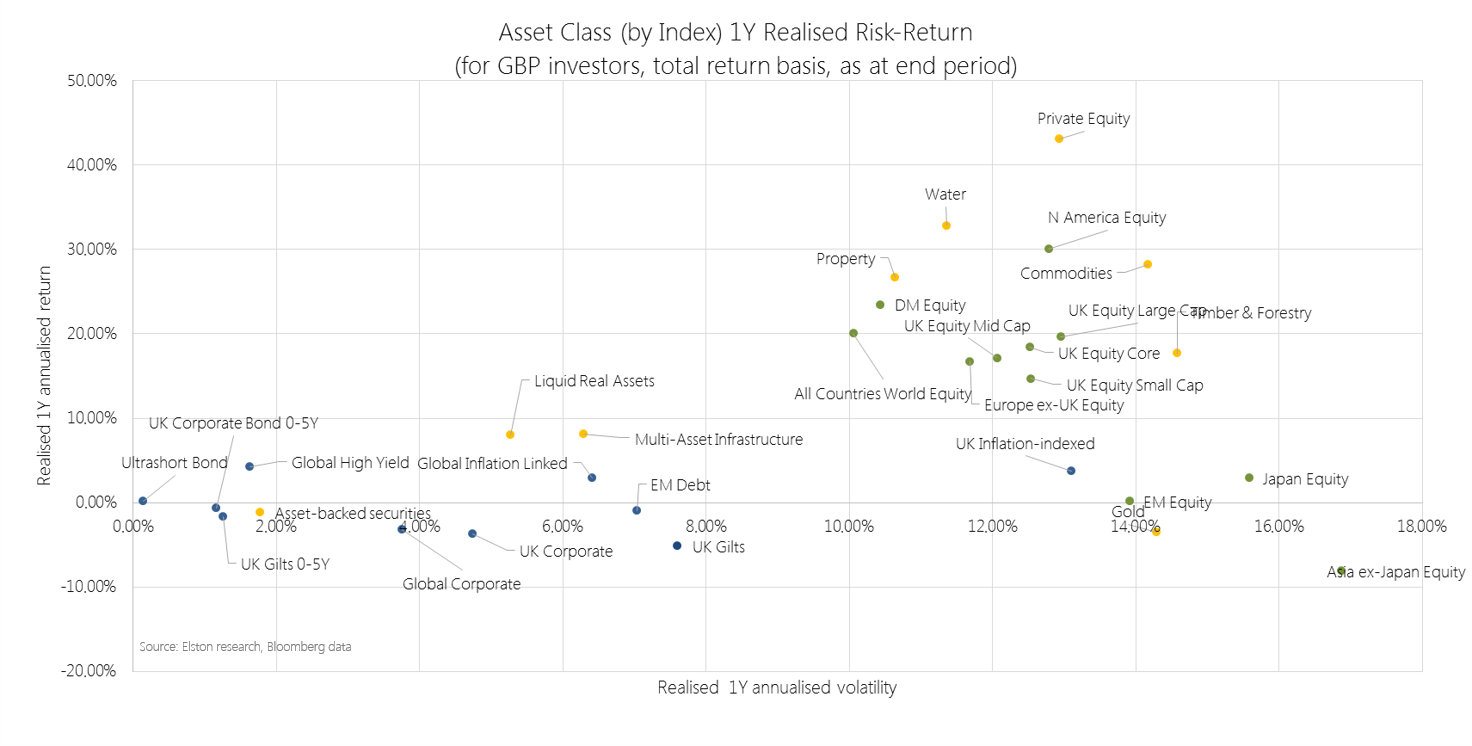 [3 min read, open as pdf]
Sustained recovery in risk assets 2021 saw a sustained recovery in risk assets, with the exception of Emerging Markets. Listed Private Equity was the top performing exposure returning +43.08% in GBP terms. Regionally, US equities remained the strongest performing market +30.06%. Real assets to the fore Real asset exposures, such as Water, Commodities and Timber continued to rally in face of rising inflation risk, returning +32.81%, +28.22% and +17.66% respectively. Our Liquid Real Assets Index (ticker ELSLRA Index) – which combines higher risk real assets and lower risk rate-sensitive assets to deliver volatility similar to bonds – returned +7.98%, whilst UK Gilts declined -5.16%. UK equity income strength Within UK equity market segments, UK Equity Income outperformed all other segments as inflation fears made income-generative, value-oriented shares relatively more attractive. UK Equity Income, represented by our Freedom Smart Beta UK Dividend Index (ticker ELSUKI Index), returned +20.77%, whilst UK Large Cap returned +19.68% and UK Core returned +18.44%. UK Small Cap was the weakest UK segment, returning +14.70% for the year. Read as pdf Register for our Quarterly Investment Outlook on 26 January 2022 |
ELSTON RESEARCHinsights inform solutions Categories
All
Archives
July 2024
|
 RSS Feed
Company |
Solutions |
|