

We look at the three largest ETPs that track the gold price and which are “physically-backed” (meaning they own the underlying asset), and track the same spot price index, the LBMA Gold Price Index. Each of these ETPs offers a London-listed share-class, and each also offers a GBP-denominated listing. This means that the share price is expressed in GBP-terms. This is convenient for client reporting and essential for some platforms. The returns, however, remain unhedged to GBP. Whilst SGLN and SGLP are Irish-domiciled funds, PHGP is Jersey domiciled. Each has UK tax reporting status. In terms of scale and cost, iShares Physical Gold ETC (Ticker: SGLN, launched in 2011) is the largest at £11.9bn with TER of 0.19%, followed by Invesco Physical Gold (Ticker: SGLP, launched in 2009) at £10.7bn with TER of 0.19%, followed by WisdomTree Physical Gold (Ticker: PHGP, launched in 2007) at £7.1bn With increasing choice available, the key differentiation amongst physically-backed ETPs is cost. Fig.1. YTD performance of largest London-listed Gold ETPs 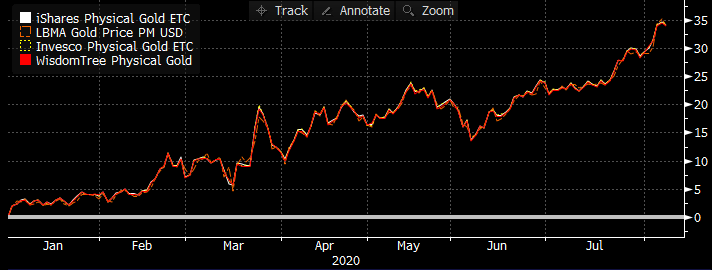 Source: Bloomberg, as at 7th August 2020, GBP terms
NOTICES Commercial Interest: Elston Consulting Limited creates research portfolios and administers indices that may or may not be referenced in this article. If referenced, this is clearly designated as such and is to raise awareness and provide purely factual information as regards these portfolios and/or indices. Image Credit: Shutterstock 
Liquid Alternatives: Assets We define Liquid Alternative Asset ETFs as tradable ETFs that hold liquid securities that provide access to a particular “alternative” (non-equity, non-bond) asset class exposure. More specifically, we define this as Listed Property Securities, Infrastructure Securities, Commodities, Gold and Listed Private Equity. Looking at selected ETF proxies for each of these asset classes, the correlations for these Liquid Alternative Assets, relative to Global Equity are summarised below. Fig.1. Liquid Alternative Assets: Correlation Matrix 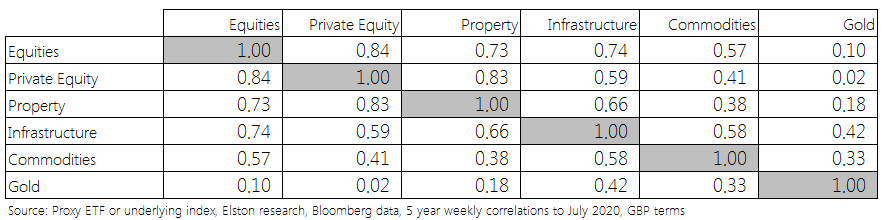 Incorporating these exposures within a multi-asset strategy provides can provide diversification benefits, both from an asset-based perspective and a risk-based perspective. Looking at 5 year annualised performance, only Gold has outperformed Global Equities. Listed Private Equity has been comparable. Meanwhile Infrastructure has outperformed property, whilst Commodities have been lack-lustre. Fig.2. Liquid Alternative Assets Returns vs Global Equities 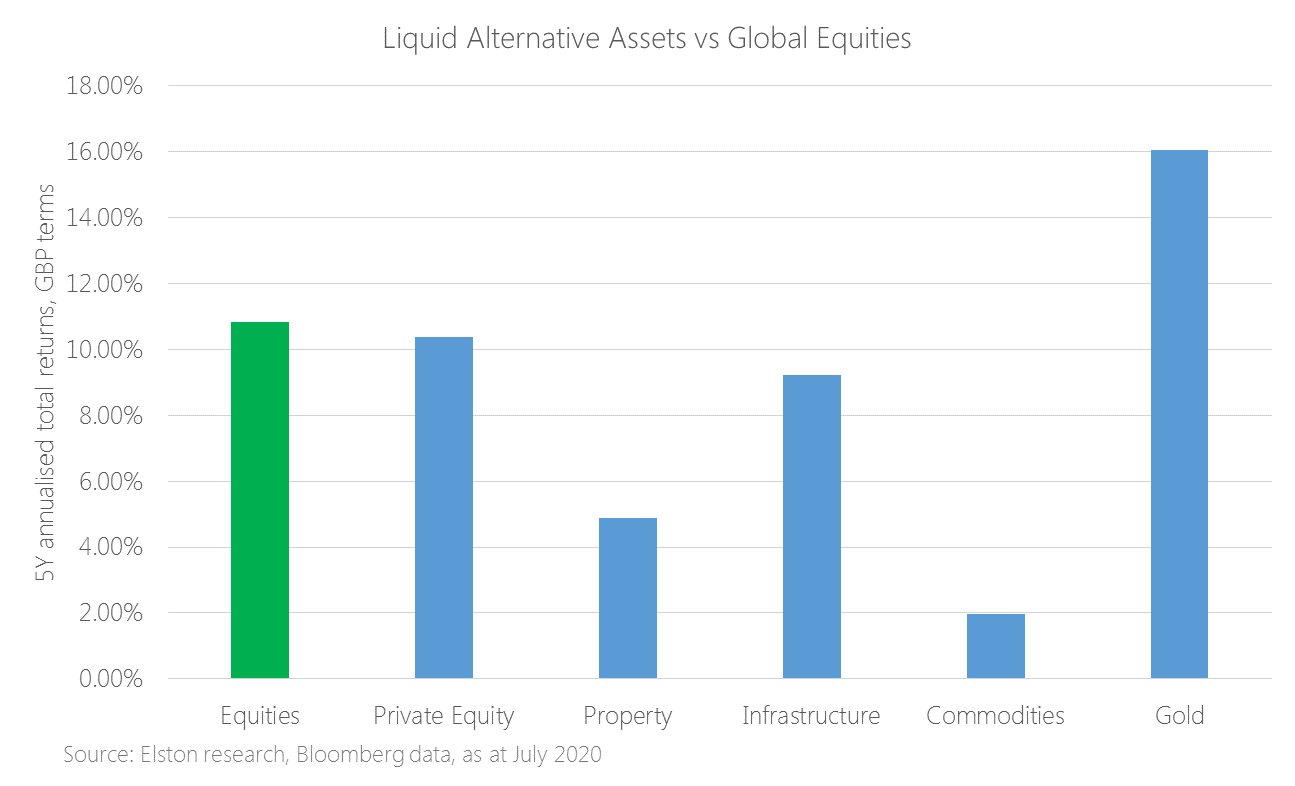 Looking at performance YTD, gold has returned +31.06% in GBP terms, outperforming Global Equities by 32.54ppt. Infrastructure has also slightly outperformed equities owing to its inflation protective qualities. Fig.3. YTD performance of Liquid Alternative Assets (GBP terms) 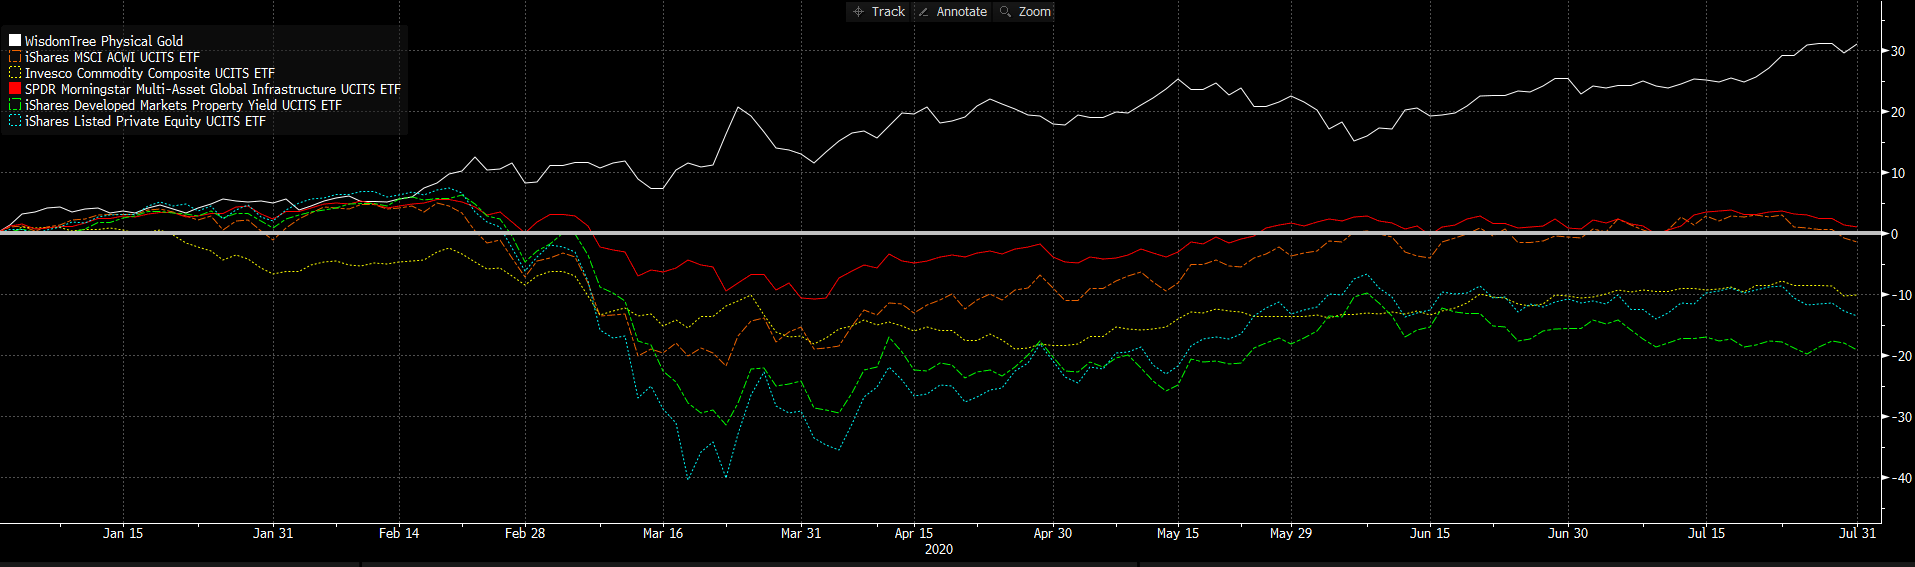 Source: Elston research, Bloomberg data Liquid Alternatives: Strategies We define Liquid Alternative Strategy ETFs as tradable ETFs that provide alternative asset allocation strategies. By providing differentiated risk-return characteristics, these ETFs should provide diversification and/or reflect a particular directional bias. Fig.4. Examples of European-listed Liquid Alternative Strategies 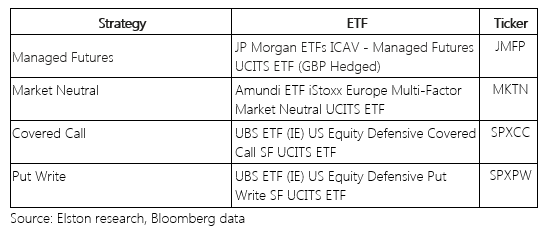 Each of these strategies provide a low degree of correlation with Global Equities and therefore have diversification benefits. Fig.5. Liquid Alternative Strategies: Correlation Matrix 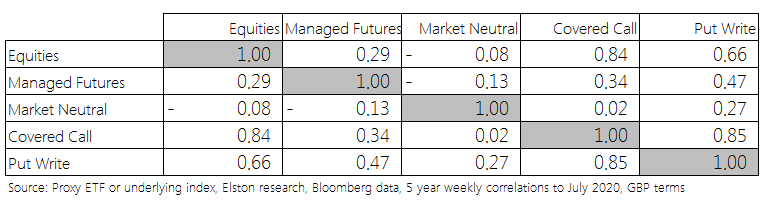 In 2020, the Market Neutral strategy has proven most defensive. Fig.6. Liquid Alternative Strategies: YTD performance 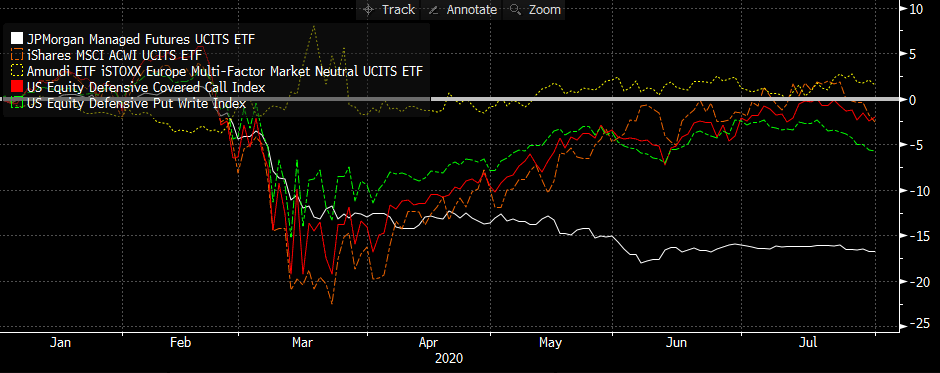 Source: Bloomberg data, GBP terms, as at July 2020 Conclusion ETFs offer a timely, convenient, transparent, liquid and low-cost way of allocating or deallocating to a particular exposure. Blending Liquid Alternative ETFs – both at an asset class level and a strategy level - provides managers with a broader toolkit with which to construct portfolios. NOTICES
Commercial Interest: Elston Consulting Limited creates research portfolios and administers indices that may or may not be referenced in this article. If referenced, this is clearly designated as such and is to raise awareness and provide purely factual information as regards these portfolios and/or indices. Image Credit: Shutterstock 
Why use options overlays? Managers of larger investment portfolios sometimes use options overlays to create an alternative payoff profile relative to a straightforward “long-only” equity holding of a share or index. This is done to reflect a particular investment view. Examples of options overlay strategies include Covered Calls and Put Writes. These strategies to protect investments when markets move sideways and there is higher potential for downside risk. This typically comes at the expense of explicit costs and foregone returns. What is a covered call strategy? A Covered Call strategy combines a holding in equities with sales of call options (an option to buy an equity at a given price within a specific time) on those equities. In other words, it can be seen as sacrificing unknown future gains on equities in exchange for a known income today. These aim is 1) to generate returns through income from those sales and 2) reduce downside risk. What is a written put strategy? A Put Write strategy combines a cash exposure with sales of put options (an option to sell an equity at a given price within a specific time) on those equities, with the aim of generating an income from option sales whilst providing a cushion during market downturns. What’s new? UBS has launched a range of four ETFs that offer a choice of two underlying exposures (S&P 500 or Euro Stoxx 50) combined with these two types of options overlay strategies to give investors access to these defensive strategies that perform better in sideways or downward markets. The ETFs available are: Fig.1. UBS UCITS ETFs incorporating options strategies 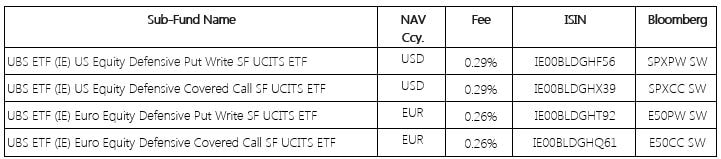 Source: Elston Research, Bloomberg data What does this launch mean for investors? The launch of these ETFs gives investors of any size the opportunity to access these options overlay strategies within a fund exposure, rather than outwith a fund exposure, meaning that they benefit from:
Not really. Covered call strategies are used to enhance the income of traditional OEICs in the “Enhanced Income” sector. Funds such as the Schroder Income Maximiser and Fidelity Enhanced Income use a covered call strategy within the fund to generate additional income at the expense for capital growth, as did Enhanced Income ETFs from BMO. But this is typically done for yield enhancement rather than as a pure defensive strategy. These UBS ETFs are not yield focus but are using that additional income to provide some cushioning. Why the ETF format? The advantage of the ETF format means that investors have the ability to allocate or deallocate to that strategy quickly and conveniently. As we saw in March, in period of heightened daily volatility, the 4-5 day dealing cycles (8-10 days for an unfunded switch) of traditional OEICs create significant and unintended market timing risk. The ETF format offers a more timely way of adding or removing a particular exposure. Who might use these? Discretionary managers and financial advisers using platforms that can access ETFs may find these strategies a useful addition to the toolkit as a Liquid Alternative strategy. Are these Liquid Alternative ETPs? Yes, we would classify them as such. But we differentiate between Liquid Alternative Asset Classes and Liquid Alternative Strategies. We would classify these ETFs as Liquid Alternative Strategies, alongside Managed Futures ETFs and Equity Market Neutral ETFs. What are the drawbacks? From a UK perspective, whilst the S&P500 product will be a useful proxy for overall market risk, it’s disappointing that there is these overlay strategies are not available for the UK’s FTSE 100 index as that would be of more appeal for UK investors, advisers and managers. Furthermore, financial advisers using traditional fund-based platforms will not be able to access these type of options overlay strategies, limiting potential usage. Performance Track record Whilst the ETFs are new, the underlying indices has been created with data back to July 2012. In the 8 years to end July 2020 in USD terms, the US Equity Defensive Covered Call Index returned +11.09%, compared to +13.71% for the S&P 500. The foregone returns being part of the cost of downside protection. By contrast, the maximum monthly drawdown (in March 2020) for the Covered Call index was -10.74%, compared to -12.51% for the S&P500, a -14% reduction in drawdown. Over the same time frame, the US Equity Defensive Put Write Index returned +3.81% compared to +2.88% for US Treasuries. By contrast, the maximum monthly drawdown (in March 2020) for the Put Write index was -8.14%. Fig.2. Performance vs selected comparators 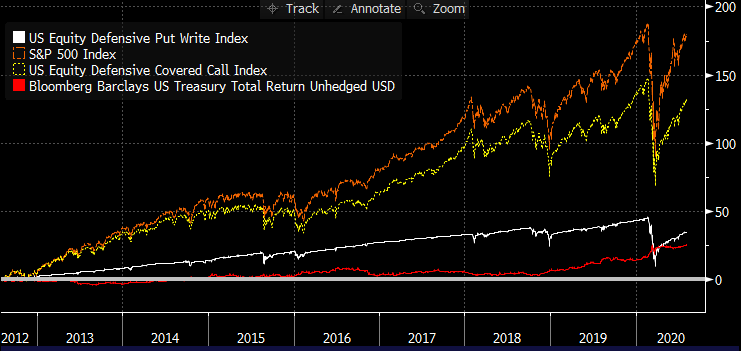 Source: Bloomberg data, 31st July 2012 to 31st July 2020, USD terms In the 1 year to July 2020, the annualised daily volatility of the Covered Call Index was 29.75% compared to 34.10% for the S&P500 (a 12.8% reduction) In more normal markets – in the 3 years to December 2019, the volatility of the Covered Call Index was 12.27% compared to 12.89% (a 4.8% reduction) Conclusion On our analysis, the Put Write index should work well in providing consistent returns in sideways markets in excess of cash/government bonds, but is not immune from severe market shocks. The Covered Call Index provides a defensive bias whilst maintaining the potential for returns from the underlying exposure. At a TER of 0.26%-0.29% the strategies are reasonably priced relative to either creating a bespoke options strategy or compared to the OCF of traditional OEICs with embedded options overlays. Nonetheless, a FTSE 100 exposure would be additionally welcome. NOTICES
Commercial Interest: Elston Consulting Limited creates research portfolios and administers indices that may or may not be referenced in this article. If referenced, this is clearly designated as such and is to raise awareness and provide purely factual information as regards these portfolios and/or indices. Image Credit: Shutterstock |
ELSTON RESEARCHinsights inform solutions Categories
All
Archives
July 2024
|
 RSS Feed
Company |
Solutions |
|