
 [3 min read, open as pdf]
What do we mean by “Relative Risk” strategies We refer to asset-weighted multi-asset strategies with clearly defined equity allocations “relative risk” strategies. Why? Because as their asset weightings are relatively stable, their risk will fluctuate relative to equity risk, which is itself dynamic. The alternative to this approach is “target risk” strategies, where the asset weightings fluctuate to target a stable portfolio risk. The vast majority of risk profiled multi-asset portfolio and multi-asset funds are relative risk strategies, where risk can be defined as % equity exposure. Nowhere to hide The sudden severity of the COVID-related market downturn mean that the impact on “relative risk” strategies was similar. Broadly speaking, they took ~60% of the drawdown in global equities. A traditional asset-weighted approach can reduce beta to global equity, but not necessarily reduce correlation. In this respect, there was nowhere to hide for traditional relative risk multi-asset funds whose asset allocation is relatively stable. Fig.1. YTD Performance of “balanced” multi-asset passive funds 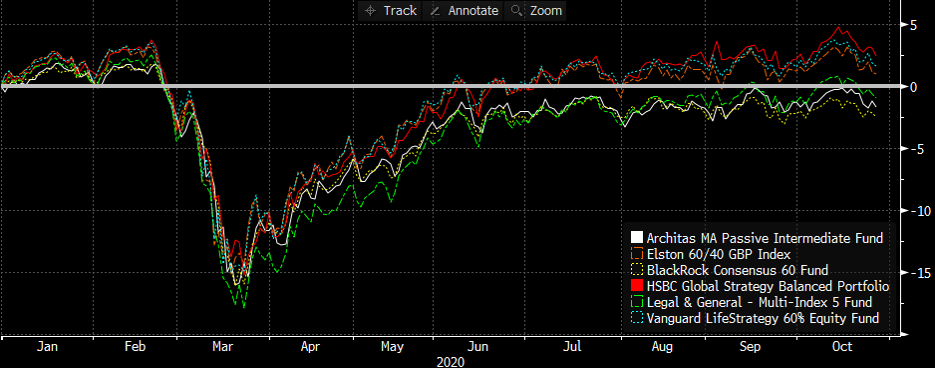 Source: Elston research, Bloomberg data. Total returns from end December 2019 to 28th October 2020 What is visible, however, is the differing shape of recoveries. And this was predominantly a function of:
We look at summary YTD performance of selected multi-asset passive funds, relative to our Elston 60/40 GBP Index, Global Equities and UK Equities. At +2.42%, HSBC Global Strategy Balanced has delivered strongest return YTD, outperforming the Elston 60/40 GBP Index by 1.40ppt. At -2.46%, BlackRock Consensus 60 has delivered weakest return YTD, underperforming the Elston 60/40 GBP Index by -3.48ppt. Fig.2. 2020 YTD Performance 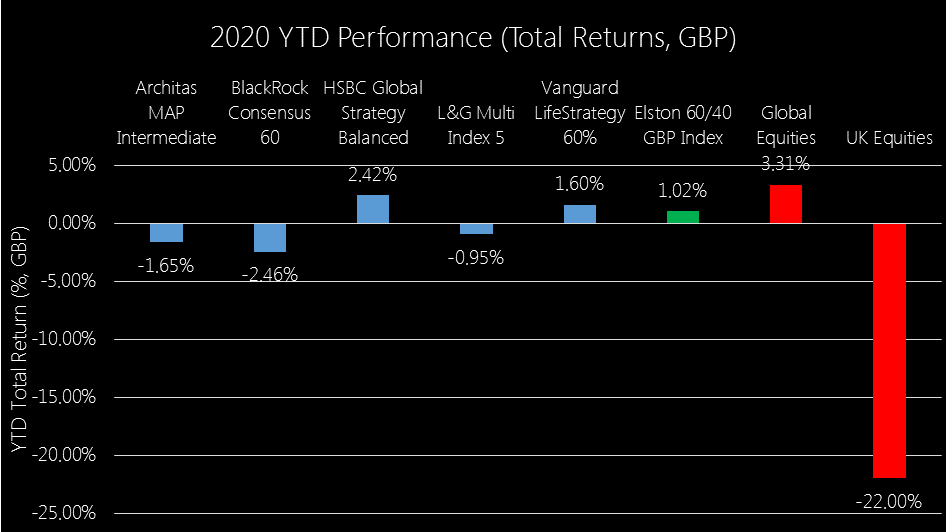 Source: Elston research, Bloomberg data. Year to date as at 28/10/20. Total Returns in GBP terms. Global Equities represented by SSAC. UK Equities represented by ISF. Risk-adjusted returns For risk-adjusted returns, we compare YTD performance to the 260 day rolling volatility. On this basis, HSBC Global Strategy Balanced has delivered best risk-adjusted returns. On a risk-adjusted basis, HSBC Global Strategy Balanced delivered positive YTD returns and +1.40ppt outperformance relative to the Elston 60/40 GBP Index with approximately 84% of the volatility of the Elston 60/40 GBP Index. By contrast Vanguard LifeStrategy 60% Equity delivered positive YTD returns nd +0.58%ppt outperformance relative to the Elston 60/40 GBP Index with 102% of the volatility of the Elston 60/40 GBP Index. Fig.3. Risk-adjusted returns 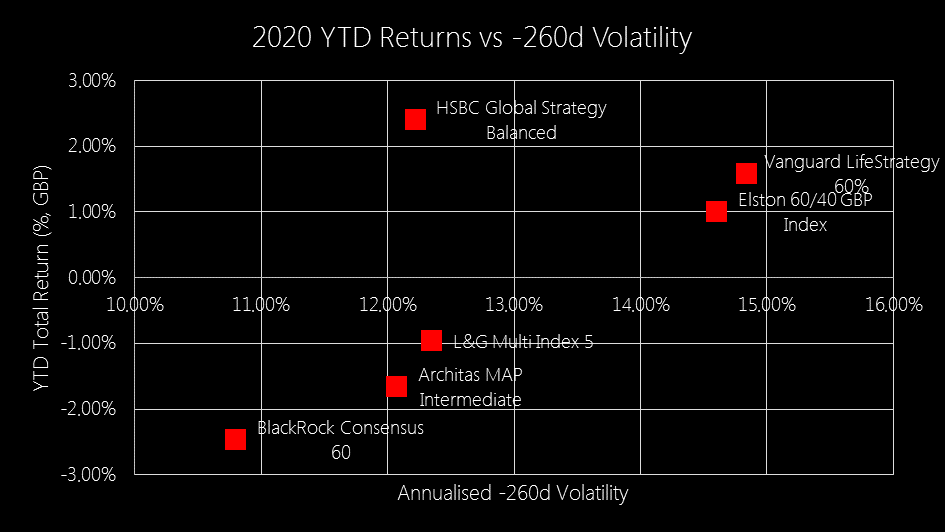 Source: Elston research, Bloomberg data, as at 28/10/20 Total Returns in GBP terms
Summary Based on this analysis
 [2 min read, open as pdf]
Targeted Absolute Return funds Targeted Absolute Return funds (“TAR”) were billed as “all weather” portfolios to provide positive returns in good years, and downside protection when the going gets rough. How have they fared in the COVID rollercoaster of 2020? Using our Risk Parity Index as a more relevant comparator We benchmark TAR funds to our Elston Dynamic Risk Parity Index: this is a risk-based diversification index whose construction (each asset class contributes equally to the risk of the overall strategy) and purpose (return capture, downside protection, moderate decorrelation) is closer in approach to TAR funds than, say, a Global Equity index or 60/40 equity/bond index. Absolute Return In terms of Absolute Return, ASI Global Absolute Return Strategies has performed best YTD +4.70%, followed by BNY Mellon Real Return +2.43%, both outperforming the Elston Dynamic Risk Parity Index return of +2.37%. Fig.1. YTD Performance Targeted Absolute Return funds 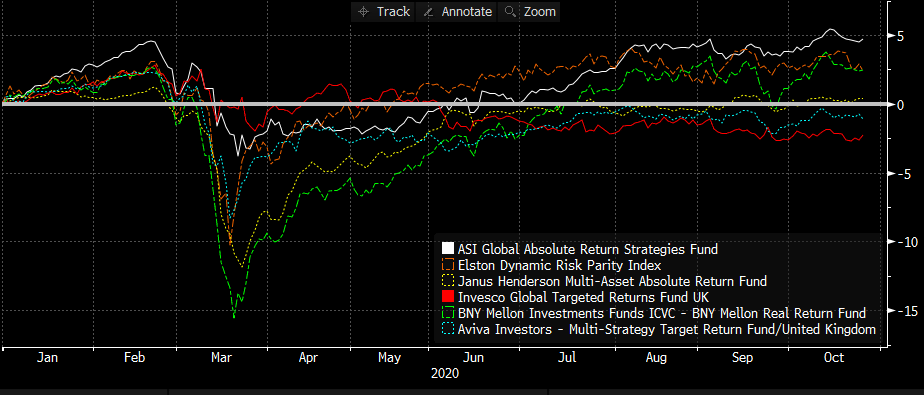 Source: Elston research, Bloomberg data. Total returns from end December 2018 to end September 2020 for selected real asset funds. Downside risk If downside protection is the desired characteristic, then it makes sense to look at drawdowns both by Worst Month and Maximum (peak-to-trough) Drawdown, rather than volatility. In this respect, Invesco Global Targeted Return provided greatest downside protection with a March drop of -1.11% and Max Drawdown of -1.99%; followed by ASI Global Absolute Return Strategies with a March drop of -2.74% and Max Drawdown of -3.81%. This compares to -5.14% and -10.23% respectively for the Risk Parity Index. Fig.2. YTD Total Return, Worst month, Max Drawdown 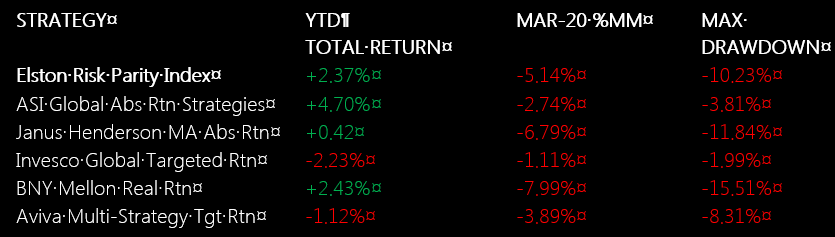 Source: Elston research, Bloomberg data. Year to date as at 27/10/20. Maximum drawdown: peak-to-trough drawdown in 2020. Total Return in GBP terms. Risk-adjusted returns: Total Return vs Max Drawdown Bringing it together, we can adapt the classic “risk-return” chart, but replacing volatility with Max Drawdown. On this basis, ASI Global Absolute Return Strategies has provided the best Total Return relative to Max Drawdown, followed by the Elston Dynamic Risk Parity Index. Whilst Invesco Global Targeted Return provided least drawdown, it also provided worst returns. Fig.3. Risk (Max Drawdown) vs Total Return (YTD, 2020) 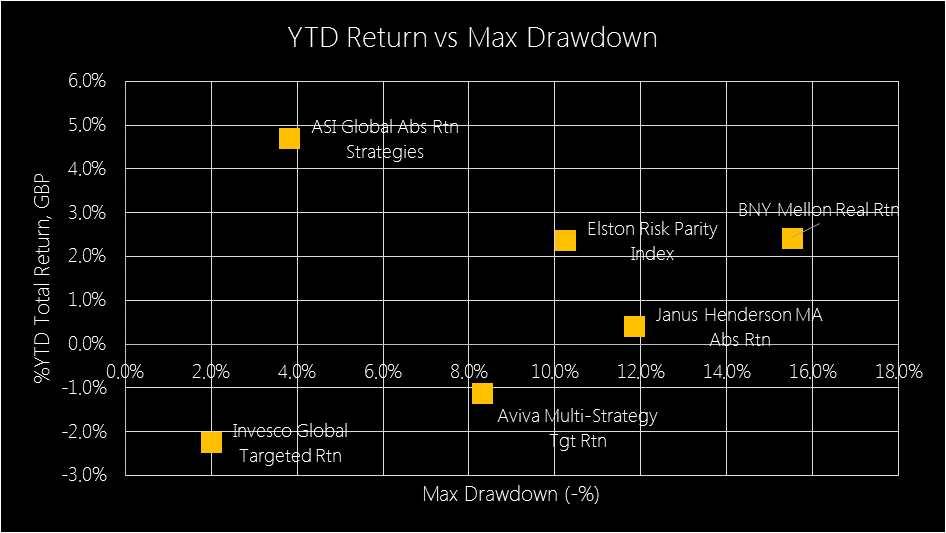 Source: Elston research, Bloomberg data, as at 27/10/20 in GBP terms Rolling Correlations We look at the change in Correlation (sometimes referred to as “ceta”) as a dynamic measure of diversification effect. By plotting the rolling 1 year daily correlation of each TAR Fund and our Risk Parity Index relative to a traditional 60/40 portfolio (we use the Elston 60/40 GBP Index as a proxy), we can see whether correlation increased or decreased during market stress. Elston Risk Parity Index correlation to the 60/40 GBP Index was relatively stable. Janus Henderson MA Absolute Return fund and BNY Mellon Real Return fund showed an increase in correlation into the crisis; ASI Global Absolute Return Strategies showed greatest correlation reduction into the crisis, delivering the diversification effect. Fig.4. Rolling -1year daily correlation to Elston 60/40 GBP Index 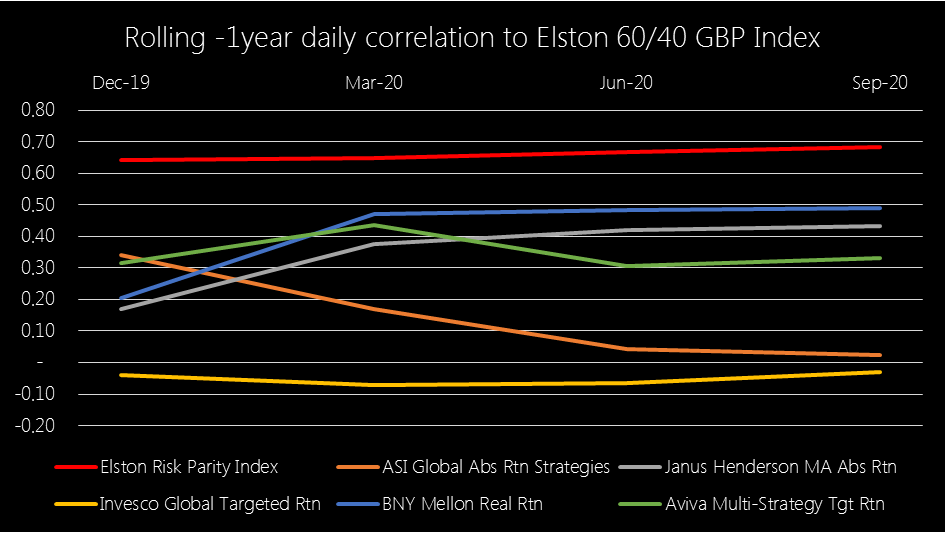 Source: Elston research, Bloomberg data, as at 27/10/20 in GBP terms
Summary Based on this analysis:
 High risk, complex Exchange Traded Products that amplify (with “leverage”) index’ moves in the same (“long”) or opposite (“short”) direction are designed for sophisticated investors who want to trade and speculate over the short-term, rather than make a strategic or tactical investment decisions. Whilst they can have a short-term role to play, they should be handled with care. If you think you understand them, then you’ve only just begun. In this series of articles, I look at some of the key topics explored in my book “How to Invest With Exchange Traded Funds” that also underpin the portfolio design work Elston does for discretionary managers and financial advisers. For more speculators and or more sophisticated risk managers there are a range of inverse (short) and leveraged (geared) ETPs that can rapidly add or remove upside or downside risk exposure in short-term (daily) market movements. The difference between speculating and investing should be clearly defined.
Owing to the higher degree of risk management and understanding required to use these products, they may not be suitable for DIY or long-term investors. However a degree of knowledge is helpful to identify them within a managed portfolio or amongst research sites. Defining terms Unlike their more straightforward unleveraged ETF cousins, leveraged and inverse or “short” ETNs should be for sophisticated investor or professional use only. So hold onto your seat. Shorting and leverage are important tools in a professional manager’s arsenal. But first we need to define terms. Going long: means buying a security now, to sell it at a later date at a higher value. The buyer has profited from the difference in the initial buying price and final selling price. Going short: means borrowing a security from a lender and selling it now, with an intent to buy it back at a later date at a lower value. Once bought, the security can be returned to the lender and the borrower (short-seller) has profited from the difference in initial selling and final buying price. Leverage: means increasing the magnitude of directional returns using borrowed funds. Leverage can be achieved by:
Underlying index: is the underlying index exposure against which a multiplier is applied. The underlying index could be on a particular market, commodity or currency. Potential applications Managers typically have a decision only whether to buy, sell or hold a security. By introducing products that provide short and/or leveraged exposure gives managers more tools at their disposal to manage risk or to speculate. Going short, and using leverage can be done for short-term risk management purposes, or for speculative purposes. Leverage in either direction (long-short) can be used either to amplify returns, profit from very short market declines, or change the risk profile of a portfolio without disposing of the underlying holdings. Short/Leveraged ETPs available to DIY investors The following types of short/leveraged ETPs are available to implement these strategies. Fig.1. Potential application of inverse/leveraged ETPs 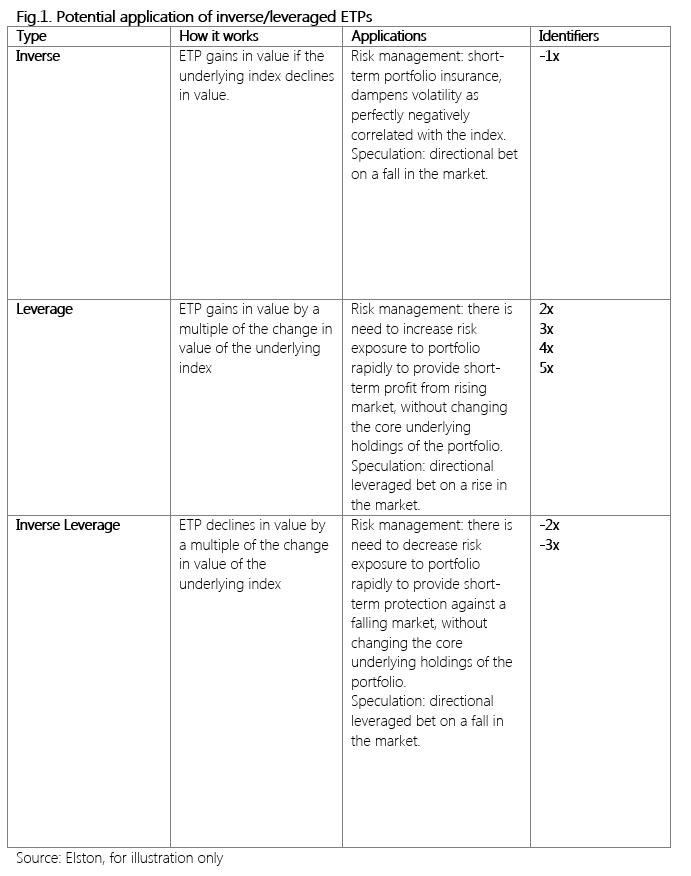 The ability to take short and/or leveraged positions was previously confined to professional managers and ultra-high net worth clients. The availability of more complex Exchange Traded Products gives investors and their advisers the opportunity to manage currency risk, create short positions (profit from a decline in prices) and create leveraged positions (profit more than the increase or decrease in prices).
Risks Leveraged and short ETPs have significantly greater risks than conventional ETFs. Some of the key risks are outlined below:
If concerned regarding risk of deploying short/leveraged ETPs, set a capped allocation i (eg no more than 3% to be held in leveraged/inverse ETPs, and a holding period for leveraged/inverse ETPs not to exceed 1-5 days). US Case Study: Inverse Volatility Blow Up VelocityShares Daily Inverse VIX Short-Term ETN (IVX) and ProShares Short VIX Short-Term Futures ETF were products created in the US for professional investors who wanted to profit from declining volatility on the US equity market by tracking the inverse (-1x) returns of the S&P VIX Short-Term Futures Index. The VIX is itself an reflecting the implied volatility of options on the S&P 500. As US equity market volatility steadily declined the stellar performance of the strategy in prior years not only made it popular with hedge funds[2], but also lured retail investors who are unlikely to have understood the complexity of the product. By complexity, we would argue that a note inversely tracking a future on the implied volatility of the stock market is hardly simple. On 5th February, the Dow Jones Industrial Average suffered its largest ever one day decline. This resulted in the VIX Index spiking +116% (from implied ~12% volatility to implied ~33% volatility). The inverse VIX ETNs lost approximately 80% of their value in one day which resulted in an accelerated closure of the product, and crystallising the one day loss for investors[3]. The SEC (US regulator) focus was not on the product itself but whether and why it had been mis-sold to retail investors who would not understand its complexity[4]. Summary In conclusion, on the one hand, Leveraged/Inverse ETP are convenient ways of rapidly altering risk-return exposures and provide tools with which speculators can play short-term trends in the market. Used by professionals, they also have a role in supporting active risk management. However, the risks are higher than for conventional ETFs and more complex to understand and quantify. RISK WARNING! Short and/or Leveraged ETPs are highly complex financial instruments that carry significant risks and can amplify overall portfolio risk. They are intended for financially sophisticated investors who understand these products, and their potential pay offs. They can be used to take a very short term view on an underlying index, for example, for day-trading purposes. They are not intended as a buy and hold investment. [1] https://seekingalpha.com/article/1457061-how-to-beat-leveraged-etf-decay [2] https://www.cnbc.com/2018/02/06/the-obscure-volatility-security-thats-become-the-focus-of-this-sell-off-is-halted-after-an-80-percent-plunge.html [3] https://www.bloomberg.com/news/articles/2018-02-06/credit-suisse-is-said-to-consider-redemption-of-volatility-note [4] https://www.bloomberg.com/news/articles/2018-02-23/vix-fund-blowups-spur-u-s-to-probe-if-misconduct-played-a-role  [5 min read, open as pdf]
What is Zero Carbon investing The Zero Carbon Society at Cambridge University is one of many campaign groups calling for university endowment funds to divest from all fossil fuels. This has been termed “Zero Carbon” investing. The divestment trend started in the US in 2012 when the city of Seattle divested from fossil fuels. In 2014, Stanford University followed suit. Campaigns across the US and UK led to other universities following suit. Some of the reasons universities found it hard to ensure that their investments were “fossil free” is because:
The challenge When set this challenge by a university college, we proposed to do two things. Firstly to create a Zero Carbon SRI benchmark to show how Zero Carbon investing could be done whilst also focusing on other ESG considerations. Secondly, to create a Zero Carbon portfolio to deliver on the primary aim of full divestment. Creating a Zero Carbon SRI benchmark We wanted to create a benchmark for the endowment’s managers that not only screened out fossil fuels, but went further to screen out one of the main consumer of fossil fuels, the Utilities sector, as well as other extractive industries – namely the Materials sector. We also wanted to screen in companies with high ESG scores and low controversy risk and cover the global equity opportunity set. We worked with MSCI to create a custom index, the catchily-named (for taxonomy reasons) the MSCI ACWI ex Energy ex Materials ex Utilities SRI Index (the “Custom Index”, please refer to Notice below). Creating a Zero Carbon portfolio The second part of the project was to create an implementable investment strategy that maintained a similar risk-return profile to World Equities, but fully excluded the Energy, Materials and Utilities sectors. Rather than creating a fund which introduces additional layer of costs, this was achievable using sector-based ETF portfolio. This portfolio meets the primary objective of creating a Zero Carbon, fully divested, world equity mandate. In the absence of ESG/SRI sector-based ETFs, it is not yet possible to create a sector-adjusted ESG/SRI ETF portfolio. But we expact that to change in the future. Custom Index Performance The back-test of both the custom index could deliver similar risk-return characteristics to global equities. The concern was would those back-test results continue once the index and portfolio went live. The answer is yes. Whilst the custom index has shown outperformance, that was not the objective. The objective was to access the same opportunity set, but with the fossil-free, ESG and socially responsible screens in place. Fig.1. Custom Index performance simulation from June 2012 & live performance from June 2018 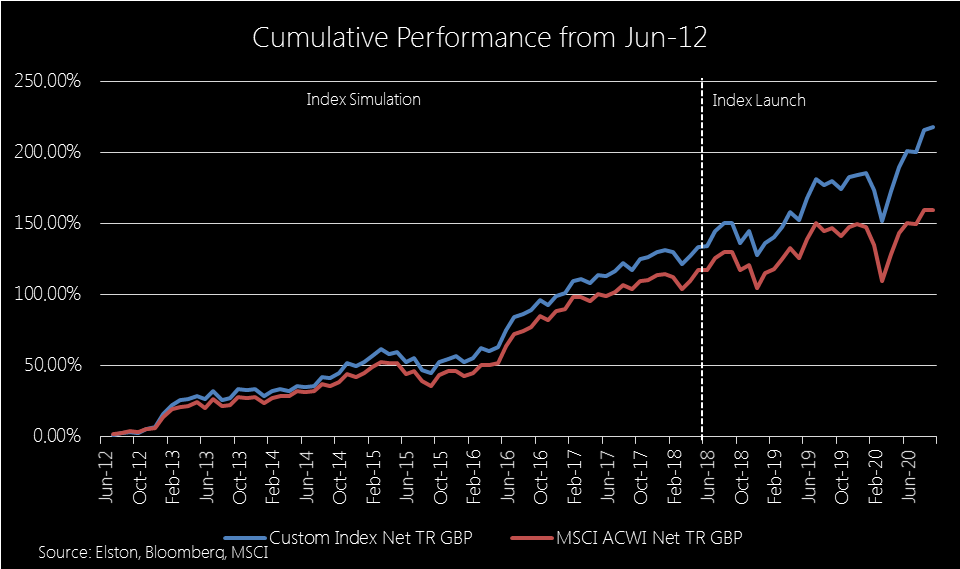 Zero Carbon Portfolio performance Similarly, the Zero Carbon portfolio has delivered comparable performance to MSCI World – hence no “missing out” on the opportunity set whilst being fully divested from fossil fuels. Although not intentional, the exclusion of Energy, Materials & Utilities has benefitted performance and meant that the performance, net of trading and ongoing ETF costs, is ahead of the MSCI World Index. Fig.2. Zero Carbon ETF portfolio performance from June 2018 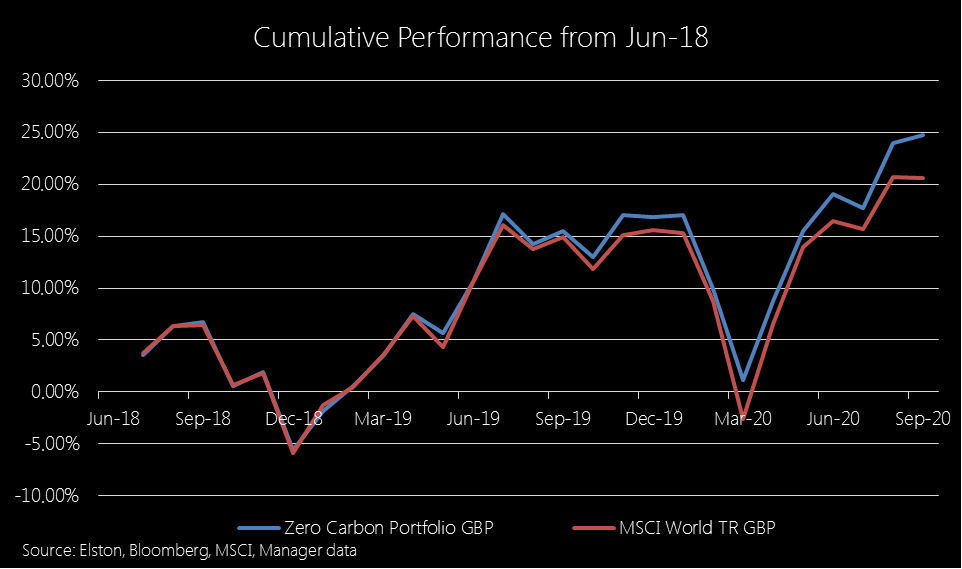 Summary
Whatever your views on the pros and cons of divestment, Zero Carbon investing is not an insurmountable challenge, and the combination of index solutions and ETF portfolios solutions creates a range of implementable options for asset owners and asset managers alike. IMPORTANT NOTICE ABOUT THE CUSTOM INDEX With reference to the MSCI ACWI ex Energy ex Materials ex Utilities SRI Index (“Custom Index”). Where Source: MSCI is noted, the following notice applies. Source: MSCI. The MSCI data is comprised of a custom index calculated by MSCI, and as requested by, Queens’ College Cambridge. The MSCI data is for internal use only and may not be redistributed or used in connection with creating or offering any securities, financial products or indices. Neither MSCI nor any third party involved in or relating to compiling, computing or creating the MSCI data (the “MSCI Parties”) makes any express or implied warranties or representations with respect to such data (or the results to be obtained by the use thereof), and the MSCI Parties hereby expressly disclaim all warranties of originality, accuracy, completeness, merchantability or fitness for a particular purpose with respect to such data. Without limiting any of the foregoing, in no event shall any of the MSCI Parties have any liability for any direct, indirect, special, punitive, consequential or any other damages (including lost profits) even if notified of the possibility of such damages.  Which asset classes are not indexable; what proxies do they have that can be indexed; and why it can make sense to blend ETFs and Investment Trusts for creating an allocation to alternative asset classes In this series of articles, I look at some of the key topics explored in my book “How to Invest With Exchange Traded Funds” that also underpin the portfolio design work Elston does for discretionary managers and financial advisers. Non-indexable asset classes Whilst Equities, Bonds and Cash are readily indexable, there are also exposures that will remain non-indexable because they are:
It is however possible to represent some of these alternative class exposures using liquid index proxies. Index providers and ETF issuers have worked on creating a growing number of indices for specific exposures in the Liquid Alternative Asset space. Some examples are set out below:
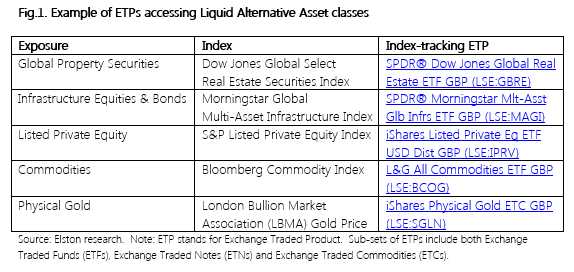 Alternative asset index proxies Whilst these liquid proxies for those asset classes are helpful from a diversification perspective, it is important to note that they necessarily do not share all the same investment features, and therefore do not carry the same risks and rewards as the less liquid version of the asset classes they represent. 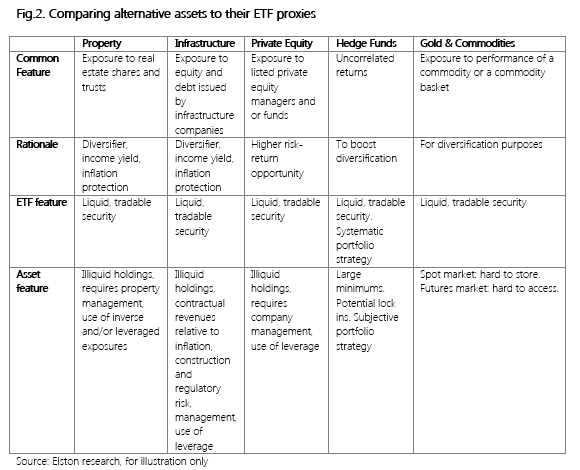 While ETFs for alternatives assets will not replicate holding the risk-return characteristics of that exposure directly, they provide a convenient form of accessing equities and/or bonds of companies that do have direct exposure to those characteristics. Using investment trusts for non-index allocations Ironically, the investment vehicle most suited for non-indexable investments is the oldest “Exchange Traded” collective investment there is: the Investment Company (also known as a “closed-end fund” or “investment trust”). The first UK exchange traded investment company was the Foreign & Colonial Investment Trust, established in 1868. Like ETFs, investment companies were originally established to bring the advantages of a pooled approach to the investor of “moderate means”. 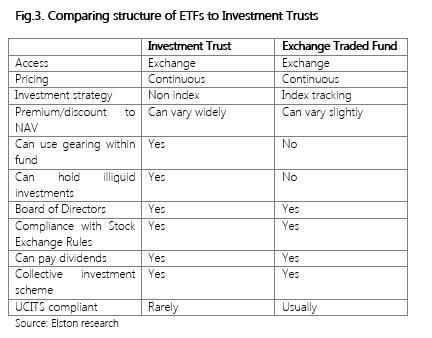 For traditional fund exposures, e.g. UK Equities, Global Equities, our preference is for ETFs over actively managed Investment Trusts owing to the performance persistency issue that is prevalent for active (non-index) funds. Furthermore, investment trusts have the added complexity of internal leverage and the external performance leverage created by the share price’s premium/discount to NAV – a problem that can become more intense during periods of market stress.
However, for accessing hard-to-reach asset classes, Investment Trusts are superior to open-ended funds, as they are less vulnerable to ad hoc subscriptions and withdrawals. The Association of Investment Company’s sector categorisations gives an idea of the non-indexable asset classes available using investment trusts: these include Hedge Funds, Venture Capital Trusts, Forestry & Timber, Renewable Energy, Insurance & Reinsurance Strategies, Private Equity, Direct Property, Infrastructure, and Leasing. A blended approach Investors wanting to construct portfolios accessing both indexable investments and non-indexable investments could consider constructing a portfolio with a core of lower cost ETFs for indexable investments and a satellite of higher cost specialist investment trusts providing access to their preferred non-indexable investments. For investors, who like non-index investment strategies, this hybrid approach may offer the best of both world. Summary The areas of the investment opportunity set that will remain non-indexable, are (in our view) those that are hard to replicate as illiquid in nature (hard to access markets or parts of markets); and those that require or reward subjective management and skill. Owing to the more illiquid nature of underlying non-indexable assets, these can be best accessed via a closed-ended investment trust that does not have the pressure of being an open-ended fund. ETFs provide a convenient, diversified and cost-efficient way of accessing liquid alternative asset classes that are indexable and provide a proxy or exposure for that particular asset class. Examples include property securities, infrastructure equities & bonds, listed private equity, commodities and gold. [2 min read. Buy the full report] We compare the performance of risk-weighted multi-asset strategies relative to a Global Equity index and our Elston 60/40 GBP Index, which reflects a traditional asset-weighted approach. Of the risk-weighted strategies, Elston Dynamic Risk Parity Index delivered best -1Y total return at +3.03%, compared to +5.01% for global equities and +0.95% for the Elston 60/40 GBP Index. 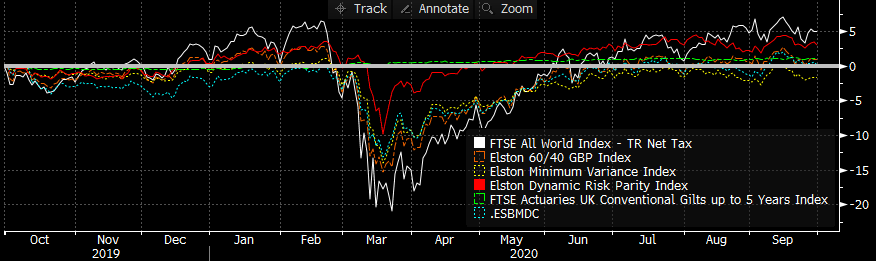 Source: Bloomberg data, as at 30/09/20 On a risk-adjusted basis, Risk Parity delivered a -1Y Sharpe Ratio of 0.27, compared to 0.18 for Global Equities, meaning Risk Parity delivered the best risk-adjsuted returns for that period. 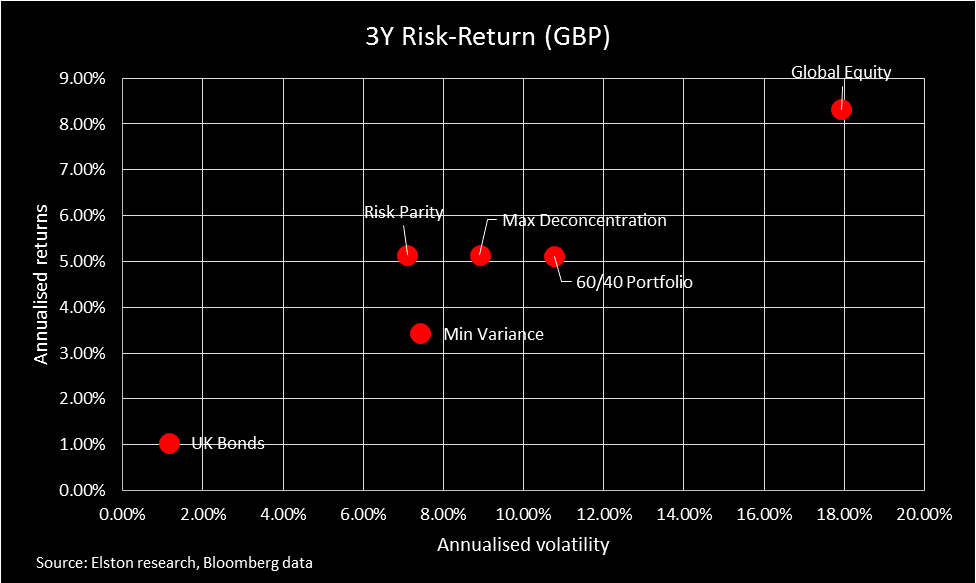 Risk Parity also delivered greatest differentiation impact of the risk-weighted strategies with a -45.8% reduction in correlation and -77.3% reduction in beta relative to Global Equities. This enables "true diversification" whilst maintaing potential for returns. By contrast the Elston 60/40 Index, whilst successfully reducing beta by -40.9%, delivered a correlation reduction of only -2.9%. Put differently, a traditional 60/40 portfolio offers negligbile diversification effect in terms of risk-based diversification through reduced correlation. 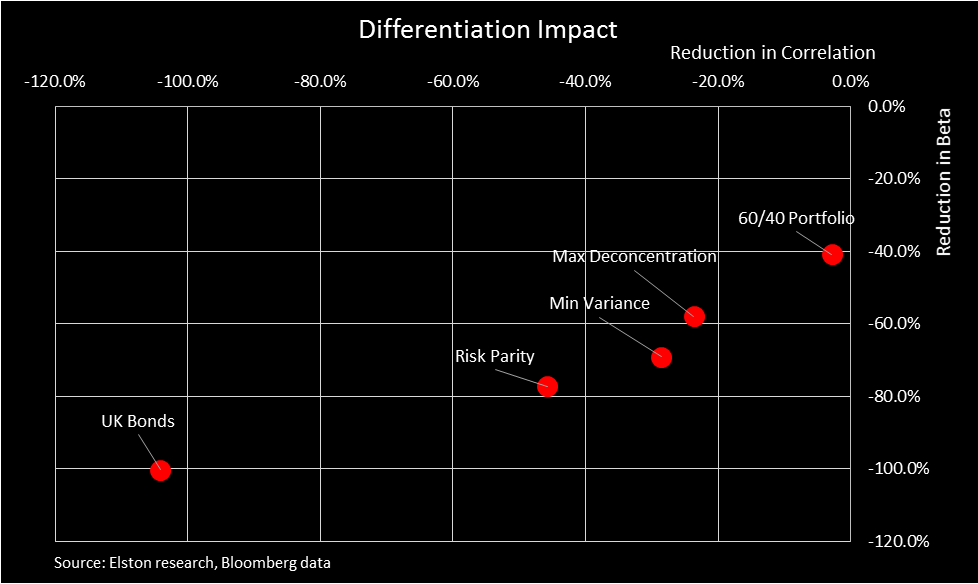 The periodic table shows lack of direction amongst risk-weighted strategies in the quarter. 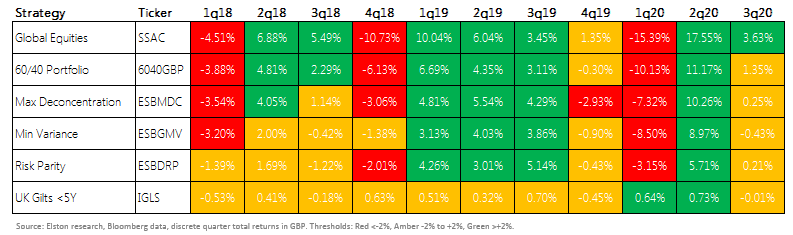 All data as at 30th September 2020
© Elston Consulting 2020, all rights reserved  [5 minute read, open as pdf] Sign up for our upcoming CPD webinar on Real Assets for diversification
What are “Real Assets”? Real Assets can be defined as “physical assets that have an intrinsic worth due to their substance and property”[1]. Real assets can be taken to include precious metals, commodities, real estate, infrastructure, land, equipment and natural resources. Because of the “inflation-protection” objective of investing in real assets (the rent increases in property, the tariff increases in infrastructure), real asset funds also include exposure to inflation-linked government bonds as a financial proxy for a real asset. Why own Real Assets? There are a number of rationales for investing in Real Assets. The primary ones are to:
Accessing Real Assets Institutional investors can access Real Assets directly and indirectly. They can acquired direct property and participate in the equity or debt financing of infrastructure projects. Directly. For example, the Pensions Infrastructure Platform, established in 2021 has enabled direct investment by pension schemes into UK ferry operators, motorways and hospital construction projects. This provides funding for government-backed project and real asset income and returns for institutional investors. Institutional investors can also access Real Assets indirectly using specialist funds as well as mainstream listed funds such as property securities funds and commodities funds. Retail investors can access Real Assets mostly indirectly through funds. There is a wide range of property funds, infrastructure funds, commodity funds and natural resources funds to choose from. But investors have to decide on an appropriate fund structure.
The rise of real asset funds The first UK diversified real asset fund was launched in 2014, with competitor launches in 2018. There is now approximately £750m invested across the three largest real asset funds available to financial advisers and their clients, with fund OCFs ranging from 0.97% to 1.46%. Following the gating of an Equity fund (Woodford), a bond fund (GAM) and several property funds for liquidity reasons, there has – rightly – been increased focus by the regulator and fund providers (Authorised Corporate Directors or “ACDs”) on the liquidity profile of underlying assets. As a result, given their increased scale, real asset fund managers are increasingly turning to mainstream funds and indeed liquid ETFs to gain access to specific asset classes. Indeed, on our analysis, one real assets funds has the bulk of its assets invested in mainstream funds and ETFs that are available to advisers directly. Now there’s no shame in that – part of the rationale for using a Real Assets fund is to select and combine funds and manage the overall risk of the fund. But what it does mean is that discretionary managers and advisers have the option of creating diversified real asset exposure, using the same or similar underlying holdings, for a fraction of the cost to clients. Creating a liquid real asset index portfolio We have created the Elston Liquid Real Asset index portfolio of ETFs in order to:
We have built the index portfolio using the following building blocks
As regards asset allocation, we are targeting a look-through ~50/50 balance between equity-like securities and bond-like securities to ensure that the strategy provides beta reduction as well as diversification when included in a portfolio. For the index portfolio simulation, we have used an equal weighted approach. Fig.1. Performance of the Liquid Real Asset Index Portfolio (.ELRA) 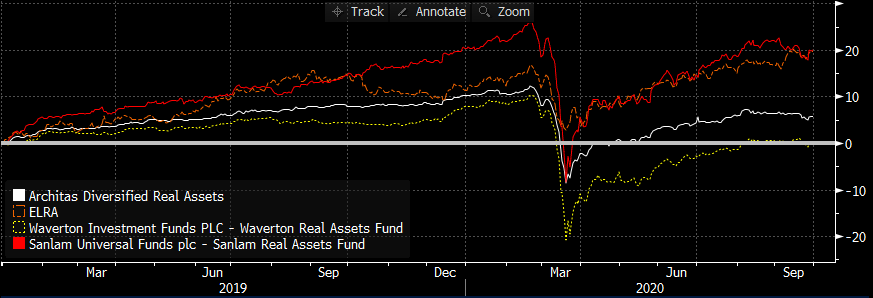 Source: Elston research, Bloomberg data. Total returns from end December 2018 to end September 2020 for selected real asset funds. Since December 2018, the Sanlam Real Assets fund has returned 19.99%, the Elston Real Asset Index Portfolio has returned +19.76%. This compares to +5.86% for the Architas Diversified Real Asset fund and +0.16% for the Waverton Real Assets Fund. What about Beta Our Real Asset Index Portfolio has a Beta of 0.75 to the Elston 60/40 GBP index so represents a greater risk reduction than Waverton (0.86) and Sanlam (0.84), which are all higher beta than Architas (0.53). Fig.2. Real Asset strategies’ beta to a 60/40 GBP Index 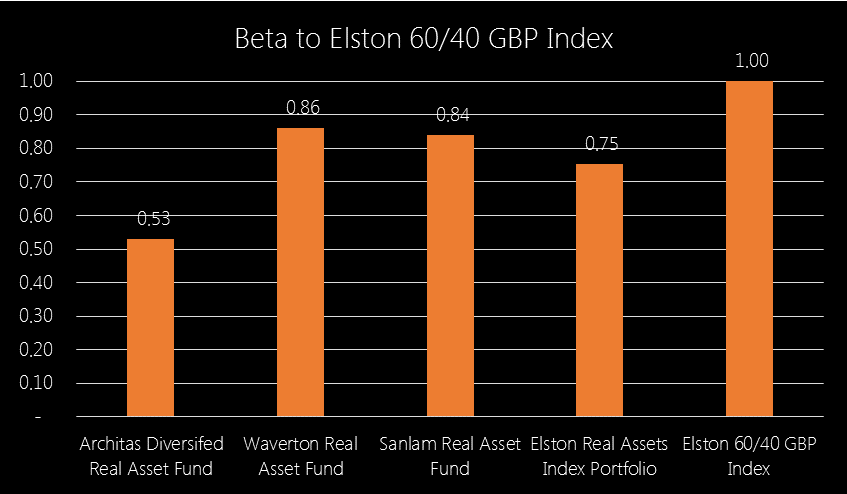 Source: Elston research, Bloomberg data. Weekly data relative to Elston 60/40 GBP Index, GBP terms Dec-18 to Sep-20. Finally, by accessing the real asset ETFs directly, there is no cost for the overall fund structure, hence the implementation cost for an index portfolio of ETFs is substantially lower. Fig.3. Cost comparison of Real Asset funds vs index portfolio of ETFs 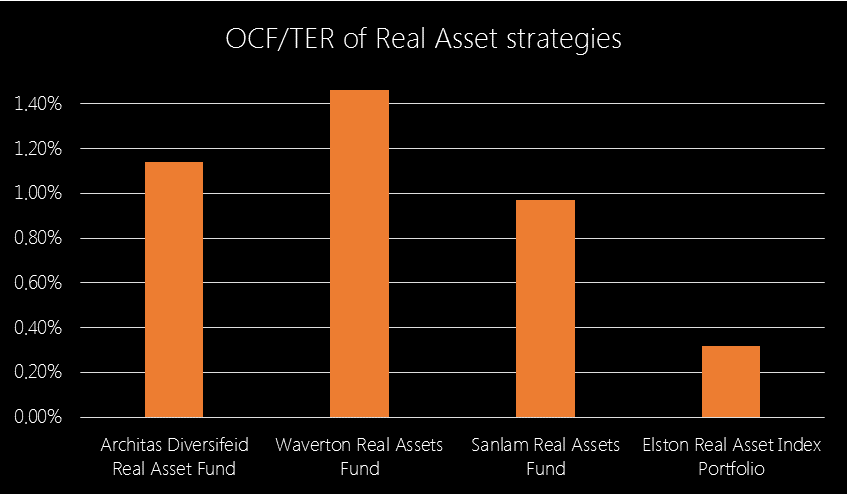 Source: Elston research, Bloomberg data
Fund or ETF Portfolio? The advantage of a funds-based approach is convenience (single-line holding), as well as having a a manager allocate dynamically between the different real asset exposures within the fund. The advantage of an index portfolio is simplicity, transparency and cost. Creating a managed ETF portfolio strategy that dynamically allocates to the different real asset classes over the market cycle is achievable and can be implemented on demand. Summary The purpose of this analysis was to note that:
[1] Source: https://www.investopedia.com/terms/r/realasset.asp  There’s no such thing as passive. Index investors make active decisions around asset allocation, index selection and index methodology. In this series of articles, I look at some of the key topics explored in my book “How to Invest With Exchange Traded Funds” that also underpin the portfolio design work Elston does for discretionary managers and financial advisers. If indices represent exposures, what is index investing and what are the ETFs that track them? Does using an index approach to investing mean you are a ‘passive investor’? I am not comfortable with the terms “active” and “passive”. A dynamically managed approach to asset allocation using index-tracking ETFs is not “passive”. The selection of an equal weighted index exposure over a cap weighted index is also an active decision. The design of an index methodology, requires active parameter choices. Hence our preference for the terms “index funds” and “non-index funds”. Indices represent asset classes. ETFs track indices. Index investing is the use of ETFs to construct and manage an investment portfolio. The evolution of indices The earliest equity index in the US is the Dow Jones Industrial Average (DJIA) which was created by Wall street Journal editor Charles Dow. The index launched on 26 May 1896, and is named after Dow and statistician Edward Jones and consists of 30 large publicly owned U.S. companies. It is a price-weighted index (meaning the prices of each security are totalled and divided by the number of each security to derive the index level). The earliest equity index in the UK is the FT30 Index (previously the FN Ordinary Index) was created by the Financial Times (previously the Financial News). The index launched on 1st July 1935 and consists of 30 large publicly owned UK companies. It is an equal-weighted index (meaning each of the 30 companies has an equal weight in the index). The most common equity indices now are the S&P500 (launched in 1957) for the US equity market and the FTSE100 (launched in 1984) for the UK Equity market. These are both market capitalisation-weighted indices (meaning the weight of each company within the index is proportionate to its market capitalisation (the share price multiplied by the number of shares outstanding)). According to the Index Industry Association, there are now approximately 3.28m indices, compared to only 43,192 public companies . This is primarily because of demand for highly customised versions of various indices used for benchmarking equities, bonds, commodities and derivatives. By comparison there are some 7,178 index-tracking ETPs globally. The reason why the number of indices is high is not because they are all trying to do something new, but because they are all doing something slightly different. For example, the S&P500 Index, the S&P500 (hedged to GBP) Index and the S&P 500 excluding Technology Index are all variants around the same core index. So the demand for indices is driven not only by investor demand for more specific and nuanced analysis of particular market exposures, but also for innovation from index providers. What makes a good index benchmark? For an index to be a robust benchmark, it has to meet certain criteria. Indices provided a combined price level (and return level) for a basket of securities for use as a reference, benchmark or investment strategy. Whilst a reference point is helpful, the use of indices as benchmarks enables informed comparison of fund or portfolio strategies. An index can be used as a benchmark so long as it has the following qualities (known as the “SAMURAI” test based on the mnemonic based on key benchmark characteristics in the CFA curriculum). It must be:
Alternative weighting schemes Whereas traditional equity indices took a price-weighted, equal-weighted or market capitalisation weighted approach, there are a growing number of indices that have alternative weighting schemes: given the underlying securities are the same, these variation of weighting scheme also contributes to the high number of indices relative to underlying securities. The advent of growing data and computing power means that indices have become more granular to reflect investors desire for more nuanced exposures and alternative weighting methodologies . 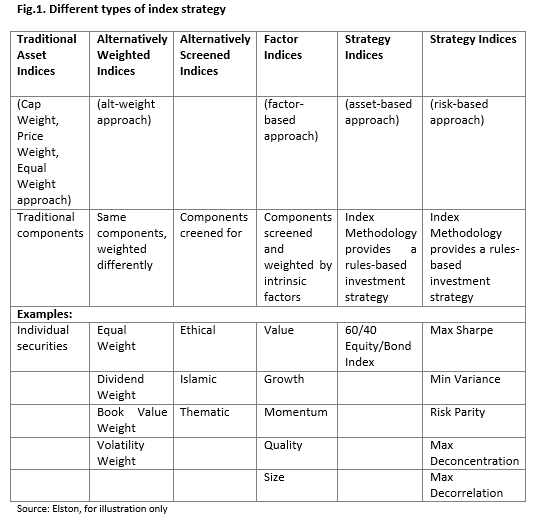 Whether indices are driven by investor needs for isolated asset class exposures or by other preferences, there is a growing choice of building blocks for portfolio constructors.
Index investing Whilst indices have traditionally been used for performance measurement, if the Efficient Markets Hypothesis holds true, it makes sense to use an index as an investment strategy. A fund that matches the weightings of the securities within an index is an index-tracking fund. The use of single or multiple funds that track indices to construct and manage a portfolio is called “index investing”. We define index investing as 1) using indices (whether traditional cap-weighted or alternatively weighted) to represent the various exposures used within a strategic or tactical asset allocation framework, and 2) using index-tracking ETFs to achieve access to that exposure and/or asset allocation. The advantages of index investing with ETFs are:
As index investors we have a choice of tools at our disposal. The primary choice is to whether to use Index Funds or ETPs to get access to a specific index exposure. Index funds and ETPs Exchange Traded Products (ETPs) is the overarching term for investment products that are traded on an exchange and index-tracking. There are three main sub-sets:
Individual investors are most likely to come across physical Exchange Traded Funds and some Exchange Traded Commodities such as gold. Professional investors are most likely to use any or all types of ETPs. Both individual and professional investors alike are using ETPs for the same fundamental purposes: as a precise quantifiable building block with which to construct and manage a portfolio. Index investors have the choice of using index funds or ETFs. Index funds are bought or sold from the fund issuer, not on an exchange. ETFs are bought or sold on an exchange. For individual investors index funds may not be available at the same price point as for institutional investors. Furthermore, the range of index funds available to individual investors is much less diverse than ETFs. Trading index funds takes time (approximately 4-5 days to sell and settle, 4-5 days to purchase, so 8-10 days to switch), whereas ETFs can be bought on a same-day basis, and cash from sales settles 2 days after trading reducing unfunded round-trip times to 4 days for switches. If stock brokers allow it, they may allow purchases of one transaction to take place based on the sales proceeds of another transaction so long as they both settle on the same day. The ability to trade should not be seen as an incentive to trade, rather it enables the timely reaction to material changes in the market or economy. For professional investors, some index funds are cheaper than ETFs. Where asset allocation is stable and long-term, index funds may offer better value compared to ETFs. Where asset allocation is dynamic and there are substantial liquidity or time-sensitive implementation requirements, ETFs may offer better functionality than index funds. Professional investors can also evaluate the use of ETFs in place of index futures . For significant trade sizes, a complete cost-benefit analysis is required. The benefit of the ETF approach being that futures roll can be managed within an ETF, benefitting from economies of scale. For large investors, detailed comparison is required in order to evaluate the relative merits of each. The benefits of using ETFs There are considerable benefits of using ETFs when constructing and managing portfolios. Some of these benefits are summarised below:
Summary There’s no such thing as “passive investing”. There is such a thing as “index investing” and it means adopting a systematic (rules-based), diversified and transparent approach to access target asset class, screened, factor or strategy exposures in a straightforward, or very nuanced way. It is the systematisation of the investment process that enables competitive pricing, relative to active, “non-index” funds. This is a trend which has a long way to run before any “equilibrium” between index and active investing is reached. Most investors, automatically enrolled into a workplace pension scheme are index investors without knowing it. The “instutionalisation of retail” means that a similar investment approach is permeating into other channels such as discretionary managers, financial advisers, and self-directed investors. © Elston Consulting 2020 all rights reserved The objective of this CPD module is to understand the principles of Retirement Investing. Learning Outcomes By completing, this CPD module, you should be able to:
A. Explain the theory underpinning lifecycle investing B. Contrast and compare the different investment approaches for accumulation and decumulation C. Summarise the different types of income strategies for retirement investing Watch this CISI-endorsed Elston CPD webinar Different objectives and different risks requires a different approach.
Watch the replay of this CISI-endorsed CPD webinar  [5 minute read, open as pdf] Sign up for our upcoming CPD webinar on diversifying income risk Summary
Dividend concentration risk is not new, just more visible A number of blue chip companies announced dividend reductions or suspensions in response to financial pressure wrought by the Coronavirus outbreak. This brought into light the dependency, and sometimes over-dependency, on a handful of income-paying companies for equity income investors. For UK investors in the FTSE 100, the payment of dividends from British blue chip companies provides much of its appeal. However a look under the bonnet shows a material amount of dividend concentration risk (the over-reliance on a handful of securities to deliver a dividend income). On these measures, 53% of the FTSE 100’s dividend yield comes from just 8 companies; whilst 22% of its dividend yield comes from energy companies. The top 20 dividend contributors provide 76% of the dividend yield. We measure dividend concentration risk by looking at the product of a company’s weight in the index and its dividend yield, to see its Contribution to Yield of the overall index. Fig.1. FTSE 100 Contribution to Yield, ranked 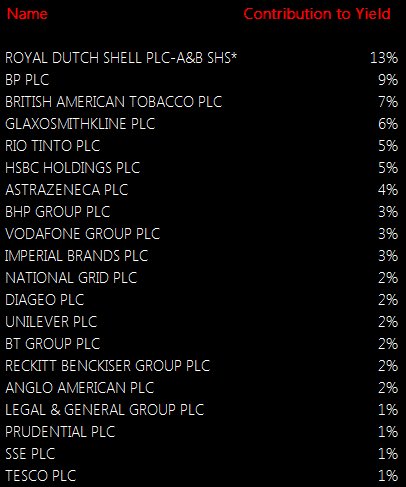 Source: Elston research, Bloomberg data, as at June 2020 Quality of Income More important than the quantity of the dividend yield, is its quality. As income investors found out this year, there’s a risk to having a large allocation to a dividend payer if it cuts or cancels its dividend. Equally, there’s a risk to having a large allocation to a dividend payer, whose yield is only high as a reflection of its poor value. Screening for high dividend yield alone can lead investors into “value-traps” where the income generated looks high, but the total return (income plus capital growth) generated is low. Contrast the performance of these UK Equity Income indices, for example. Fig.2. UK Equity Income indices contrasted 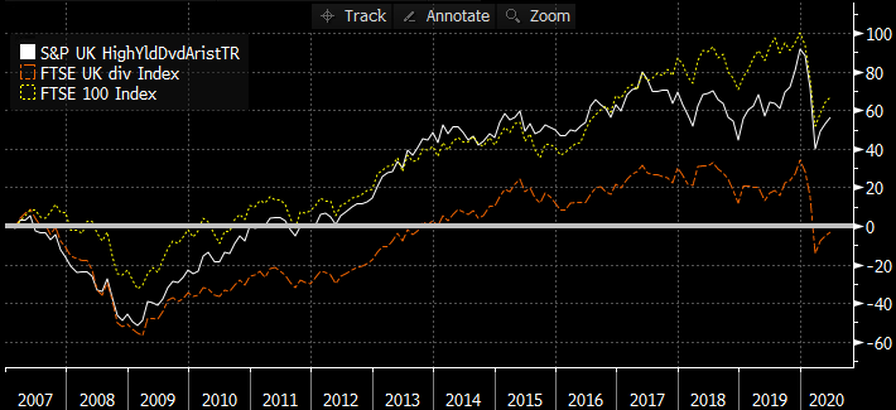 Source: Elston research, Bloomberg data. Total returns from end December 2006 to end June 2020 for selected UK Equity Indices. Headline Yield as per Bloomberg data as at 30th June 2020 for related ETFs. The headline yield for the FTSE UK Dividend+, FTSE 100 and S&P UK Dividend Aristocrat Indices was 8.10%, 4.44%, and 4.07% respectively as at end June 2020. However, the annualised long-run total return (income plus capital growth) 1.03%, 4.29% and 4.82% respectively. Looking at yield alone is not enough. The dependability of the dividends, and the quality of the dividend paying company are key to overall performance. Mitigating dividend concentration risk: quality yield, with low concentration The first part of the solution is to focus on high quality dividend-paying companies. One of the best indicators of dividend quality is a company’s dividend policy and track record. A dependable dividend payer is one that has paid the same or increased dividend year in, year out, whatever the weather. The second part of the solution is to consider concentration risk and make sure that companies’ weights are not skewed in an attempt to chase yield. This is evident by contrasting the different index methodologies for these equity income indices. The FTSE 100 does not explicitly consider yield (and is not designed to). The FTSE UK Dividend+ index ranks companies by their dividend yield alone. The S&P UK Dividend Aristocrats only includes companies that have consistently paid a dividend over several years, whilst ensuring there is no over-dependency on a handful of stocks. A look at the top five holdings of each index shows the results of these respective methodologies. Fig.3. Top 5 holdings of selected UK equity indices 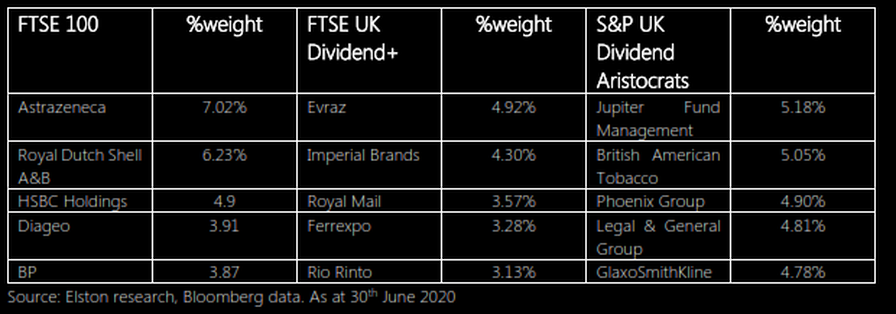 Put simply, the screening methodology adopted will materially impact the stocks selected for inclusion in an equity income index strategy. What about active managers? A study by Interactive Investor looked at the top five most commonly held stocks in UK Equity Income funds and investment trusts. For funds, the most popular holdings were GlaxoSmithKline, Imperial Brands, BP, Phoenix Group & AstraZeneca. For investment trusts, the most popular holdings are British American Tobacco, GlaxoSmithKline, RELX, AstraZeneca and Royal Dutch Sell. Unsurprisingly, each of the holdings above is also a constituent of the S&P Dividend Aristocrats index, hence ETFs that track this index simply provide a lower cost way of accessing the same type of company (dependable dividend payers with steady or increasing dividends), but using a systematic approach that enables a lower management fee. Understanding what makes dividend income dependable for an asset class such as UK equities, is only part of the picture of mitigating income risk. Income diversification is enabled by adopting a multi-asset approach. The advantage of a multi-asset approach The advantage of a multi-asset approach is two-fold. Firstly the ability to diversify equity income by geography for a more globalised approach, to benefit from economic and demographic trends outside the UK. Secondly the ability to diversify income by asset class, to moderate the level of overall portfolio risk. For investors who never need to dip into capital, have a very high capacity for loss, and can comfortably suffer the slings and arrows of the equity market, equity income works well – so long as the quality of dividends is addressed, as above. But for anyone else, where there is a need for income, but a preference for a more balanced asset allocation, a multi-asset income approach may make more sense. The rationale for a multi-asset approach is therefore to capture as much income as possible without taking as much risk as an all-equity approach. Value at Risk vs Income Reward There is always a relationship between risk and reward. For income investors, it’s no different. To be rewarded with more income, you need to take more risk with your capital. This means including equities over bonds, and, within the bonds universe, considering both credit quality (the additional yield from corporate and high yield bonds over gilts), and investment term (typically, the longer the term, the greater the yield). This overall level f risk being taken can be measured using a Value at Risk metric (a “worst case” measure of downside risk). If you want something with very low value-at-risk, shorter duration gilts can provide that capital protection, but yields are very low. Even nominally “safe” gilts, with low yields, nonetheless have potential downside risk owing to their interest rate sensitivity (“duration”). UK Equities offer a high yield, but commensurately also carry a much higher downside risk. The relationship between yield and Value-at-Risk (a measure of potential downside risk) is presented below. Fig.4. Income Yield vs Value at Risk of selected asset classes/indices 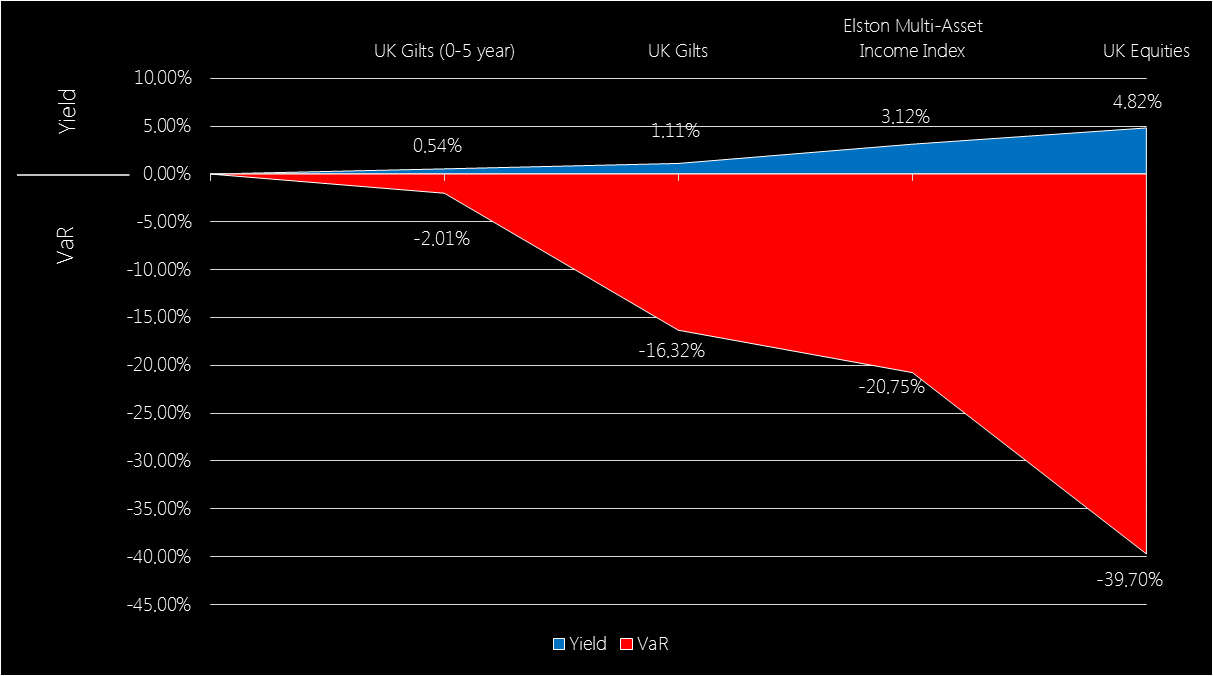 Source: Elston research, Bloomberg data, as at 30th June 2020. Note: an investment with a Value at Risk (“VaR”) of -10% (1 year, 95% Confidence) means there is, to 95% confidence (a 1 in 20 chance), a risk of losing 10% of the value of your investment over any given year. Asset class data reflects representative ETFs.
Our Multi-Asset Income index has, unsurprisingly, a risk level between that of gilts and equities, and captures approximately 65% of the yield, but with only 52% of the Value-at-Risk. Summary How you get your income – whether from equities, bonds or a mix – is critical to the amount of risk an investor is willing and able to take, and is a function of asset allocation. Understanding the asset allocation of an income funds is key to understanding its risks (for example, Volatility, Value at Risk and Max Drawdown). The dependability of dividend income you receive - whether from value traps or quality companies; whether concentrated or diversified – is a function of security selection. This can be either manager-based (subjective), or index-based (objective). For investors requiring a dependable yield, a closer look at how income is generated – through asset allocation and dividend dependability – is key. In this CPD module we look at assessing suitability for drawdown and explore sequencing risk, income risk and durability of withdrawal rates.
Watch this CISI-endorsed Elston CPD Webinar |
ELSTON RESEARCHinsights inform solutions Categories
All
Archives
July 2024
|
 RSS Feed
Company |
Solutions |
|