|
[5 minute read, open as pdf] Sign up for our upcoming CPD webinar on diversifying income risk Summary
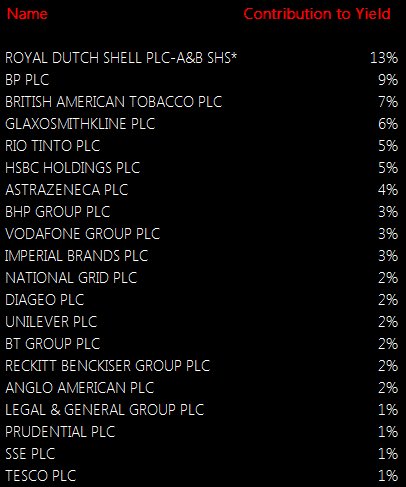
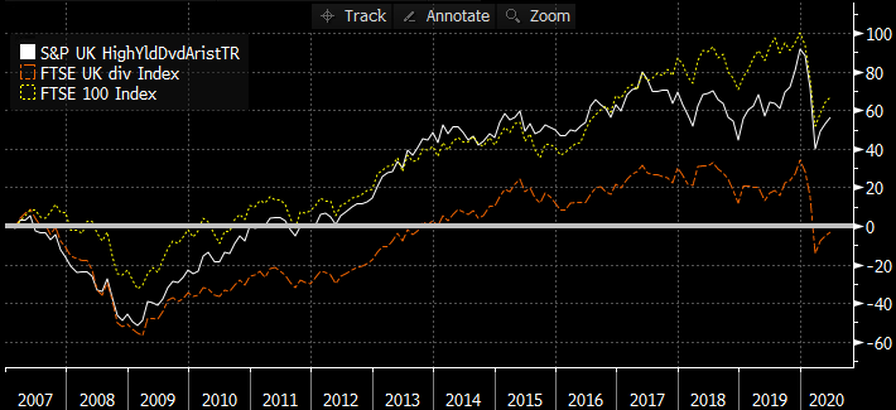
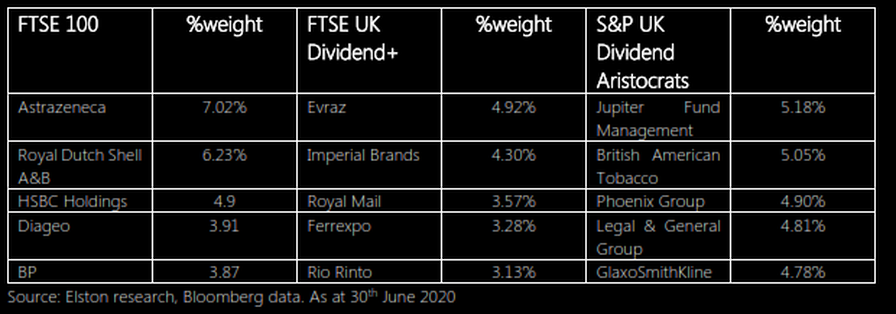
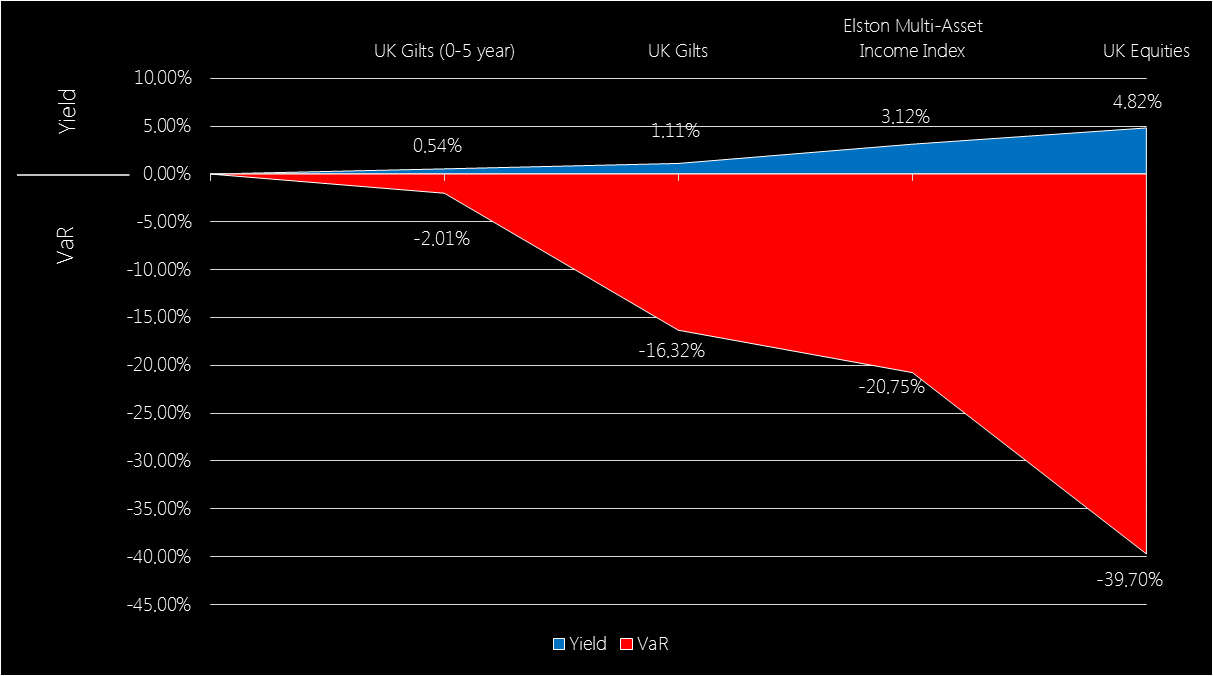
Dividend concentration risk is not new, just more visible A number of blue chip companies announced dividend reductions or suspensions in response to financial pressure wrought by the Coronavirus outbreak. This brought into light the dependency, and sometimes over-dependency, on a handful of income-paying companies for equity income investors. For UK investors in the FTSE 100, the payment of dividends from British blue chip companies provides much of its appeal. However a look under the bonnet shows a material amount of dividend concentration risk (the over-reliance on a handful of securities to deliver a dividend income). On these measures, 53% of the FTSE 100’s dividend yield comes from just 8 companies; whilst 22% of its dividend yield comes from energy companies. The top 20 dividend contributors provide 76% of the dividend yield. We measure dividend concentration risk by looking at the product of a company’s weight in the index and its dividend yield, to see its Contribution to Yield of the overall index. Fig.1. FTSE 100 Contribution to Yield, ranked Source: Elston research, Bloomberg data, as at June 2020 Quality of Income More important than the quantity of the dividend yield, is its quality. As income investors found out this year, there’s a risk to having a large allocation to a dividend payer if it cuts or cancels its dividend. Equally, there’s a risk to having a large allocation to a dividend payer, whose yield is only high as a reflection of its poor value. Screening for high dividend yield alone can lead investors into “value-traps” where the income generated looks high, but the total return (income plus capital growth) generated is low. Contrast the performance of these UK Equity Income indices, for example. Fig.2. UK Equity Income indices contrasted Source: Elston research, Bloomberg data. Total returns from end December 2006 to end June 2020 for selected UK Equity Indices. Headline Yield as per Bloomberg data as at 30th June 2020 for related ETFs. The headline yield for the FTSE UK Dividend+, FTSE 100 and S&P UK Dividend Aristocrat Indices was 8.10%, 4.44%, and 4.07% respectively as at end June 2020. However, the annualised long-run total return (income plus capital growth) 1.03%, 4.29% and 4.82% respectively. Looking at yield alone is not enough. The dependability of the dividends, and the quality of the dividend paying company are key to overall performance. Mitigating dividend concentration risk: quality yield, with low concentration The first part of the solution is to focus on high quality dividend-paying companies. One of the best indicators of dividend quality is a company’s dividend policy and track record. A dependable dividend payer is one that has paid the same or increased dividend year in, year out, whatever the weather. The second part of the solution is to consider concentration risk and make sure that companies’ weights are not skewed in an attempt to chase yield. This is evident by contrasting the different index methodologies for these equity income indices. The FTSE 100 does not explicitly consider yield (and is not designed to). The FTSE UK Dividend+ index ranks companies by their dividend yield alone. The S&P UK Dividend Aristocrats only includes companies that have consistently paid a dividend over several years, whilst ensuring there is no over-dependency on a handful of stocks. A look at the top five holdings of each index shows the results of these respective methodologies. Fig.3. Top 5 holdings of selected UK equity indices Put simply, the screening methodology adopted will materially impact the stocks selected for inclusion in an equity income index strategy. What about active managers? A study by Interactive Investor looked at the top five most commonly held stocks in UK Equity Income funds and investment trusts. For funds, the most popular holdings were GlaxoSmithKline, Imperial Brands, BP, Phoenix Group & AstraZeneca. For investment trusts, the most popular holdings are British American Tobacco, GlaxoSmithKline, RELX, AstraZeneca and Royal Dutch Sell. Unsurprisingly, each of the holdings above is also a constituent of the S&P Dividend Aristocrats index, hence ETFs that track this index simply provide a lower cost way of accessing the same type of company (dependable dividend payers with steady or increasing dividends), but using a systematic approach that enables a lower management fee. Understanding what makes dividend income dependable for an asset class such as UK equities, is only part of the picture of mitigating income risk. Income diversification is enabled by adopting a multi-asset approach. The advantage of a multi-asset approach The advantage of a multi-asset approach is two-fold. Firstly the ability to diversify equity income by geography for a more globalised approach, to benefit from economic and demographic trends outside the UK. Secondly the ability to diversify income by asset class, to moderate the level of overall portfolio risk. For investors who never need to dip into capital, have a very high capacity for loss, and can comfortably suffer the slings and arrows of the equity market, equity income works well – so long as the quality of dividends is addressed, as above. But for anyone else, where there is a need for income, but a preference for a more balanced asset allocation, a multi-asset income approach may make more sense. The rationale for a multi-asset approach is therefore to capture as much income as possible without taking as much risk as an all-equity approach. Value at Risk vs Income Reward There is always a relationship between risk and reward. For income investors, it’s no different. To be rewarded with more income, you need to take more risk with your capital. This means including equities over bonds, and, within the bonds universe, considering both credit quality (the additional yield from corporate and high yield bonds over gilts), and investment term (typically, the longer the term, the greater the yield). This overall level f risk being taken can be measured using a Value at Risk metric (a “worst case” measure of downside risk). If you want something with very low value-at-risk, shorter duration gilts can provide that capital protection, but yields are very low. Even nominally “safe” gilts, with low yields, nonetheless have potential downside risk owing to their interest rate sensitivity (“duration”). UK Equities offer a high yield, but commensurately also carry a much higher downside risk. The relationship between yield and Value-at-Risk (a measure of potential downside risk) is presented below. Fig.4. Income Yield vs Value at Risk of selected asset classes/indices Source: Elston research, Bloomberg data, as at 30th June 2020. Note: an investment with a Value at Risk (“VaR”) of -10% (1 year, 95% Confidence) means there is, to 95% confidence (a 1 in 20 chance), a risk of losing 10% of the value of your investment over any given year. Asset class data reflects representative ETFs.
Our Multi-Asset Income index has, unsurprisingly, a risk level between that of gilts and equities, and captures approximately 65% of the yield, but with only 52% of the Value-at-Risk. Summary How you get your income – whether from equities, bonds or a mix – is critical to the amount of risk an investor is willing and able to take, and is a function of asset allocation. Understanding the asset allocation of an income funds is key to understanding its risks (for example, Volatility, Value at Risk and Max Drawdown). The dependability of dividend income you receive - whether from value traps or quality companies; whether concentrated or diversified – is a function of security selection. This can be either manager-based (subjective), or index-based (objective). For investors requiring a dependable yield, a closer look at how income is generated – through asset allocation and dividend dependability – is key. Comments are closed.
|
ELSTON RESEARCHinsights inform solutions Categories
All
Archives
July 2024
|
Company |
Solutions |
|


 RSS Feed