
 [5 min read, open as pdf]
For someone aged 65 with average life expectancy a bond fund isn’t enough to ensure portfolio durability. Over that term the biggest risk is inflation risk and it’s harder for nominal bonds to keep pace with inflation. Inflation-linked bonds bring in high interest rate sensitivity (duration). Whilst higher yields now make for a more interesting entry point, there’s plenty of solid yield available in high quality low cost index bond funds.
But to navigate the changing outlook within the bond market a managed bond fund should also be considered as a one stop diversified managed bond portfolio. Most retirees will need a multi-asset retirement portfolio to last the course. Bonds alone are not enough. Read the quote in Trustnet  [5 min read, as pdf]
 Whether using bond funds or investing directly, bond investing requires thinking about the outlook for interest rates, inflation expectation, credit spreads and currency direction (if applicable) and how those variables impact bond valuations.
Read the article in FT Adviser  [5min read, open as pdf]
 [5 min read, open as pdf]
 Central Banks' policy rates are expected to pivot towards cuts in 2024 with a material impact on asset class perspectives.
Read the full article in FT Adviser Elston Consulting fund selector Jackie Qiao discusses how she sees active funds evolving over the next decade.
Read in full [3 min read, open as pdf]
 [1 min read, open as pdf]
 Higher interest rates following increases in the Bank of England “Bank Rate” means yieldson cash are attractive once again. There are different ways to access cash yields: bank deposits, platform cash and moneymarket funds each have advantages and disadvantages. Minimising frictional costs, and maximising flexibility is key when developing a cashmanagement strategy, in our view.
In this research note for our clients, we explore the role of money market funds in providing a low risk platform-based Investment with a yield similar to Bank of England rates. Further reading: Read our October 2021 comparison of money market funds and fixed time deposits 
Read the full article here [3 min read] 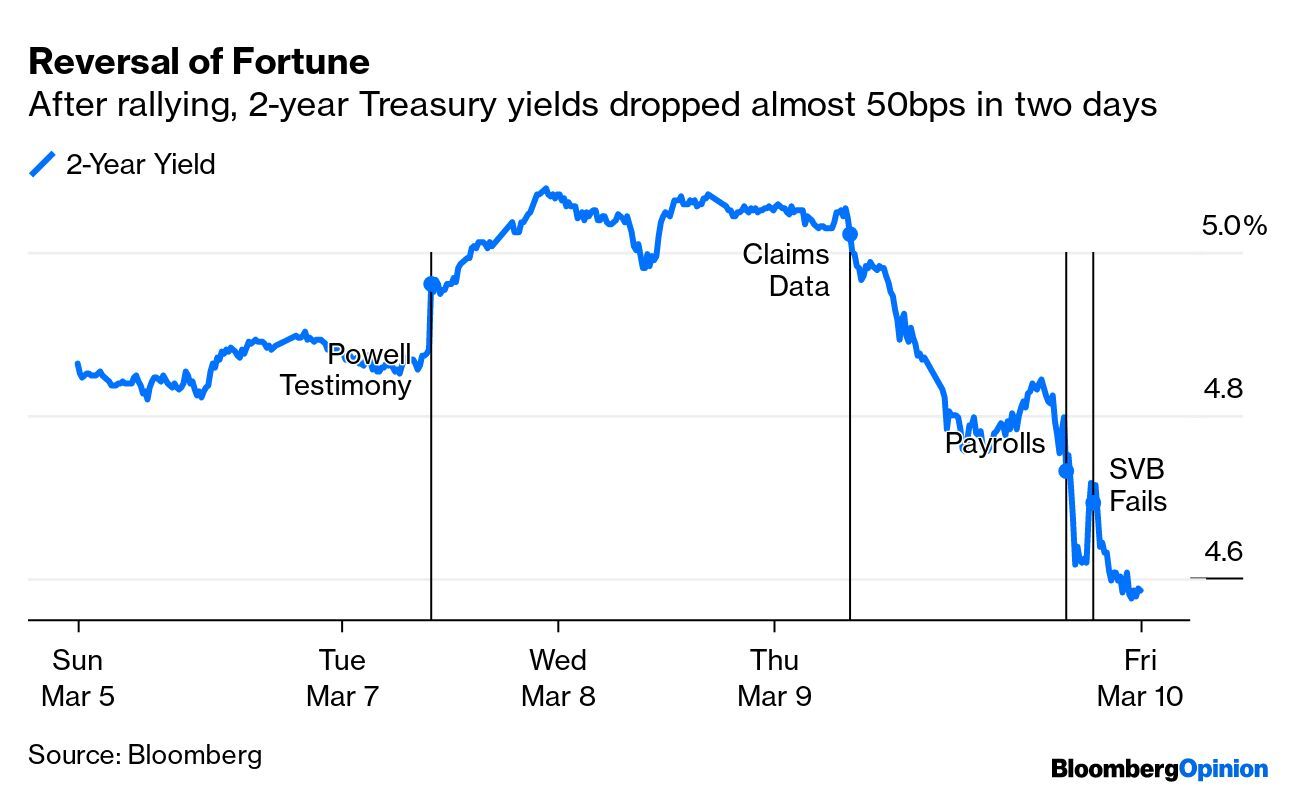 [5 min read, open as pdf]
 [5 min read, open as pdf]
 Wealth Manager's Ross Miller chats to Elston Consulting's Henry Cobbe. They discuss the return of yield and how it plays out across equities, bonds and alternatives.
Listen to the podcast  NMA speaks to investment consultant Henry Cobbe about positioning equities for higher inflation using sector and factor equity investing.
Listen to the podcast 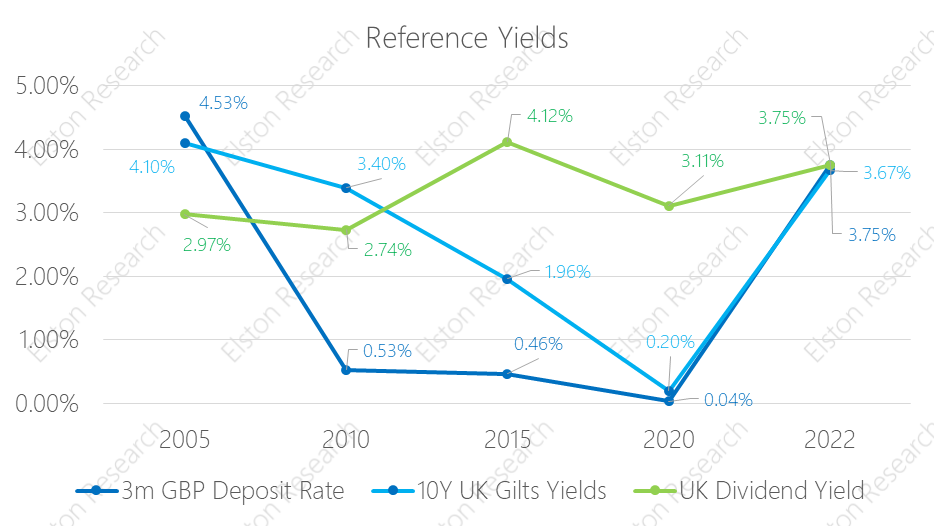 [5min read, open as pdf]
|
ELSTON RESEARCHinsights inform solutions Categories
All
Archives
July 2024
|
 RSS Feed
Company |
Solutions |
|