|
[3 min read, open as pdf]
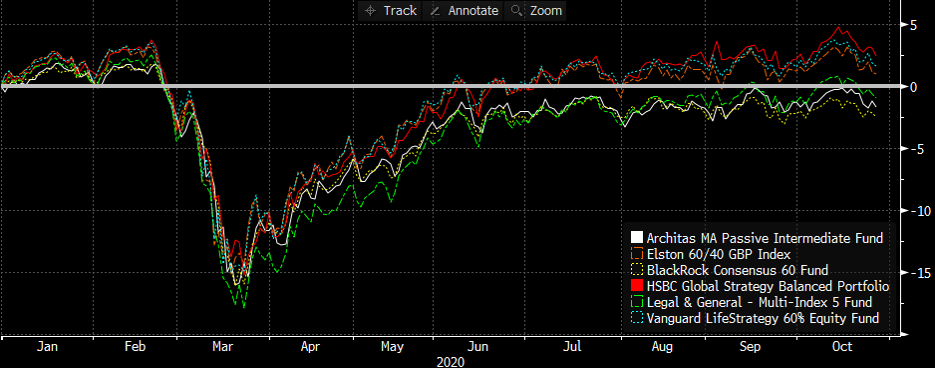
What do we mean by “Relative Risk” strategies We refer to asset-weighted multi-asset strategies with clearly defined equity allocations “relative risk” strategies. Why? Because as their asset weightings are relatively stable, their risk will fluctuate relative to equity risk, which is itself dynamic. The alternative to this approach is “target risk” strategies, where the asset weightings fluctuate to target a stable portfolio risk. The vast majority of risk profiled multi-asset portfolio and multi-asset funds are relative risk strategies, where risk can be defined as % equity exposure. Nowhere to hide The sudden severity of the COVID-related market downturn mean that the impact on “relative risk” strategies was similar. Broadly speaking, they took ~60% of the drawdown in global equities. A traditional asset-weighted approach can reduce beta to global equity, but not necessarily reduce correlation. In this respect, there was nowhere to hide for traditional relative risk multi-asset funds whose asset allocation is relatively stable. Fig.1. YTD Performance of “balanced” multi-asset passive funds Source: Elston research, Bloomberg data. Total returns from end December 2019 to 28th October 2020 What is visible, however, is the differing shape of recoveries. And this was predominantly a function of:
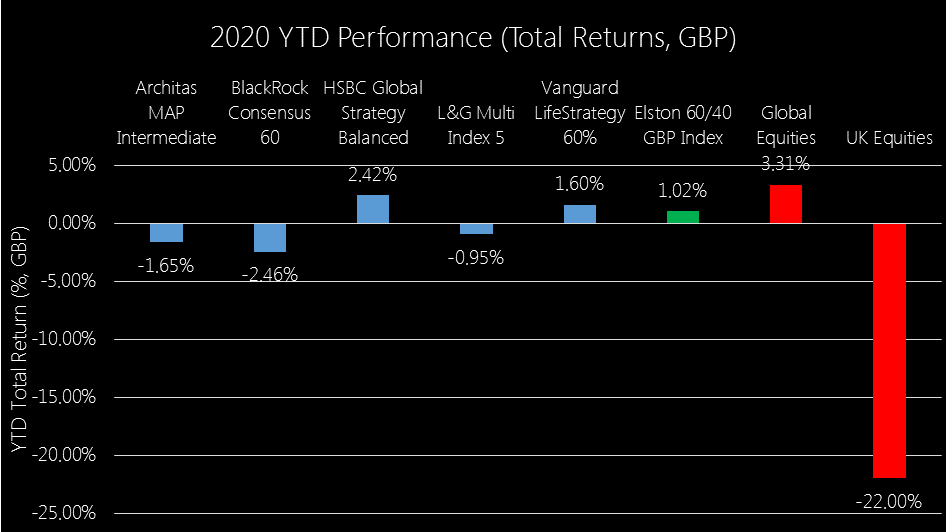
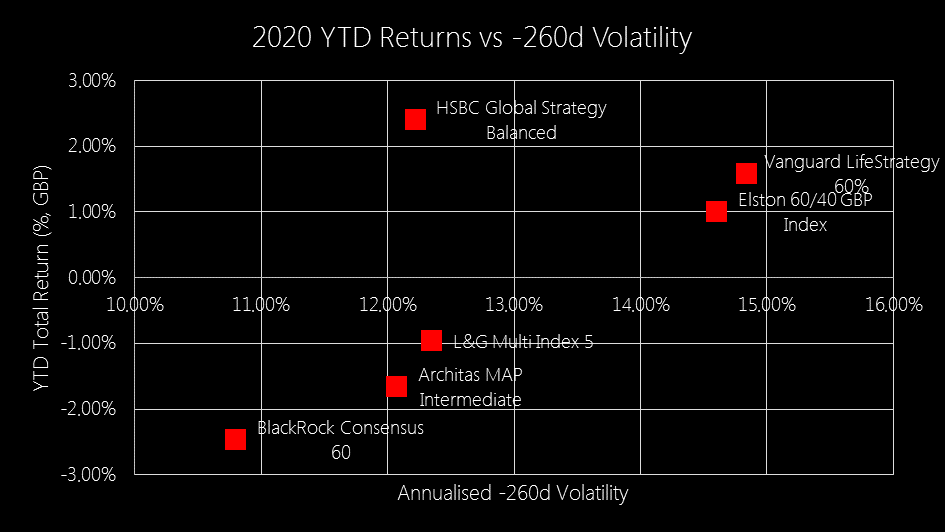
We look at summary YTD performance of selected multi-asset passive funds, relative to our Elston 60/40 GBP Index, Global Equities and UK Equities. At +2.42%, HSBC Global Strategy Balanced has delivered strongest return YTD, outperforming the Elston 60/40 GBP Index by 1.40ppt. At -2.46%, BlackRock Consensus 60 has delivered weakest return YTD, underperforming the Elston 60/40 GBP Index by -3.48ppt. Fig.2. 2020 YTD Performance Source: Elston research, Bloomberg data. Year to date as at 28/10/20. Total Returns in GBP terms. Global Equities represented by SSAC. UK Equities represented by ISF. Risk-adjusted returns For risk-adjusted returns, we compare YTD performance to the 260 day rolling volatility. On this basis, HSBC Global Strategy Balanced has delivered best risk-adjusted returns. On a risk-adjusted basis, HSBC Global Strategy Balanced delivered positive YTD returns and +1.40ppt outperformance relative to the Elston 60/40 GBP Index with approximately 84% of the volatility of the Elston 60/40 GBP Index. By contrast Vanguard LifeStrategy 60% Equity delivered positive YTD returns nd +0.58%ppt outperformance relative to the Elston 60/40 GBP Index with 102% of the volatility of the Elston 60/40 GBP Index. Fig.3. Risk-adjusted returns Source: Elston research, Bloomberg data, as at 28/10/20 Total Returns in GBP terms
Summary Based on this analysis
Comments are closed.
|
ELSTON RESEARCHinsights inform solutions Categories
All
Archives
July 2024
|
Company |
Solutions |
|


 RSS Feed