
|
[2 min read. Buy the full report] We compare the performance of risk-weighted multi-asset strategies relative to a Global Equity index and our Elston 60/40 GBP Index, which reflects a traditional asset-weighted approach. Of the risk-weighted strategies, Elston Dynamic Risk Parity Index delivered best -1Y total return at +3.03%, compared to +5.01% for global equities and +0.95% for the Elston 60/40 GBP Index. 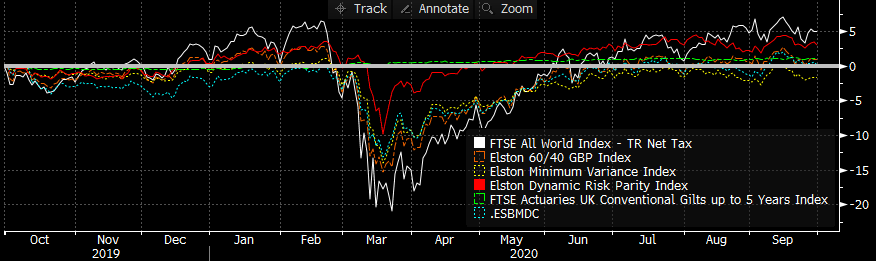 Source: Bloomberg data, as at 30/09/20 On a risk-adjusted basis, Risk Parity delivered a -1Y Sharpe Ratio of 0.27, compared to 0.18 for Global Equities, meaning Risk Parity delivered the best risk-adjsuted returns for that period. 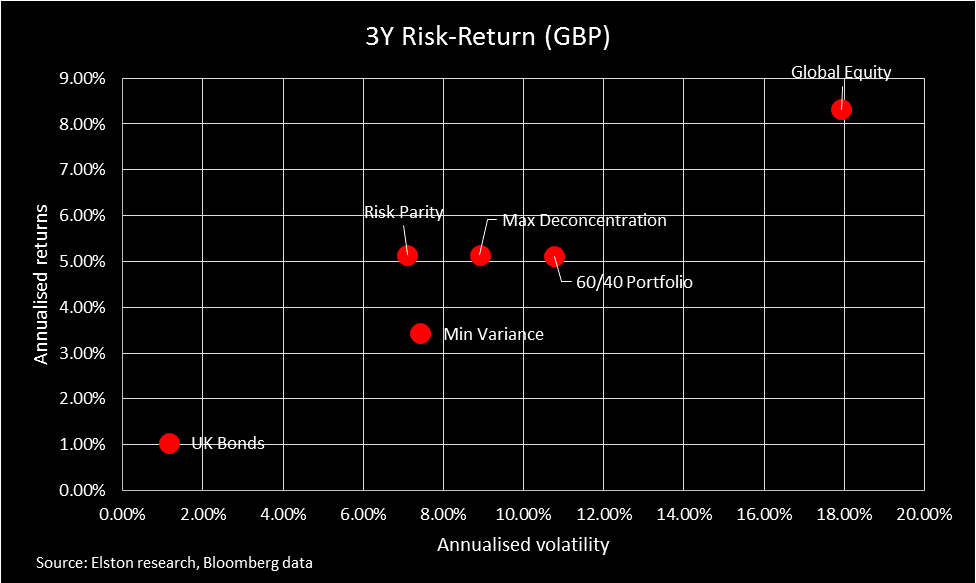 Risk Parity also delivered greatest differentiation impact of the risk-weighted strategies with a -45.8% reduction in correlation and -77.3% reduction in beta relative to Global Equities. This enables "true diversification" whilst maintaing potential for returns. By contrast the Elston 60/40 Index, whilst successfully reducing beta by -40.9%, delivered a correlation reduction of only -2.9%. Put differently, a traditional 60/40 portfolio offers negligbile diversification effect in terms of risk-based diversification through reduced correlation. 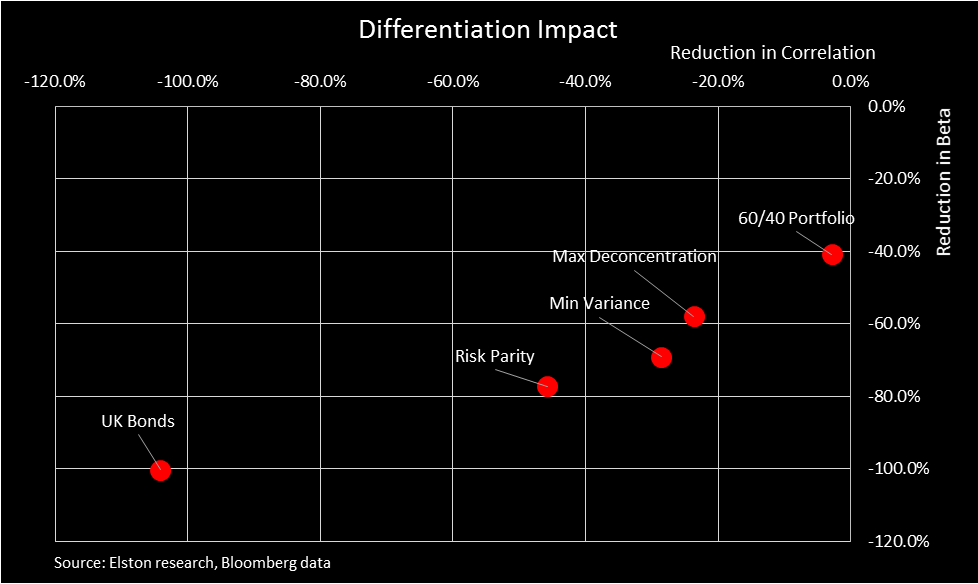 The periodic table shows lack of direction amongst risk-weighted strategies in the quarter. 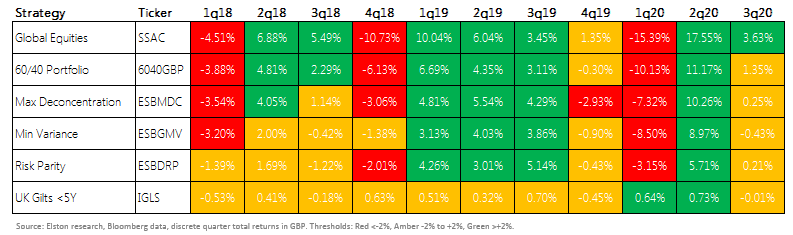 All data as at 30th September 2020
© Elston Consulting 2020, all rights reserved 
Liquid Alternatives: Assets We define Liquid Alternative Asset ETFs as tradable ETFs that hold liquid securities that provide access to a particular “alternative” (non-equity, non-bond) asset class exposure. More specifically, we define this as Listed Property Securities, Infrastructure Securities, Commodities, Gold and Listed Private Equity. Looking at selected ETF proxies for each of these asset classes, the correlations for these Liquid Alternative Assets, relative to Global Equity are summarised below. Fig.1. Liquid Alternative Assets: Correlation Matrix 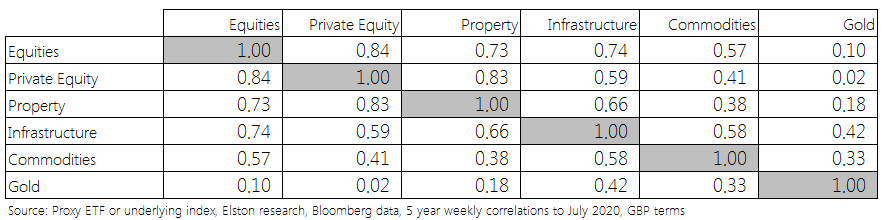 Incorporating these exposures within a multi-asset strategy provides can provide diversification benefits, both from an asset-based perspective and a risk-based perspective. Looking at 5 year annualised performance, only Gold has outperformed Global Equities. Listed Private Equity has been comparable. Meanwhile Infrastructure has outperformed property, whilst Commodities have been lack-lustre. Fig.2. Liquid Alternative Assets Returns vs Global Equities 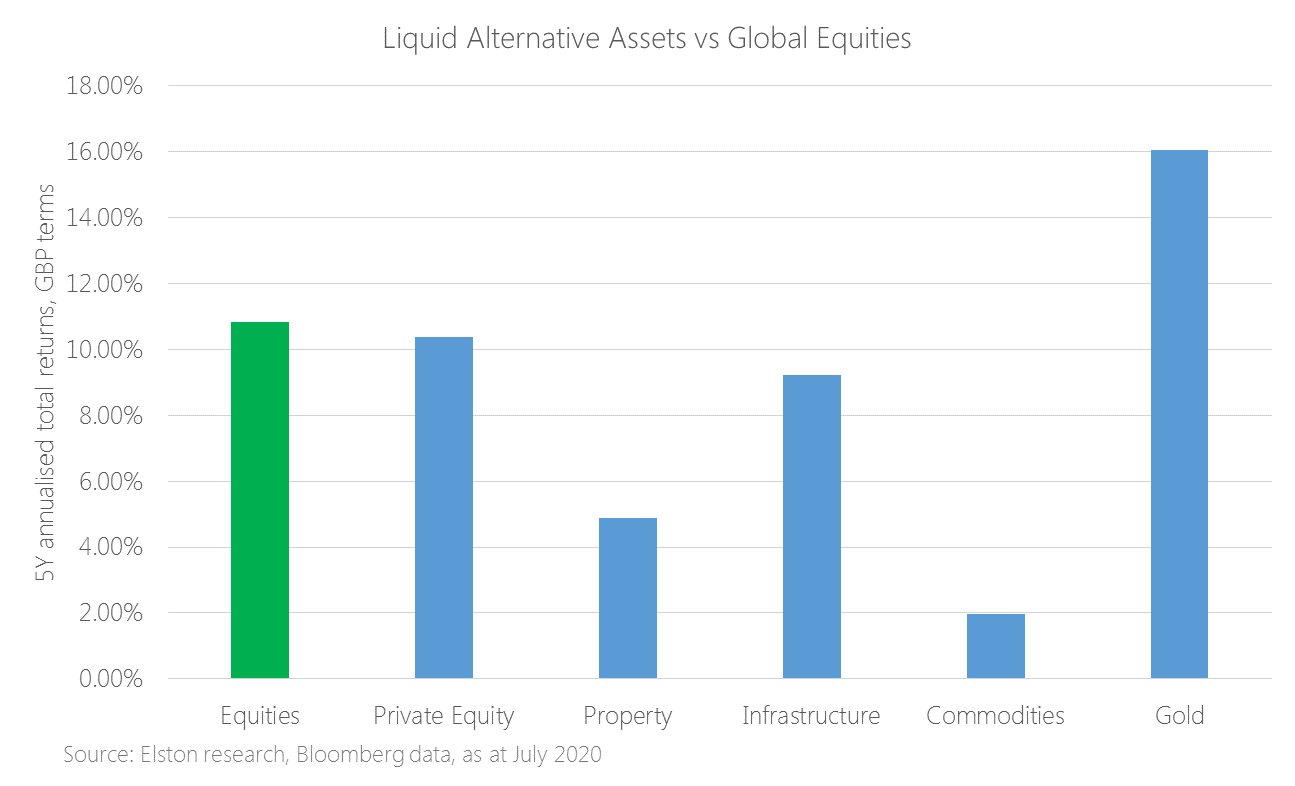 Looking at performance YTD, gold has returned +31.06% in GBP terms, outperforming Global Equities by 32.54ppt. Infrastructure has also slightly outperformed equities owing to its inflation protective qualities. Fig.3. YTD performance of Liquid Alternative Assets (GBP terms) 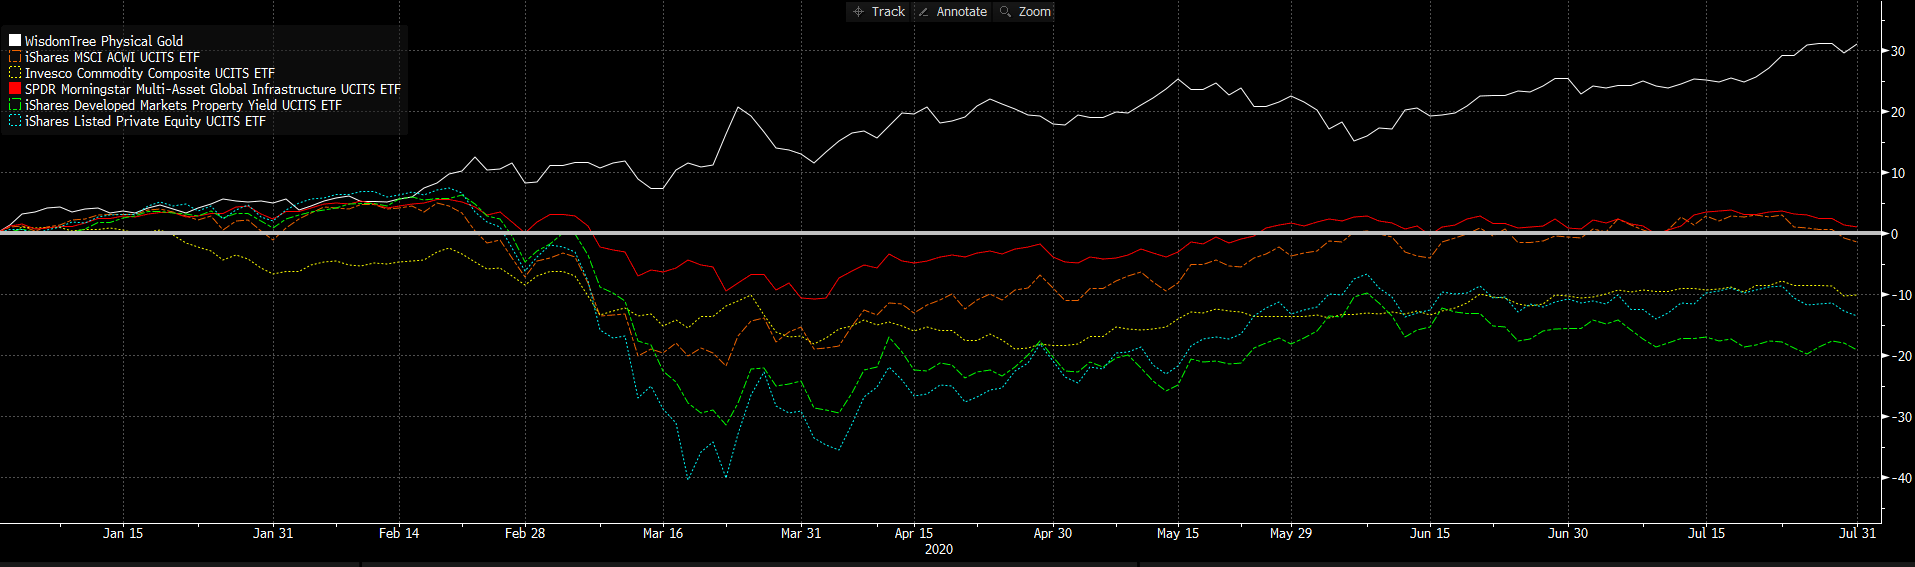 Source: Elston research, Bloomberg data Liquid Alternatives: Strategies We define Liquid Alternative Strategy ETFs as tradable ETFs that provide alternative asset allocation strategies. By providing differentiated risk-return characteristics, these ETFs should provide diversification and/or reflect a particular directional bias. Fig.4. Examples of European-listed Liquid Alternative Strategies 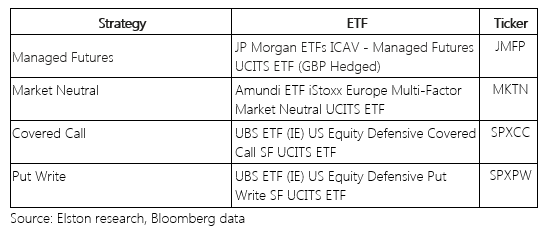 Each of these strategies provide a low degree of correlation with Global Equities and therefore have diversification benefits. Fig.5. Liquid Alternative Strategies: Correlation Matrix 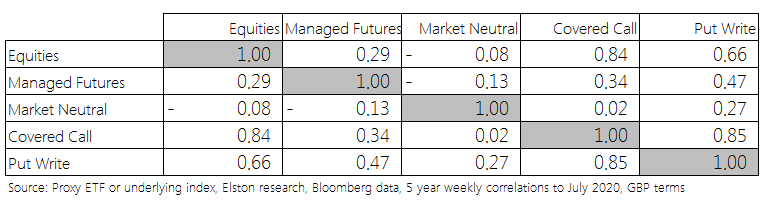 In 2020, the Market Neutral strategy has proven most defensive. Fig.6. Liquid Alternative Strategies: YTD performance 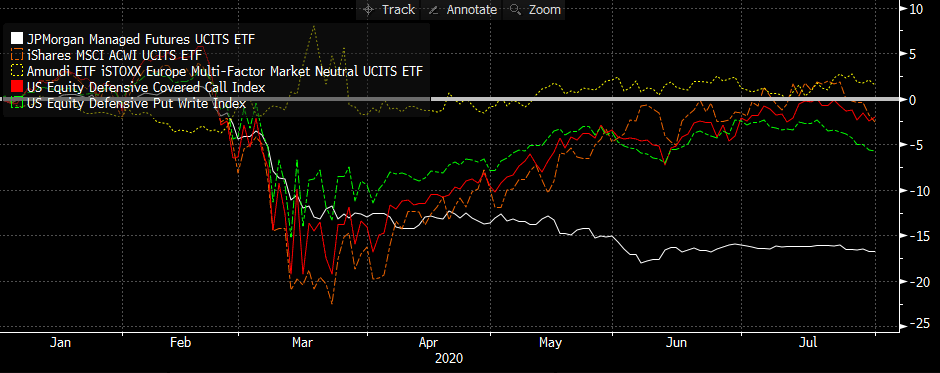 Source: Bloomberg data, GBP terms, as at July 2020 Conclusion ETFs offer a timely, convenient, transparent, liquid and low-cost way of allocating or deallocating to a particular exposure. Blending Liquid Alternative ETFs – both at an asset class level and a strategy level - provides managers with a broader toolkit with which to construct portfolios. NOTICES
Commercial Interest: Elston Consulting Limited creates research portfolios and administers indices that may or may not be referenced in this article. If referenced, this is clearly designated as such and is to raise awareness and provide purely factual information as regards these portfolios and/or indices. Image Credit: Shutterstock 
Why use options overlays? Managers of larger investment portfolios sometimes use options overlays to create an alternative payoff profile relative to a straightforward “long-only” equity holding of a share or index. This is done to reflect a particular investment view. Examples of options overlay strategies include Covered Calls and Put Writes. These strategies to protect investments when markets move sideways and there is higher potential for downside risk. This typically comes at the expense of explicit costs and foregone returns. What is a covered call strategy? A Covered Call strategy combines a holding in equities with sales of call options (an option to buy an equity at a given price within a specific time) on those equities. In other words, it can be seen as sacrificing unknown future gains on equities in exchange for a known income today. These aim is 1) to generate returns through income from those sales and 2) reduce downside risk. What is a written put strategy? A Put Write strategy combines a cash exposure with sales of put options (an option to sell an equity at a given price within a specific time) on those equities, with the aim of generating an income from option sales whilst providing a cushion during market downturns. What’s new? UBS has launched a range of four ETFs that offer a choice of two underlying exposures (S&P 500 or Euro Stoxx 50) combined with these two types of options overlay strategies to give investors access to these defensive strategies that perform better in sideways or downward markets. The ETFs available are: Fig.1. UBS UCITS ETFs incorporating options strategies 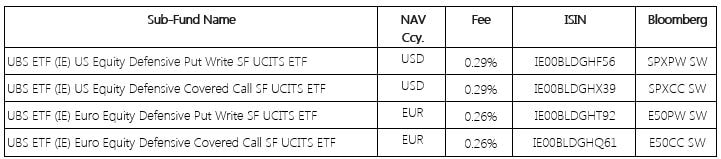 Source: Elston Research, Bloomberg data What does this launch mean for investors? The launch of these ETFs gives investors of any size the opportunity to access these options overlay strategies within a fund exposure, rather than outwith a fund exposure, meaning that they benefit from:
Not really. Covered call strategies are used to enhance the income of traditional OEICs in the “Enhanced Income” sector. Funds such as the Schroder Income Maximiser and Fidelity Enhanced Income use a covered call strategy within the fund to generate additional income at the expense for capital growth, as did Enhanced Income ETFs from BMO. But this is typically done for yield enhancement rather than as a pure defensive strategy. These UBS ETFs are not yield focus but are using that additional income to provide some cushioning. Why the ETF format? The advantage of the ETF format means that investors have the ability to allocate or deallocate to that strategy quickly and conveniently. As we saw in March, in period of heightened daily volatility, the 4-5 day dealing cycles (8-10 days for an unfunded switch) of traditional OEICs create significant and unintended market timing risk. The ETF format offers a more timely way of adding or removing a particular exposure. Who might use these? Discretionary managers and financial advisers using platforms that can access ETFs may find these strategies a useful addition to the toolkit as a Liquid Alternative strategy. Are these Liquid Alternative ETPs? Yes, we would classify them as such. But we differentiate between Liquid Alternative Asset Classes and Liquid Alternative Strategies. We would classify these ETFs as Liquid Alternative Strategies, alongside Managed Futures ETFs and Equity Market Neutral ETFs. What are the drawbacks? From a UK perspective, whilst the S&P500 product will be a useful proxy for overall market risk, it’s disappointing that there is these overlay strategies are not available for the UK’s FTSE 100 index as that would be of more appeal for UK investors, advisers and managers. Furthermore, financial advisers using traditional fund-based platforms will not be able to access these type of options overlay strategies, limiting potential usage. Performance Track record Whilst the ETFs are new, the underlying indices has been created with data back to July 2012. In the 8 years to end July 2020 in USD terms, the US Equity Defensive Covered Call Index returned +11.09%, compared to +13.71% for the S&P 500. The foregone returns being part of the cost of downside protection. By contrast, the maximum monthly drawdown (in March 2020) for the Covered Call index was -10.74%, compared to -12.51% for the S&P500, a -14% reduction in drawdown. Over the same time frame, the US Equity Defensive Put Write Index returned +3.81% compared to +2.88% for US Treasuries. By contrast, the maximum monthly drawdown (in March 2020) for the Put Write index was -8.14%. Fig.2. Performance vs selected comparators 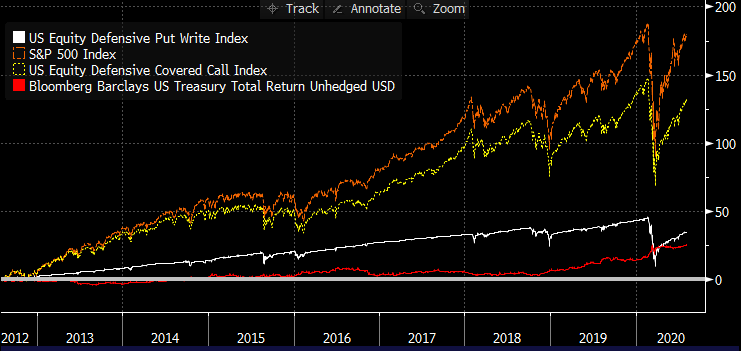 Source: Bloomberg data, 31st July 2012 to 31st July 2020, USD terms In the 1 year to July 2020, the annualised daily volatility of the Covered Call Index was 29.75% compared to 34.10% for the S&P500 (a 12.8% reduction) In more normal markets – in the 3 years to December 2019, the volatility of the Covered Call Index was 12.27% compared to 12.89% (a 4.8% reduction) Conclusion On our analysis, the Put Write index should work well in providing consistent returns in sideways markets in excess of cash/government bonds, but is not immune from severe market shocks. The Covered Call Index provides a defensive bias whilst maintaining the potential for returns from the underlying exposure. At a TER of 0.26%-0.29% the strategies are reasonably priced relative to either creating a bespoke options strategy or compared to the OCF of traditional OEICs with embedded options overlays. Nonetheless, a FTSE 100 exposure would be additionally welcome. NOTICES
Commercial Interest: Elston Consulting Limited creates research portfolios and administers indices that may or may not be referenced in this article. If referenced, this is clearly designated as such and is to raise awareness and provide purely factual information as regards these portfolios and/or indices. Image Credit: Shutterstock
The second quarter of 2020 saw a rebound in Global Equity markets with a total return of +17.6% in GBP terms. Unsurprisingly a 60/40 equity/bond portfolio captured approximately 60% of this upside with a total return of +11.2%. Of the multi-asset risk-based strategies we track, a Maximum Deconcentration approach (also known as an equal weight approach, because each asset class is equally weight), fared best with a return of +10.3%. By contrast a Min Variance approach and Risk Parity approach returned +9.0% and +5.7% respectively. Given their relative betas to Global Equity, the results are not surprising. Fig.1. Total Return (discrete quarter, GBP terms)  Risk-adjusted basis On a risk-adjusted 1 year basis, Risk Parity outperformed Global Equities, UK Bonds, a 60/40 portfolio and other multi-asset strategies. Fig.2. Risk-Return to 30-Jun-20 (1 year, GBP terms)  On a 5 year basis, Risk Parity also has the best risk-adjusted returns, with the highest Sharpe ratio at 0.94. Fig.3. Sharpe Ratio to 30-Jun-20 (5 year, GBP terms) 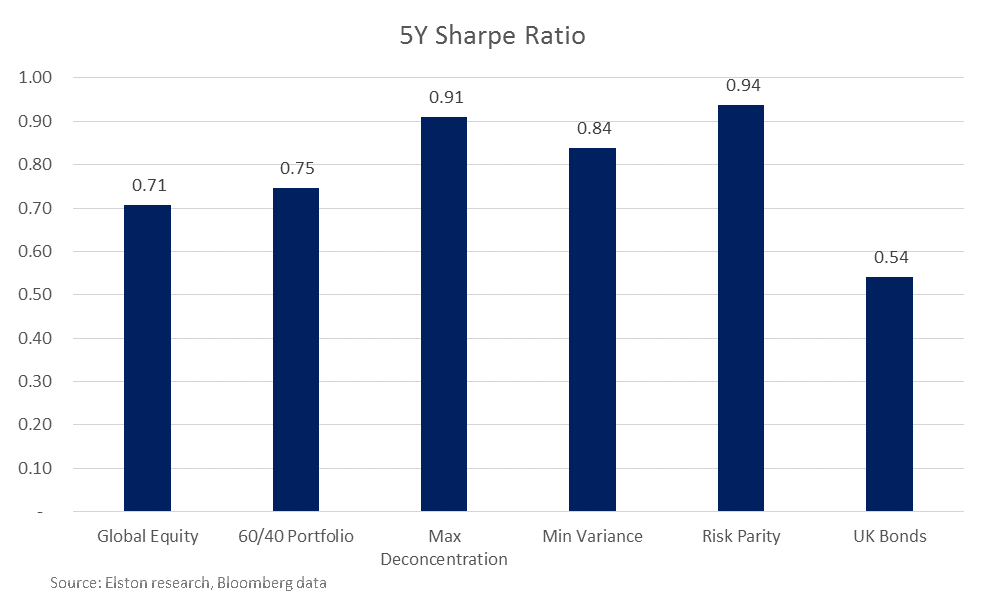 Risk-based strategies for “true diversification” If we define “true diversification” as combining two or more uncorrelated asset classes such that the combined volatility is less than its constituent parts, then a traditional 60/40 portfolio fails to deliver. We look at correlation reduction and beta reduction to articulate “differentiation impact”. The greater the reduction of both, the greater the differentiation. Over the 5 years to 30th June, a 60/40 portfolio (as represented by the Elston 60/40 GBP Index [ticker 6040GBP Index] delivers a reduction in Beta of -41.1% (broadly commensurate with its equity allocation), it only reduces correlation to Global Equities by -2.8%. Put differently a 60/40 portfolio is almost 100% correlated with Global Equities, and does not therefore provide “true” diversification. By contrast, a Risk Parity approach not only delivered better risk-adjusted returns, it also delivered “true diversification”. With a beta reduction of -78.3% and a correlation reduction of -46.6%. The Differentiation impact of the various multi-asset strategies is summarised below. Fig.4. Differentiation impact to 30-Jun-20 (5 year, GBP terms) 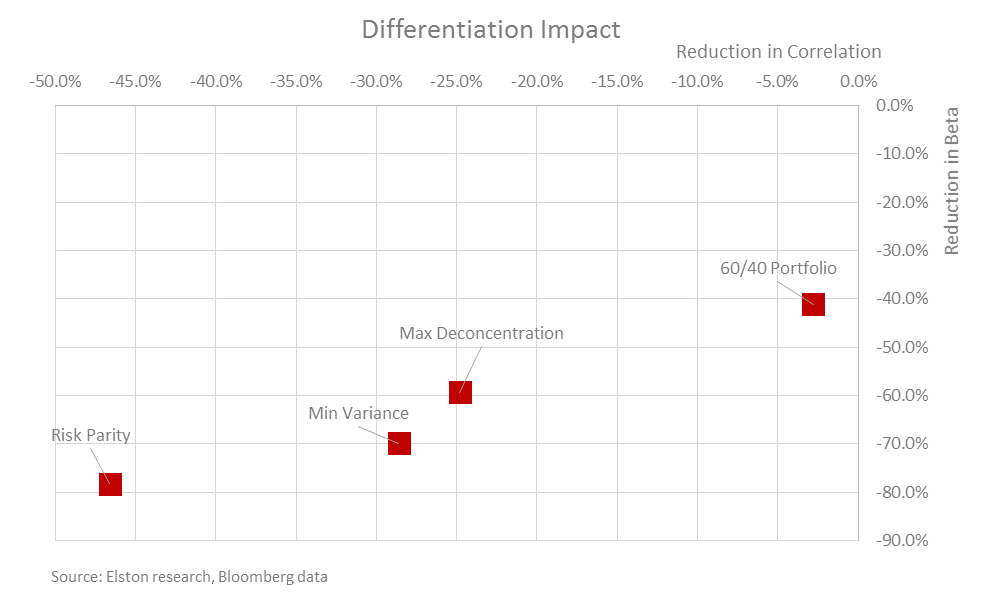 Summary
Max Deconcentration provided the highest level of returns in 2q20. On a 1, 3 and 5 year basis, Risk Parity offers better risk-adjusted returns. The differentiation impact is greatest for Risk Parity, relative to other multi-asset strategies for "true diversification". NOTICES Commercial Interest: Elston Consulting Limited creates research portfolios and administers indices that may or may not be referenced in this article. If referenced, this is clearly designated and is to raise awareness and provide purely factual information as regards these portfolios and/or indices. 
Targeted Absolute Return (TAR) funds were meant to be “all-weather” funds that could deliver returns in up markets, whilst protecting capital in down markets. If that sounds like a “goldilocks” strategy, it’s because it is. However, the way these funds-of-strategies are managed can be complex and/or opaque, and the performance has been inefficient. They are not delivering. Given there’s been a lot of bad weather globally in the first half of this year, we look at how four leading (by AUM) TAR funds have fared against our Elston Dynamic Risk Parity Index. Absolute Return funds Targeted Absolute Return funds are designed to fulfil a diversification function within a portfolio. This means performing in a way that is less or not correlated with equity markets, whilst offering greater return than cash or bonds. The portfolio construction approach to TAR funds differs from manager to manager. But the guiding principle is to achieve diversification by “spreading risk” across multiple, uncorrelated strategies, and “having the potential to make money in falling markets”. Risk-based strategies as an alternative Our view is that if the objective is diversification, a risk-based approach to portfolio construction makes sense, using strategies such as Risk Parity for diversification purposes. Risk Parity ensures “true diversification” by allowing the ever-changing risk characteristics of each asset class to determine portfolio weights, such that each asset class contributes equally to overall portfolio risk. Furthermore, by constructing the strategy as a straightforward “long-only” approach that does not use leverage, the holdings within the strategy are liquid, transparent and low-cost ETFs, whilst the dynamic weighting scheme is the tool for ensuring equal risk contribution and volatility constraint.
So how have the strategies fared? Relative Performance Year to date, through an extreme stress-test, absolute return strategies have underperformed a Risk Parity approach by 2-4.5%. Fig.1. YTD performance 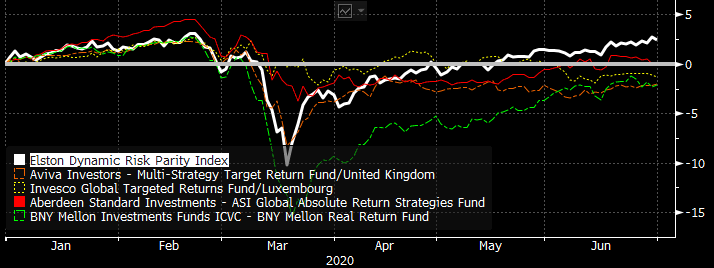 Source: Elston research, Bloomberg data. Total returns, GBP terms, as at end June 2020 On a 1 year view, these absolute return strategies have underperformed a Risk Parity approach by 6-8%. Fig.2. 1 year cumulative performance 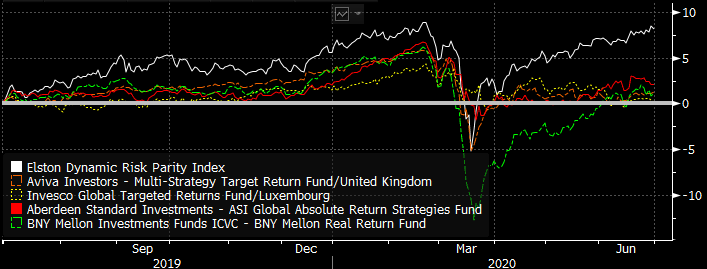 Source: Elston research, Bloomberg data. Total returns, GBP terms, as at end June 2020 On a 3 year view, these absolute return strategies have underperformed a Risk Parity approach by 7-20%. Fig.3. 3 year cumulative performance 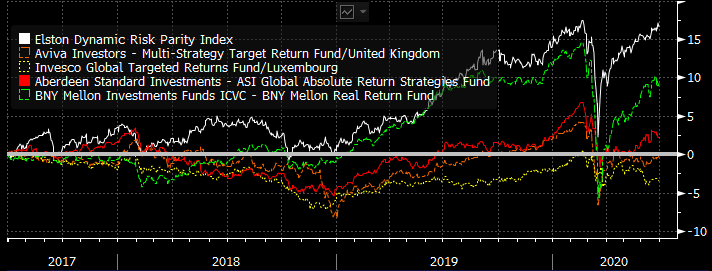 Source: Elston research, Bloomberg data. Total returns, GBP terms, as at end June 2020 Mixing metaphors: a goldilocks approach to an all-weather portfolio To achieve all-weather diversifier status is a tall order for any investment strategy. It requires a “goldilocks” portfolio that:
On this basis, our Risk Parity strategy fares well as a decorrelated “diversifier”, without foregoing returns, for a similar level of risk to TAR funds. What’s wrong with TAR funds? We can’t analyse the individual strategies within the funds, but in aggregate, the statistics below suggest that as a result of their complexity, TAR funds have potentially “over de-correlated”, with insufficient beta to capture the returns available for the risk (volatility) being taken. Findings are summarised in the table below. Fig.4. 3Y Performance Statistics 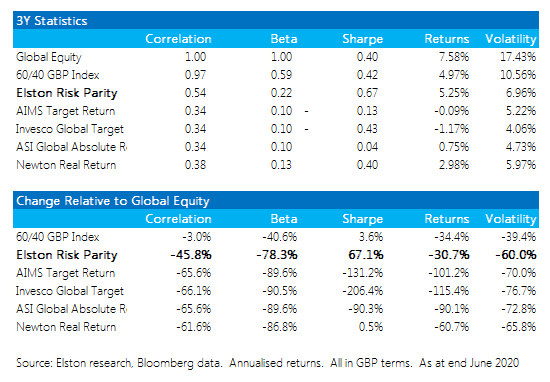 Risk-based strategies: an alternative to absolute return funds?
Targeted Absolute Return funds are opaque, complex and inefficient. Creating a true diversification strategy is challenging but achievable. A systematic risk-based approach that adapts to changing relationships between each asset classes is an alternative. By ensuring that each asset class contributes equally to the risk of the overall portfolio, without resorting to leverage, could provide a more dependable approach to incorporating a “true diversifier” into a portfolio, without necessarily compromising returns. NOTICES Commercial Interest: Elston Consulting Limited creates research portfolios and administers indices that may or may not be referenced in this article. If referenced, this is clearly designated and is to raise awareness and provide purely factual information as regards these portfolios and/or indices. Liquid Alt ETPs: success for alternative asset class exposure, less so for alternative strategies9/7/2020

Following the severe market turbulence of 2020, it’s worth taking a fresh look at “Liquid Alts” within the ETF space. What are Liquid Alternative ETFs? We define Liquid Alternative ETFs as any ETF that is:
Rise in popularity post GFC The increased popularity in the US of “Liquid Alts” came after the Global Financial Crisis and related liquidity crunch. Following the crisis, there was a demand for portfolio diversifiers that were an alternative to bonds, but with a keen focus on liquidity profile of the underlying holdings. In the US, the tradability of the ETF format meant that a broad range of “Liquid Alt” ETFs were launched, providing access to asset classes such as gold, commodities, and property securities, as well as long/short and more sophisticated “active” or systematic investment strategies packaged up within an ETF. Liquid Alts became in vogue. What about Liquid Alts in the UK? First we need to distinguish between the “type” of Liquid Alts available. We distinguish between those Liquid Alts that give exposure to an alternative asset class; and those that give exposure to an alternative asset allocation strategy. In the UK, following the financial crisis, we saw the launch of ETFs that gave exposure to alternative asset classes – gold, commodities, property, listed private equity, and infrastructure, for example. In this respect, the growth – in depth and breadth – of Liquid Alts has been impressive, particularly in the commodities and property sectors. But when it comes to Liquid Alts to deliver an alternative strategy, the ETP format has not been popular: the preferred format remains daily-dealing funds. Diversifier strategies, for example absolute return funds such as GARS, systematic trading strategies, long/short funds and funds-of-structured-products, have all been typically manufactured as funds in the UK rather than exchange traded products. Reviewing the marketing in 2016, we were expecting the range of Liquid Alt strategies available to UK investors to broaden both in the mutual fund format and the ETP format. As regards mutual funds, that has proven to be the case. As regards ETPs, Liquid Alt strategies have failed to catch on. Only a handful of liquid alternative strategy ETPs were launched, and they have largely failed to gain any traction. Why is this? Whilst straightforward Liquid Alt asset class ETPs have been successful in the UK, Liquid Alt strategy ETPs have failed to gain traction in the UK for 4 reasons, in our view:
Evaluating success: complexity fails To summarise, in the UK, within the Liquid Alt ETF space, the more straightforward a product, the more traction it’s got. Importantly, the reverse applies. “Straightforward” liquid alt ETFs Straightforward liquid alt ETFs provide liquid exposure to a specific asset class, or proxy for an asset class. Fig.1. Liquid Alternative Asset Classes 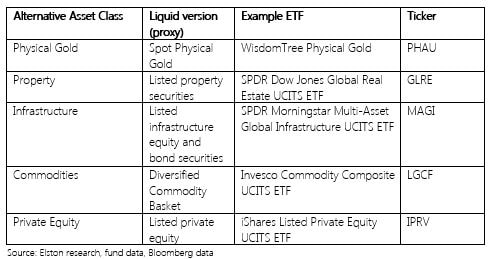 We find these “Liquid Alt” ETFs very useful building blocks to build in some diversifiers in a targeted and transparent way. “Complex” liquid alt ETFs The more complex liquid alt ETFs launched into the European market, have had far less success, and have ended up in the ETF graveyard.. Examples of complex strategies include: ETFs tracking a proxy of the HFRX Hedge Fund Index, an equity long/short ETF, and a market neutral ETF. Fig. 2. Liquid Alternative Strategies 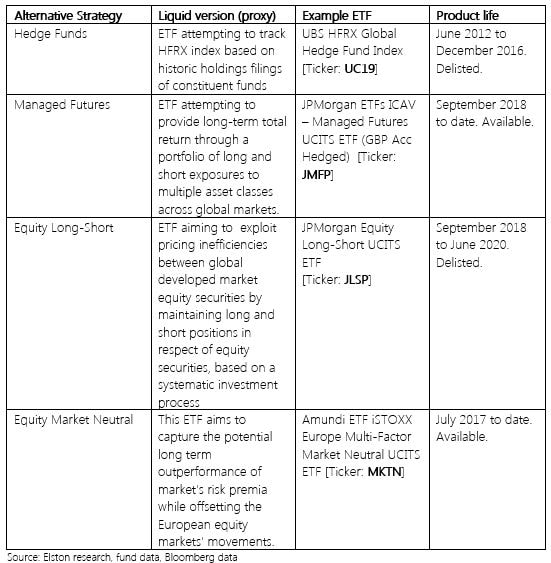 Liquidity lessons learned and relearned There were painful liquidity lessons learned in the 2008 GFC. Those liquidity lessons have been relearned for “less liquid alts” delivered by traditional fund formats, where investors were gated in direct property funds during Brexit in 2016 and Coronavirus this year. By comparison, investors who chose property securities ETFs as their “liquid” way of accessing that exposure experienced no such gating. Furthermore, the high profile gating of Woodford’s Equity Income fund and GAM absolute return bonds fund are further reminders as to why liquidity of the underlying asset, whether, within a fund or ETF, is so important. Where next? We see potential for increased competition in the single-asset class liquid alts, particularly infrastructure and listed private equity where there is little choice. Whilst we expect some ETF providers to continue to create liquid alt trading strategies, we are not convinced that ETPs are the best format for these diversifiers. Where we do expect innovation is in index-tracking funds that can be held on platform and provide a transparent, liquid and systematic approach to delivering true diversification strategies, as an alternative to opaque, higher cost absolute return funds. NOTICES Commercial Interest: Elston Consulting Limited creates research portfolios and administers indices that may or may not be referenced in this article. If referenced, this is clearly designated and is to raise awareness and provide purely factual information as regards these portfolios and/or indices.
The standard rationale for multi-asset investing is to ensure diversification between equities and bonds. But how to construct that multi-asset portfolio. We summarise 4 approaches and look at performance through the “live ammo stress test” of 2020. The classic 60/40 portfolio: This represents a traditional asset-weighted portfolio for UK investors with predominantly global equities and predominantly GBP bonds. This strategy is represented by the 60/40 GBP Index [6040GBP]. The equal weight or "1/N" portfolio: This represents an equal-asset-weighted portfolio to remove overallocations to size and/or domestic biases within equity and bond exposures. This strategy is represented by the Elston Max Deconcentration portfolio [ESBGMD]. However, the problem with any asset-weighted investing is that in extreme stress periods, correlations between asset classes increase meaning that any asset-weighted diversification effect is reduced just when you need it most. Enter risk-weighted multi-asset strategies. Rather than allowing asset weights to drive portfolio risk & correlation, risk-weighted multi-asset means allowing the portfolio risk (volatility, correlation) to drive asset weights. The Min Variance portfolio: This looks at the volatility and correlation between asset classes and aims to deliver the combination of equities and bonds required to achieve the minimum variance (lowest risk) portfolio whilst remaining exposed to risk assets. This strategy is represented by the Elston Min Variance Index [ESBGMV]. The Risk Parity portfolio: This looks at the risk contribution of each asset class and aims to deliver a portfolio where each asset class contributes equal risk contribution to the overall portfolio. This strategy is represented by the Elston Risk Parity Index [ESBDRP]. Year to date performance Of these risk-based multi-asset strategies for GBP investors, the best performing YTD (to end May) has been Risk Parity +1.50%, followed by Max Deconcentration +0.76%, followed by Min Variance -1.78%, compared to -2.03% for the 60/40 GBP Index, and -3.77% for Global Equities. 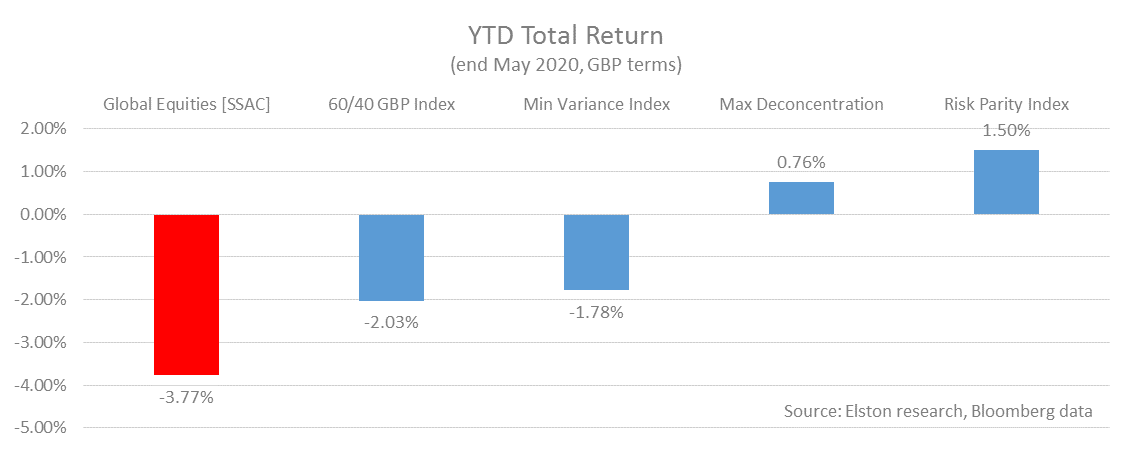 Drawdowns From the start of the market turmoil to the trough of the 60/40 index on 18th March, Risk Parity provided most downside protection, closely followed by Max Deconcentration. Unsurprisingly, the 60/40 index took approximately 60% of global equity downside. 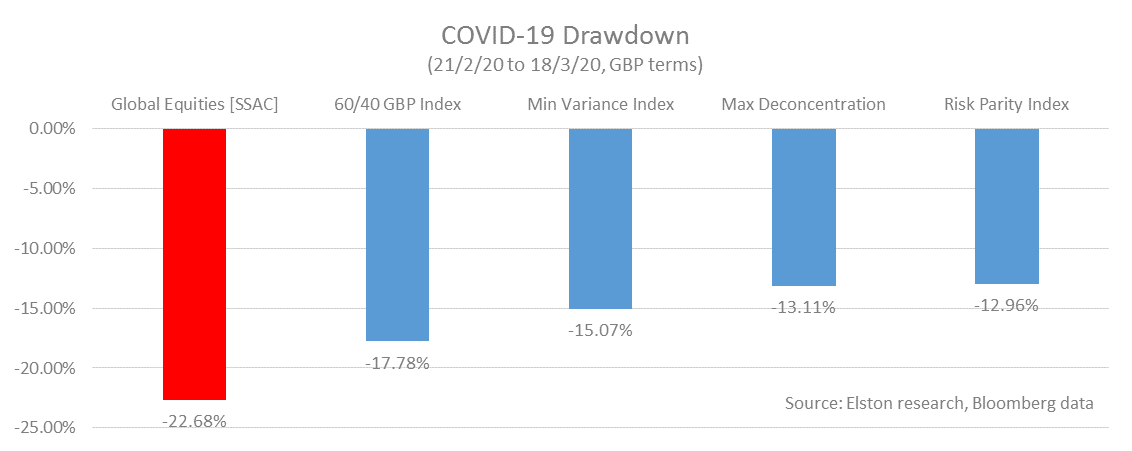 How to get “true diversification”
To achieve true diversification, you need to combine uncorrelated/differentiated holdings alongside your core strategy. An asset-weighted approach, such as 60/40 portfolio, does reduce beta (by definition you are taking 0.6x of market risk), but does not reduce correlation. A 60/40 portfolio is almost 100% correlated to global equities. By contrast, a risk-weighted approach creates the potential for decorrelation, thereby creating the potential for “true diversification” relative to a core portfolio. The recent market turmoil has shown that when true diversification is needed most, a risk-weighted approach has a useful role to play. For more on our risk-weighted portfolios and indices, see www.ElstonETF.com/etf-portfolios.html 
We are adding the Elston Maximum Deconcentration Portfolio to our suite of multi-asset risk-based strategies. The portfolio is now "live" with factsheets updated daily (portfolio ticker ESBMDC). What is "Deconcentration"? Put simply, in the context of multi-asset investing, if single asset investing is having all eggs in one basket; 60/40 investing is having all eggs in two baskets; then deconcentration is having one egg per basket. It is diversification at its simplest: giving an equal weight to each asset class within the portfolio. This portfolio construction approach is known as a "Deconcentration strategy" as it deconcentrates the portfolio from any single asset class. It is also known as a (1 over N) approach, where N is the number of holdings within the portfolio. What problem are we trying to solve? Most traditional multi-asset strategies, such as a 60/40 portfolio, have a capitalisation-weighted approach to asset allocation. Within a classic global equity benchmark, for example, the US dominates with a ~60% allocation. So within a vanilla 60/40 portfolio, US equities may have a 36% allocation (60% US exposure within 60% Global Equity allocation). Nothing wrong with that, but it's an overweight based on capitalisation. Likewise within the bond allocation rather than having a bias towards GBP issued bonds under a classic 60/40 approach. Again, nothing wrong with that, but it limits the diversification impact of international bonds. How does a max deconcentration portfolio work? One way of creating differentiated risk-returns is to ignore these size-and-domestic biases is to create a "naive" or simple diversification strategy, such as an equally-weighted multi-asset approach. We look at an opportunity set of 20 asset class exposures: regional equity markets, bonds by issuer type, maturity and currency, as well as alternatives such as gold, listed infrastructure, property securities. We then create an equal-weight allocation (1/20 = 5%) to each asset class. This portfolio thereby provides an alternative approach to multi-asset diversification with differentiated risk-return characteristics. Does it work? By default, the risk-return characteristics of a 1/N portfolio will be different to that of a traditional multi-asset portfolio, so a Max Deconcentration strategy will provide a differentiated risk-return characteristic for diversification purposes. However, there is also research to suggest that a "simple" 1/N portfolio can outperform more "sophisticated" mean-variance optimised portfolios. For more on this, see De Miguel, Garlappi and Uppal (2009) and related readings. Obviously the nuance of any 1/N portfolio will depend on its design parameters: the performance of our Max Deconcentration strategy will be included in future multi-asset strategy reviews relative to a 60/40 benchmark as well as other risk-based strategies such as Min Variance and Risk Parity. Keep updated To view peformance of this strategy, please refer to our strategy factsheets, published daily, or request portfolio access via Bloomberg. To replicate this strategy, subscribe to our Advanced Portfolios for weightings files and detialed performance analysis.
Whilst sound in theory, do risk-based strategies work in practice? To find out, we took at the performance of a multi-asset Risk Parity Index and a multi-asset Minimum Variance index. Risk Parity aims to achieve equal risk contribution from each asset class Min Variance aims to combine each asset class to achieve a minimum variance portfolio On a rolling five year basis, both multi-asset Min Volatility and Risk Parity offered superior risk-adjusted returns relative to a 60/40 Portfolio for GBP investors. Both Min Volatility and Risk Parity offered a lower level of overall risk relative to a 60/40 portfolio. Get the full report here http://www.elstonetf.com/store/p3/Multi-Asset_Indices%3A_risk-based_strategies.html 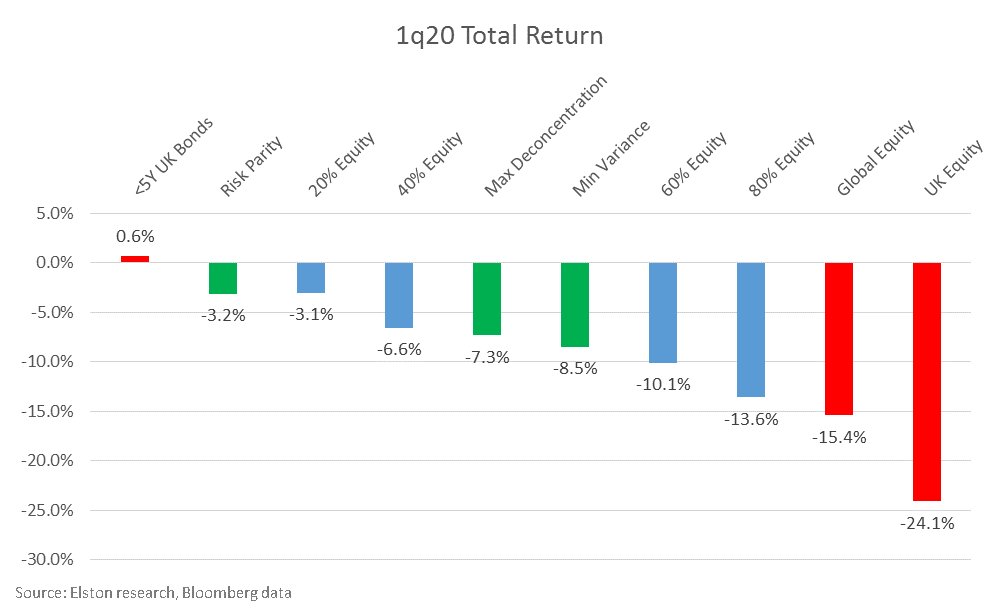 In 1q20 Risk Parity and Min Variance multi-asset strategies offered best downside cushioning relative to a 60/40 Equity/Bond portfolio for GBP investors.
Risk-based strategies: 1. Offer a systematic approach 2. Are designed to be differentiated 3. Have potential to enhance returns, mitigate risk or improve diversification Get the full report here http://www.elstonetf.com/store/p12/Multi-asset_strategies%3A_1q20_update.html
Diversification: the only free lunch for investors Portfolio theory holds, and experience affirms, that true diversification means that the overall risk of a portfolio can be less than the risk of its constituent parts. The diversification effect is determined by correlation. Broadly speaking, the lower the correlation between asset classes, the greater the diversification effect when combined in a portfolio. This in the underlying principle behind combining equities and bonds to create a multi-asset approach. Whilst this traditional “asset-based” approach holds for the long-term. It fails to consider that correlations are not static but are dynamic. This means that diversification effect is also dynamic and changes with market conditions. The limits of asset-based diversification In stressed market conditions, the relationship (correlation) between asset classes tends to increase. This means that the diversification effect created by mixing asset classes is reduced. In order to introduce true diversification effect into a portfolio investors can use a risk-based approach to constructing portfolios. Asset-based or risk-based approach? The bulk of multi-asset portfolios in the UK market use what’s called a traditional “asset based” approach. This means that the target asset allocation drives the level of portfolio risk. The asset allocation for each portfolio is broadly fixed, and volatility therefore fluctuates. An alternative approach is called a “risk-based” approach. This means that a target risk characteristic for a portfolio – for example a minimum variance portfolio, or a risk parity approach – drives the asset allocation. Risk-based approaches explained We analyse three risk-based multi-asset strategies for GBP investors:
Differentiation impact Relative to global equities, whilst a 60/40 approach, represented by the Elston 60/40 GBP Index [6040GBP Index], reduces beta by 40.6%, it only reduces correlation by 3.0%. Put differently, there is very low diversification effect. By contrast, a risk parity approach, represented by the Elston Dynamic Risk Parity Index [ESBDRP Index], offer the greatest diversification effect as it reduces beta by 78.0% and correlation by 48.1%. 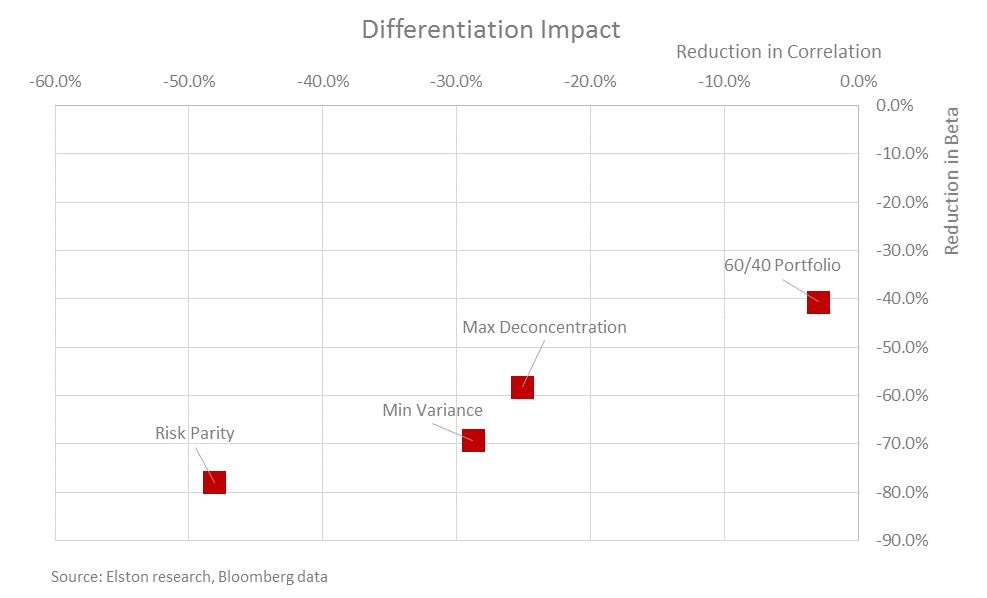 5 year data to 31st March 2020, GBP terms YTD performance Year to date, risk parity has provided greatest capital preservation relative to asset-based and other risk-based strategies. What next?
For investors looking at introduce true diversification into a multi-asset portfolio, incorporating an allocation to a dynamic multi-asset risk-based strategy, such as Max Deconcentration, Min Variance or Risk Parity makes sense. These systematic strategies can be delivered using portfolios of ETFs for liquidity, transparency and efficiency. For full report, see http://www.elstonetf.com/store/p12/Multi-asset_strategies%3A_1q20_update.htm The impact of Coronavirus on multi-asset strategies is summarised below. This chart shows the peak-to-trough and YTD performance of Global Equities and Elston's multi-asset indices for GBP investors. 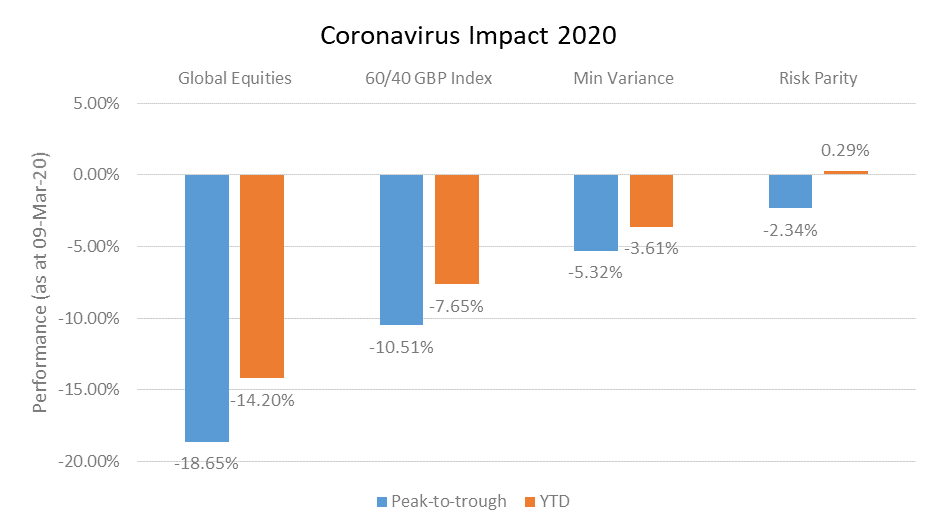 Asset-based diversification has its limits Whilst a traditional asset-based approach to diversification can help reduce equity market beta, but it doesn't necessarily help reduce correlation. Why does (de)correlation matter The maths of diversification means that the less correlated an asset within a portoflio, the greater the diversification effect. Comparing multi-asset approach A 60/40 equity/bond portfolio (represented by 6040GBP Index), reflects a traditional multi-asset approach. Year-to-date this strategy has a beta of 0.60x but a correlation of 98.9%. By contrast, a risk-based approach to diversification not only reduces beta, but also reduces correlation. A Minimum Variance multi-asset strategy (represented by ESBGMV Index) has a beta of 0.35x and a correlation of 88.0%. A Risk Parity multi-asset strategy (represented by ESBDRP Index) has a beta of 0.18x and a correlation of 58.7%. 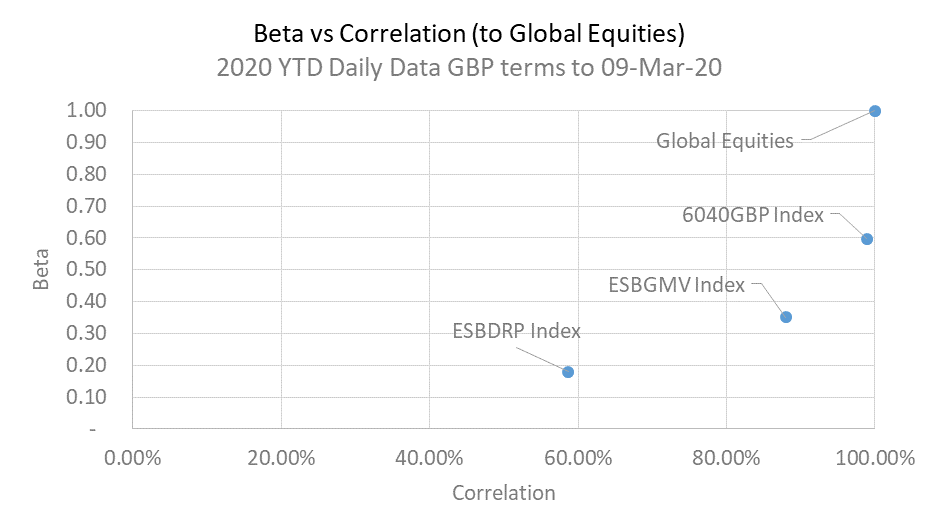 Summary
For effective risk-based diversification, whilst maintaining exposure to risk assets with returns potential, a risk-based approach to portfolio construction makes sense. 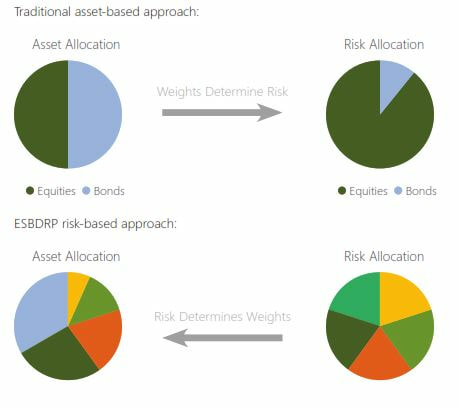 Investors often seek out differentiated risk-return assets for inclusion within a portfolio for diversification purposes.
This is often the rationale used for inclusion of hedge funds, absolute return funds, diversified growth funds, and real assets in a portfolio. An alternative approach But is there an alternative way of achieving differentiation? We believe so. Risk-based strategies are multi-asset strategies that are designed to be differentiated. Examples of multi-asset risk-based strategies include: Minimum Variance, Risk Parity, Maximum Deconcentration, Maximum Sharpe and Maximum Decorrelation. These strategies target a particular risk objective and that risk objective drives the underlying asset weightings. Has it worked? On a rolling 5 year basis to end 2019, both multi-asset Min Volatility and Risk Parity delivered in providing both lower beta to, and reduced correlation with Global Equities, relative to a 60/40 portfolio, as well as delivering on their stated objectives. Relative to global equities with a Beta of 1, a 60/40 strategy, a multi-asset Min Variance strategy and Risk Parity provide a -40.4%, -68.8% and -75.3% reduction in beta respectively. Relative to global equities (correlation = 100%), a 60/40 strategy, a multi-asset Min Variance and Risk Parity provide -5.7%, -32.2% and -45.3% reduction in correlation respectively. This highlights that although a 60/40 approach reduces beta, it doesn't much reduce correlation. For an effective decorrelation approach to achieve true diversification, a risk-based approach to multi-asset investing provides a helpful diversifier. Risk-based strategies are a portfolio construction approach and can be delivered using liquid ETFs with no leverage and no shorting. We expect to see a growing role for multi-asset risk-based strategies within portfolios given their transparency, liquidty, and cost advantage relative to hedge funds and absolute return funds. We believe that systematic strategies that are designed to be different are more likely to be different than strategies that are hoped to be different. After all, portfolio construction is just maths. Get the full report For the analysis: Global Equities proxy: iShares MSCI ACWI UCITS ETF [Ticker: SSAC LN Equity] 60/40 strategy: Elston 60/40 Index (GBP) [Ticker GBP6040 Index] Multi-asset Min Variance strategy: Elston Min Variance Index (GBP) [Ticker ESBGMV Index] Multi-asset Risk Parity strategy: Elston Risk Parity Index (GBP) [Ticker ESBDRP Index] 
Multi-asset risk-based strategies offer an alternative approach to portfolios construction.
Examples of multi-asset risk-based strategies include: Minimum Variance, Risk Parity, Maximum Deconcentration, Maximum Sharpe and Maximum Decorrelation. These strategies target a particular risk objective and that risk objective drives the underlying asset weightings. We see a growing role for multi-asset risk-based strategies as more informed comparator to traditional asset-based multi-asset comparators such as a 60/40 equity/bond portfolio. Potential application for risk-based strategies Potential applications include: Portfolio diversifier: Investors traditionally use hedge funds and/or absolute return strategies as diversifiers within a portfolio context owing to their differentiated risk-return characteristics. Similarly, risk-based strategies offer a systematic approach to delivering differentiated strategies for diversification purposes. More specifically, the objectives of a Max Deconcentration and Max Decorrelation are to deliver a differentiated approach (for a given opportunity set subject to parameter constraints). Return enhancement: Risk-based strategies have the potential to enhance portfolio returns. More specifically, the objective of a Max Sharpe strategy is to deliver maximum risk-adjusted returns (for a given opportunity set subject to parameter constraints). Risk mitigation: Risk-based strategies have the potential to mitigate portfolio risk. More specifically, a Min Variance strategy is optimised to deliver a risk-return characteristic close to the theoretical Minimum Variance Portfolio (for a given opportunity set subject to parameter constraints). Benchmarking purposes: Using risk-based strategies as comparators to Hedge Funds, Diversified Growth Funds and Target Absolute Return Funds provides additional performance insight without the problems that are inherent in peer group type measures. Get the full report  Factor-based investing – an alternative approach to cap-weighted indices
Factor-based investing focuses on identifying broad persistent characteristics for securities within a single asset class. Factor-based indices ascribe weights to securities within an index based on those factor characteristics. Factor-based indices are therefore typically single asset in nature, and represent an alternative approach to capitalisation weighted indices. For example, Minimum Volatility equity index is typically constructed with a single asset class, e.g. equities whose constituents exhibit the lowest volatility characteristics. Risk-based strategies – an alternative approach to multi-asset When looking at multi-asset strategies, there are two approaches. For asset-based investing, asset weights determine portfolio risk characteristics. For risk-based investing, portfolio risk characteristics determine asset weights. Risk-based indices are therefore typically multi-asset in nature, and represent an alternative approach to asset-based (e.g. 60/40) multi-asset indices. For exanoke, a Minimum Variance index strategy targets the minimum variance multi-asset portfolio. Risk-based multi-asset strategies therefore reflect a portfolio construction approach, rather than a factor screen. It is the set of rules by which a multi-asset portfolio is optimised. What are the advantages of a risk-based strategy? The advantages of long-only risk-based index strategies are that they: 1. Provide a systematic approach to risk management 2. Can be constructed with liquid underlying ETFs 3. Do not use leverage or shorting Get the full report here http://www.elstonetf.com/store/p3/Multi-Asset_Indices%3A_risk-based_strategies.html 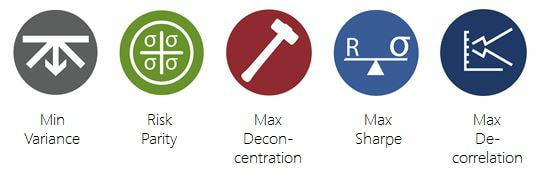 Risk-based strategies are an alternative approach to multi-asset investing.
For traditional asset-based strategies, such as a 60/40 equity/bond portfolio, asset weights drive risk characteristics. For risk-based multi-asset strategies, risk characteristics drive asset weights. The objectives of multi-asset risk-based strategies are derived from different branches of portfolio theory can be defined as follows Minimum Variance: Aims to minimise the overall strategy volatility by using pairwise correlations and volatilities of stocks to provide a good proxy for the least risky portfolio in the Modern Portfolio Theory framework. Risk Parity: Aims to achieve equal risk contribution from asset classes under the assumption of identical pair-wise correlations structures. The same as inverse volatility weighting. Maximum Deconcentration: A naïve diversification strategy that aims at maximising the effective number of holdings, equivalent to minimising concentration. Maximum Sharpe: Aims to combine assets to achieve a strategy with the highest risk-adjusted return in excess of the risk-free rate. Maximum Decorrelation: Aims to minimise the volatility of a strategy assuming that individual volatilities are identical, thereby constructing the strategy based on correlation structure alone (solving for the least correlated strategy). Get the full report here http://www.elstonetf.com/store/p3/Multi-Asset_Indices%3A_risk-based_strategies.htm 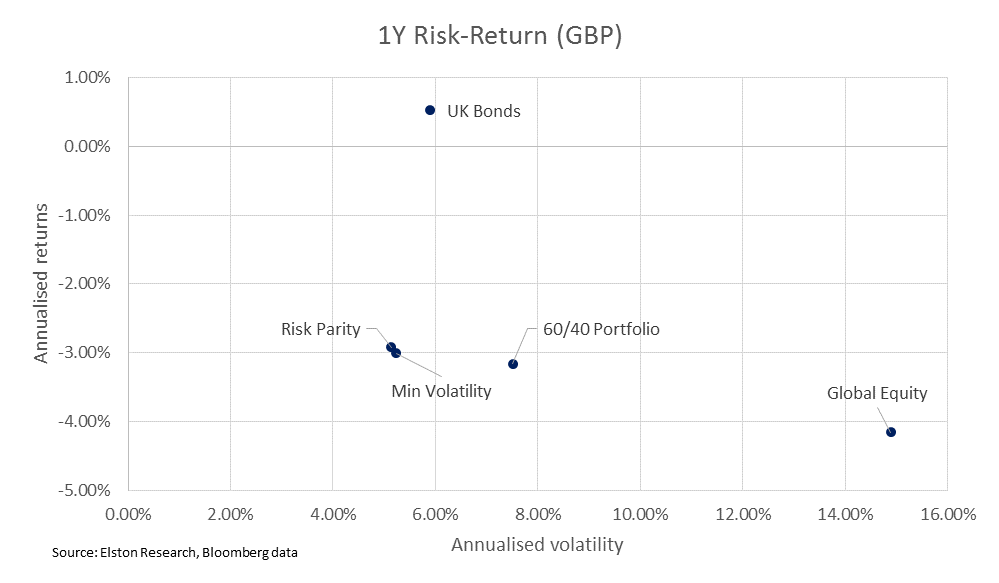 In 2018 Risk Parity and Min Volatility multi-asset strategies offered some downside cushioning and lower volatility relative to a 60/40 Equity/Bond portfolio for GBP investors.
Risk-based strategies: 1. Offer a systematic approach 2. Are designed to be differentiated 3. Have potential to enhance returns, mitigate risk or improve diversification Get the full report 
What is risk-based multi-asset? Risk-based strategies are an alternative approach to multi-asset investing. For traditional asset-based strategies, such as a 60/40 equity/bond portfolio, asset weights drive risk characteristics. For risk-based multi-asset strategies, risk characteristics drive asset weights. How does this compare to factor investing? Factor-based index strategies typically look at screening single asset class securities for a particular factor. For example, Minimum Volatility equity index is typically constructed with a single asset class, e.g. equities whose constituents exhibit the lowest volatility characteristics. By contrast, For multi-asset strategies a Minimum Variance strategy targets the minimum variance multi-asset portfolio. Risk-based multi-asset strategies reflect a portfolio construction approach, rather than a factor screen. It is the set of rules by which a multi-asset portfolio is optimised. What risk-based multi-asset strategies are available? We focus on five well researched risk-based multi-asset strategies:
Access the full report here 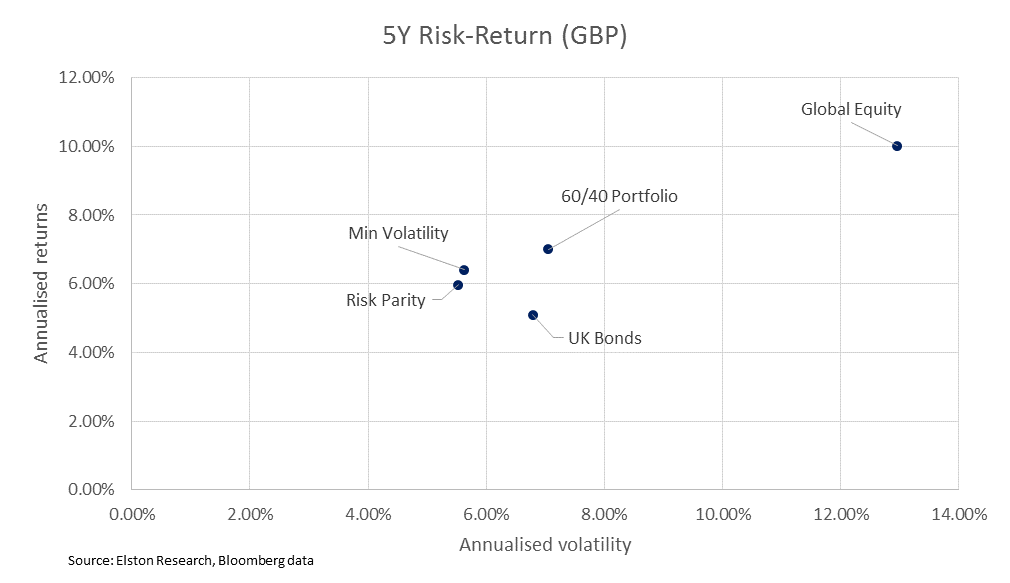 Whilst sound in theory, do risk-based strategies work in practice?
To find out, we took at the performance of a multi-asset Risk Parity Index and a multi-asset Minimum Volatility index. Risk Parity aims to achieve equal risk contribution from each asset class Min Volatility aims to combine each asset class to achieve a minimum variance portfolio On a rolling five year basis, both multi-asset Min Volatility and Risk Parity offered superior risk-adjusted returns relative to a 60/40 Portfolio for GBP investors. Both Min Volatility and Risk Parity offered a lower level of overall risk relative to a 60/40 portfolio. Get the full report here http://www.elstonetf.com/store/p3/Multi-Asset_Indices%3A_risk-based_strategies.html
 Risk-based indices are different to factor-based indices, as they focus on the interaction between securities, not the characteristics within securities. Put simply, it's an alternative, systematic approach to asset allocation and risk management.
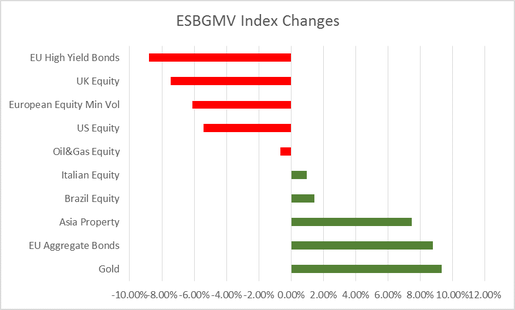
The Elston Multi-Asset Min Volatility Index (ESBGMV) launched in 2014 represents the minimum variance multi-asset portfolio for GBP investors. As it takes a systematic approach, it's always interesting to see the asset-class switches that this methodology triggers via its monthly readjustments. Comparing the index composition from 4q17 to 1q18, the biggest switches have been cutting back European High Yield Bonds and UK Equity, whilst adding to European Aggregate Bonds and Gold. View Factsheet Learn about Elston Indices Visit ESBGMV Index <Go> on the Bloomberg Terminal |
ELSTON RESEARCHinsights inform solutions Categories
All
Archives
April 2024
|
 RSS Feed
Company |
Solutions |
|