
 [3 minute read, open as pdf]
Dividend Concentration Risk Dividend Concentration Risk is the over-dependence of a portfolio on a handful of holdings to generate the overall portfolio income. Dividend Concentration Risk became even more apparent in 2020 when large cap companies suspended or cut their dividends. Too often, Dividend Concentration Risk has been looked at in hindsight rather than as part of ongoing due diligence and challenge to portfolio constructors. We look at potential evaluation metrics and conclude that a quantitative and qualitative approach makes most sense. Understanding dividend dependency We look at Contribution to Yield to understand the asset-weighted income generated by each underlying holding as a proportion of the overall yield of a portfolio. Thus a 5% weighting to a 4% yielding stock A (an asset weighted yield of 0.20%) will have a greater contribution to yield than a 3% weighting to a 6% yielding stock B (an asset weighted yield of 0.12%). For a portfolio with an overall yield of 3.0%, stock A has a 6.67% Contribution to Yield (0.20% / 3.0%) and Stock B has a 4.0% Contribution to Yield. For income investors, looking at a portfolio from the perspective of income-weighted Contribution to Yield is as important as looking at its asset-weighted allocation. Portfolios where there are a greater number of stocks with a higher Contribution to Yield are more dependent on those dividends than a portfolio where there are a greater number of stocks with a lower Contribution to Yield. Contribution to Yield is therefore a way of looking at the vulnerability of a portfolio to the idiosyncratic risks of specific stocks cutting or suspending their dividend. Fig.1. Contribution to Yield of the iShares FTSE 100 UCITS ETF 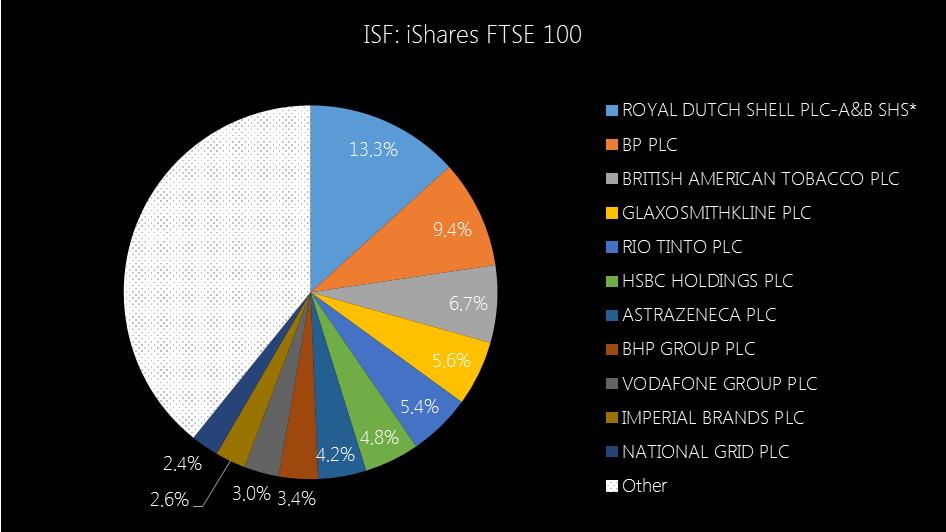 Source: Elston research, Bloomberg data. As at 30th June 2020 Screening & Weighting Screening methodologies and weighting schemes can substantially alter the components and concentrations of an income portfolio. For example, a fund using an index which ranks securities by their yield alone, such as the iShares UK Dividend UCITS ETF, will have a different composition to a fund that uses an index which ranks securities by their dividend consistency, such as the SPDR S&P UK Dividend Aristocrats UCITS ETF (UKDV). Fig.2. Contribution to Yield of the iShares UK Dividend UCITS ETF 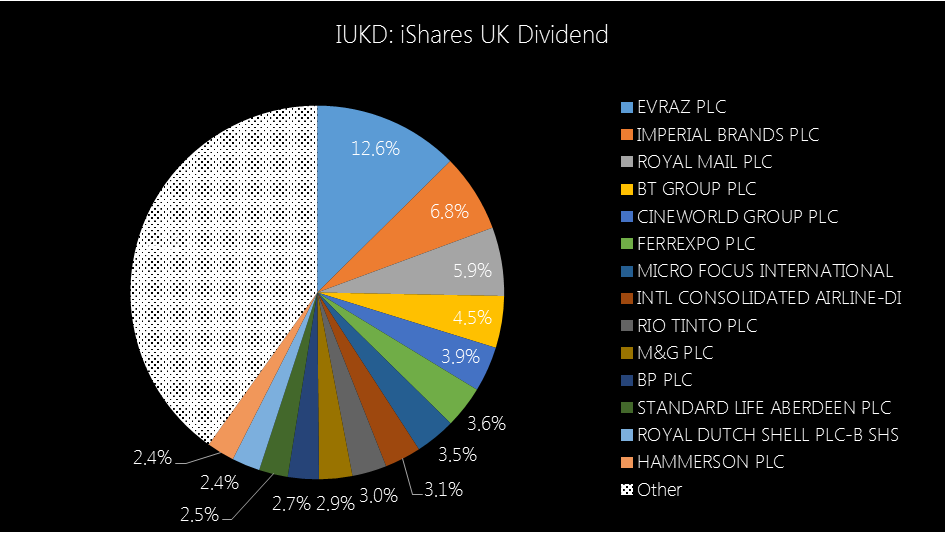 Source: Elston research, Bloomberg data. As at 30th June 2020 Fig.3. Contribution to Yield of the SPDR S&P UK Dividend Aristocrats UCITS ETF 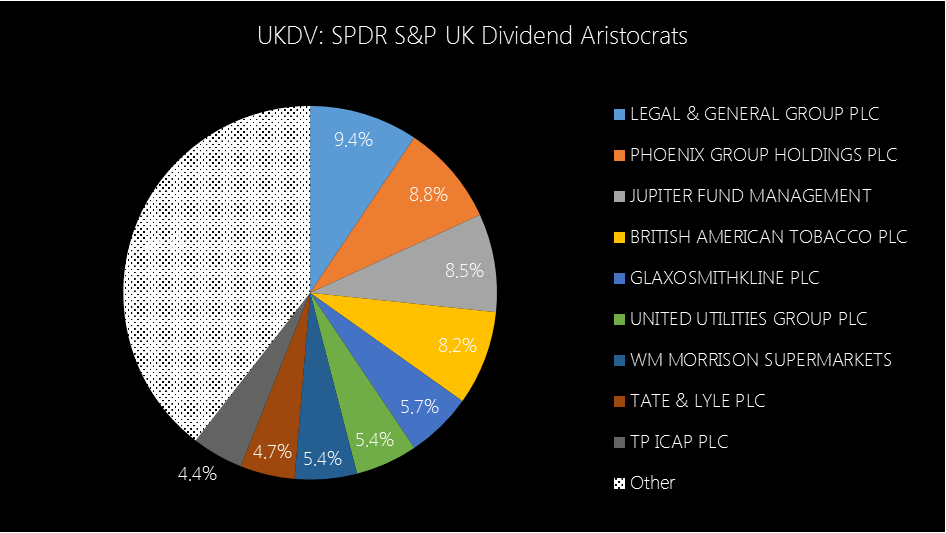 Source: Elston research, Bloomberg data. As at 30th June 2020 What about Concentration? We can look at what number of holdings contribute to a threshold level of income. For example, of the funds above it takes 11, 14 and 9 underlying holdings for ISF, IUKD and UKDV respectively to generate an ad hoc threshold, e.g. 60% of overall income. Another concentration metric would be to look at a Herfindahl-Hirschman Index (HHI) measure. This measure of concentration (the sum of the squares of each weighting) is typically used to assess market competitiveness for an industry, but could also be used as a measure of concentration of Contribution to Yield. For example, a portfolio with equally weighted Contributions to Yield of 5% would have a HHI score of 500 (less concentrated). A portfolio with equally weighted Contributions to Yield of 10% would have a HHI score of 1,000 (more concentrated). On this basis, the HHI score of Contributions to Yield for ISF, IUKD and UKDV are 484, 406 and 525 respectively, suggesting that UKDV is more concentrated, than ISF which is more concentrated than IUKD in relative terms. Nonetheless, in absolute terms, each of them are relatively unconcentrated (a score of >1,000 would imply high concentration). Fig.4. Dividend Contribution Concentrations (HHI Scores) 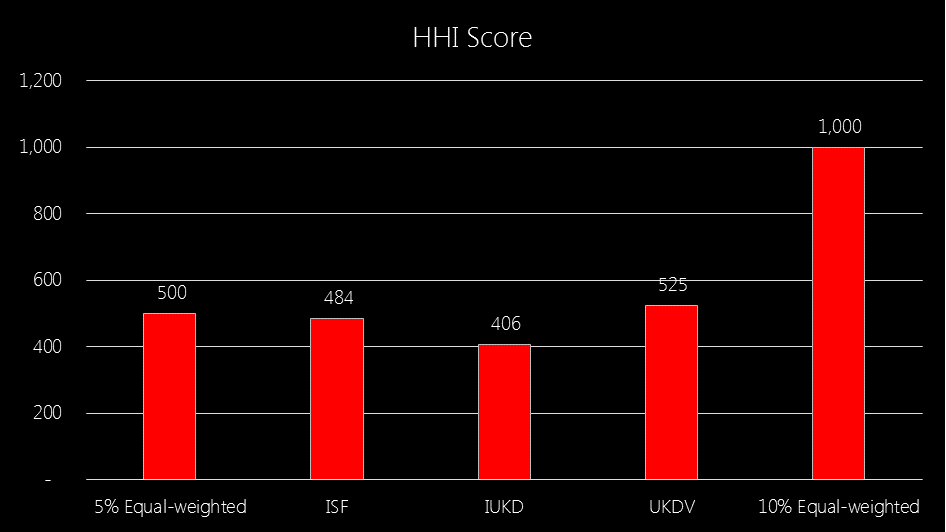 Source: Elston research, Bloomberg data. As at 30th June 2020
A quantitative and qualitative approach Whilst Contribution to Yield and concentration measures can provide a quantitative approach, it is the qualitative dimensions of dividend risk that are the key drivers to understanding and mitigating Dividend Concentration Risk. The qualitative dimensions include a company’s dividend history, its outlook based on its willingness (dividend policy) and ability (dividend cover) to pay and the underlying industry-specific exposures that are driving corporate earnings and dividend potential. It therefore makes sense to combine a quantitative and qualitative approach to portfolio constructing when considering dividend concentration risk. Mitigating dividend concentration risk Ways of mitigating Dividend Concentration Risk include:
View the structured CPD webinar on this topic Comments are closed.
|
ELSTON RESEARCHinsights inform solutions Categories
All
Archives
July 2024
|
 RSS Feed
Company |
Solutions |
|