
 [5 min read, open as pdf]
In a recent CPD webinar, Elston’s Henry Cobbe interviewed Patrick Minford, Professor of Applied Economics at Cardiff University and economic adviser to Margaret Thatcher in the late 1970s and early 1980s to ask about the fight with inflation in the 1970s and any comparisons for today. While it is tempting to look for similarities with the energy shock and period of sustained inflation that the UK suffered in the late 1970s and early 1980s, Professor Minford highlighted some significant differences. The lower risk of a wage-price spiral, central bank independence and a track record of manging inflation means lower risk of inflation getting out of control in the long-term. But the short- to medium-term remains under pressure. In Minford’s opinion, the risk to the growth is the bigger risk: and this would be the right time for HM Treasury to worry less about debt ratios, and turn on Government spending taps. Read full article, open as pdf Watch the CPD webinar (50mins) 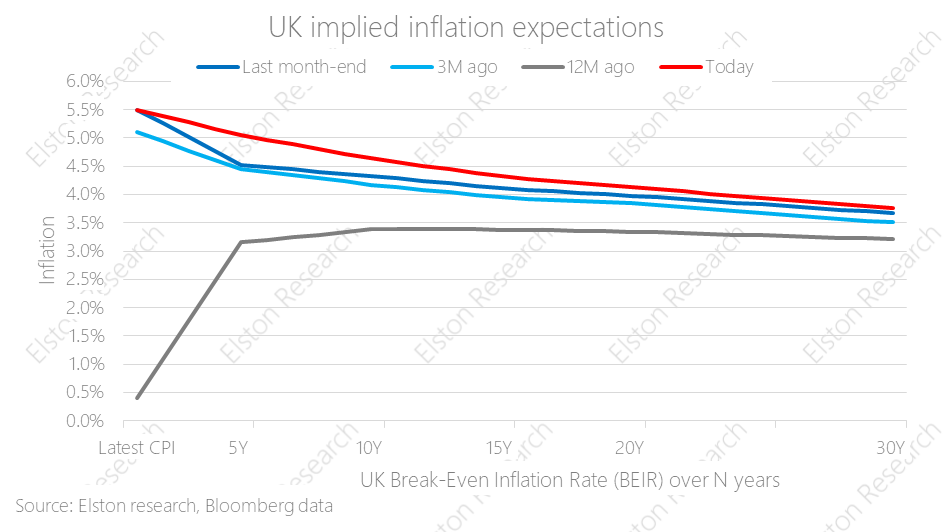 [5 min read, open as pdf]
Nominal bonds suffer in an inflationary regime. Real assets provide resilience in an inflationary regime, but have higher volatility. Our Liquid Real Assets index combines rate-sensitive assets and inflation-sensitive assets to capture real asset return patterns, with bond-like volatility. Underlying exposures to Gold, Energy, Precious Metals, Agriculture and Industrial Metals have all driven performance of the index year-to-date. The Liquid Real Assets index has outperformed gilts by 8.91ppt with similar risk characteristics. Portfolio managers and advisers who are looking to 1) reduce or remove nominal bond exposure, 2) want real asset exposure for inflation protection, and 3) want to maintain volatility budget can consider a lower-risk real assets strategy as an alternative. For full article with charts, open as pdf  [5 min read, open as pdf]
Find out more on this topic in our upcoing CPD webinar
For investors with long time horizons who want an all-equity portfolio, there is no shortage of low- cost global equity ETFs. In cricketing terms, when sunshine’s guaranteed, a grass pitch works just fine. But when time horizons are shorter and risk control matters more – as in these uncertain times - a multi-asset approach might make better sense. Put differently, when the weather is changeable or extreme, an all-weather pitch makes more sense. It’s the same for investments. In these times of market volatility, rising interest rates and inflation pressure, we explore three different types of multi-asset strategy: the 60/40 portfolio, the “Equal Risk” or all-weather portfolio, and the “Equal Weight” or Permanent Portfolio. The problem with 60/40 The traditional multi-asset portfolio is the so-called “60/40” portfolio – where 60% is invested in equities, and 40% is invested in bonds. This is the “classic” multi-asset strategy. The idea being that you can combine higher risk and return from equities with lower risk income from bonds. A 60/40 portfolio can be constructed with just two ETFs. 60% in a global equity ETF like SSAC (iShares MSCI ACWI UCITS ETF) or VWRP (Vanguard FTSE All-World UCITS ETF); and 40% in a bond ETF – for example AGBP (iShares Core Global Aggregate Bond UCITS ETF GBP hedged) for those wanting global bond (hedged to GBP) exposure, or IGLT (iShares Core UK Gilts UCITS ETF) for those wanting UK government bond exposure. Or you can make it more and more granular. But this traditional 60/40 model is under pressure, and the suggestion currently is that the 60/40 portfolio is now “dead”. Why is this? Well because for the last 30 years or so, we’ve lived in a world where inflation and interest rates have been trending down – which is doubly good for bonds. But now we are now in an economic regime where both interest rates and inflation are starting to trend up – which is doubly bad for bonds. The other problem with 60/40, is that in times of market stress, the correlation between equities and bonds increases, meaning that bonds lack the diversifying power they may have had in the historical long-run, at a time when it is needed most. In summary: the advantage of this approach a 60/40 portfolio is easy to construct, and is a classic “balanced” portfolio. The disadvantage of this approach is that bonds are facing an uphill struggle for the next few years, so may not be as “balanced” as you would want. The all-weather portfolio The all-weather portfolio concept is that of a multi-asset portfolio that is designed to deliver resilient, consistent performance in different market regimes, or “whatever the weather”. The term and idea was pioneered by Ray Dalio of Bridgewater Associates (which was established in 1974, shortly after Nixon took the US Dollar off the gold standard) and is designed to answer the question: “What kind of investment portfolio would you hold that would perform well across all environments, be it a devaluation or something completely different?”[1]. Dalio and Bridgewater’s all-weather portfolio assumes equal odds of any of four market regimes (rising/falling growth/inflation) prevailing at any time. This approach created and pioneered what is also referred to as a “Risk Parity” approach to investing. The concept of risk parity requires some additional explanation. A classic 60/40 equity/bond allocation results in a portfolio where over 95% of overall portfolio risk comes from the equity position, and the balance comes from the bond position. In short, the asset allocation drives portfolio risk, and while a portfolio may be balanced in terms of asset allocation, it is imbalanced in terms of risk allocation. Risk parity reverses the maths: it means that each asset class contributes equally to the overall risk of a portfolio. This is why it is also known as an “Equal Risk” approach. But as risk is dynamic, not stable, the asset weights must adapt to keep the risk allocation stable. UK investors can build their own all-weather portfolio using four to six ETFs representing broad asset classes: global equities, UK equities, gilts, property, gold and cash equivalent, depending on complexity. In order to keep the risk allocation stable, the asset weights might need to change each month to reflect the changing risk and correlation relationships of and between those asset classes. In summary: the advantage of this Equal Risk approach is that a portfolio is truly diversified from a risk contribution perspective. The disadvantage of this approach is it requires a regular change of weights to reflect changing short-term volatilities and correlations. The Permanent Portfolio The permanent portfolio is a concept pioneered by the late Harry Browne, a US financial adviser, in his 1999 book “Fail-Safe Investing”. It has many adherents in both the US and the UK, but to date it is only really in the US that one can find ‘Permanent Portfolios’ on offer, something UK investors seem keen to change. The concept is similar to the all-weather portfolio, but in a more straightforward format. Rather than trying to target an “Equal Risk” contribution with changing asset-class weights, the Permanent Portfolio is a simple Equal Weight approach to four main asset classes to reflect different market regimes, so that whatever the regime, the portfolio has got it covered. Browne outlines four market regimes[2], and related asset exposure for that regime:
US versions of this strategy use US equities for the equity exposure and US treasuries for the bond exposure. So what would a UK version look like? We constructed a Permanent Portfolio for UK investors using 4 London listed ETFs: SSAC for global equities, IGLT for UK bonds, SGLN (iShares Physical Gold ETC) for gold and ERNS (iShares GBP Ultrashort Bond UCITS ETF) for cash equivalents for some additional yield over cash that will capture rising interest rates. In summary: the advantage of this Equal Weight approach is its simplicity and low-level of maintenance required. The disadvantage of this approach is that it disregards short-run changes in volatility and correlation that are captured in the Equal Risk approach. How do they all compare? Obviously the strategies vary from each other. To evaluate performance, we have created research portfolios for both these strategies. What becomes apparent is that the outperformance of these low-cost, equal-risk and equal-weight all-weather and permanent portfolios looks relatively attractive when set against many more complex (and expensive) “all-weather” absolute return funds. Find out more about our All-Weather Portfolio of ETFs for UK investors. Find out more about our Permanent Portfolio of ETFs for UK investors. See all our Research Portfolios Attend our CPD webinar on this topic [1] https://www.bridgewater.com/research-and-insights/the-all-weather-story [2] Harry Browne, Fail-Safe Investing, (1999) Rule #11 Build a bullet-proof portfolio for protection (pp.38-49) 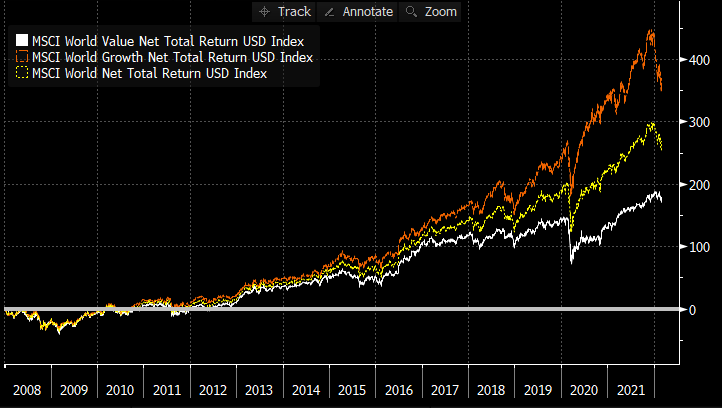 [5 min read, open as pdf]
The “great rotation” to Value began towards the end of 2020 as inflation fears came into focus. It has been rewarded. Since Dec 2020, the MSCI World Value factor has delivered +21.43% returns to 25th February 2022 compared to +7.70% return for Growth factor and +14.78% for the parent MSCI World index (a traditional market-cap based index), all in GBP terms. If we look back further at relative performance since end 2007 to 25-Feb-22, we can see that Value’s underperformance relative to Growth is still material. Over that period, Growth returned +369% (11.54%pa), compared to +179% (7.52%pa) for Value, and +268% (9.63%pa) for traditional market-cap based world equities, in GBP terms. On this basis, the re-rating of Value, relative to Growth, has room to run in the face of a persistent inflationary regime. Read full article with charts Watch our CISI-accredited CPD on an Introduction to Factor Investing 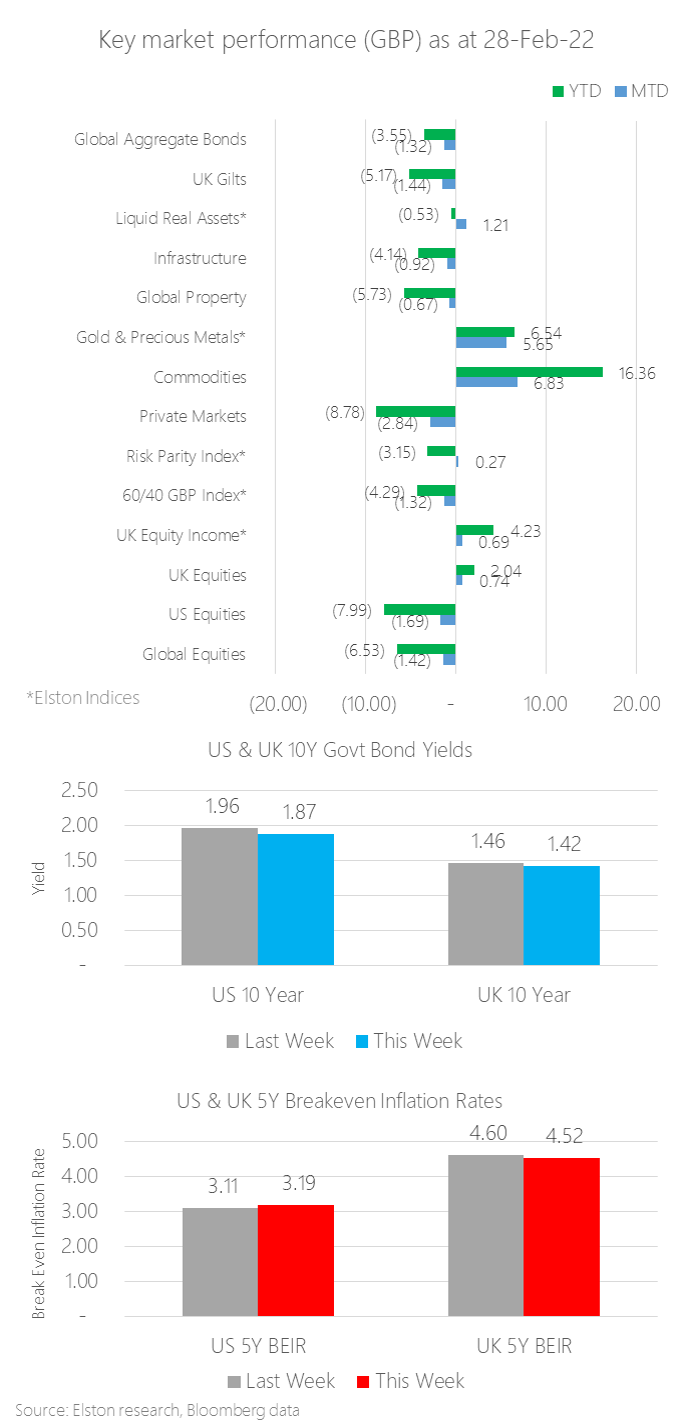 [3 min read, open as pdf]
Monthly update Commodities was the top performing asset class in February, returning +6.83% in GBP terms, on inflation fears and energy crisis- exacerbated by political risk resulting from Russia’s invasion of Ukraine. Fears of the first European land war since the 1990s also drove demand for Gold as a safe-haven asset and inflation hedge. Our Gold & Precious Metals index – a composite of predominantly gold, but also silver, platinum and palladium – increased +5.65% MTD in GBP terms. Within equities, UK equities continued to outperform US and global equities owing to the inherent value bias. Our Liquid Real Assets index returned +1.21% for the month, compared to Gilts -1.44%. Within the multi-asset space, our “Equal Risk” or Risk Parity Index returned +0.27%, compared to -1.32% for a traditional 60/40 portfolio. US & UK 10 year yields closed at 1.87% and 1.42% respectively US & UK 5 year market-implied Break Even Inflation Rates closed at 3.19% and 4.52% respectively. Our granular asset-level report is updated in our Quarterly Review and Outlook after each March, June, September and December quarter end. Market performance The month-end market performance snapshot is summarised in the chart below. For latest commentary, please refer to our Insights and weekly Friday Insights email.  [5 min read, full article in pdf]
This war unleashes a European tragedy. In this insight, we outline what this far larger war means for Ukraine and Europe, how it could potentially stop, the impact on markets – with a focus on energy supply and associated risks to growth and inflation – and finally on portfolio positioning.  [5 min read, open as pdf]
In our 2022 outlook, we explained why inflation will remain hotter for longer and will settle above pre-pandemic levels. Advisers should consider how to adapt portfolios for inflation across each asset class – equities, bonds and alternatives. Research demonstrates how different asset classes exhibit different degrees of inflation protection over different time-frames. Equities therefore provide a long-term inflation hedge.
In this article, we explore how to adapt portfolios for inflation within and across each asset class: Equities, Bonds and Alternatives. For full article, read as pdf 
Geopolitical risk: a European war? Despite a flurry of urgent diplomatic activity in the last three weeks, the risk of a proxy or even direct war between NATO and Russia over Ukraine is real and worrying. We explore the context, summarise the diplomatic efforts and outline four potential scenarios. Full report available to Clients or on request Image shows 2010 Presidential election voting results Image author attribution: By Vasyl` Babych - Own work, CC BY 3.0, https://commons.wikimedia.org/w/index.php?curid=11453740  [3 min read, open as pdf]
2021 in review Our 2021 market roundup summarises another strong year for markets in almost all asset classes except for Bonds which remain under pressure as interest rates are expected to rise and inflation ticks up. Listed private equity (shares in private equity managers) performed best at +43.08%yy in GBP terms. US was the best performing region at +30.06%. Real asset exposures, such as Water, Commodities and Timber continued to rally in face of rising inflation risk, returning +32.81%, +28.22% and +17.66% respectively. 2022 outlook We are continuing in this “curiouser, through-the-looking glass” world. Traditionally you bought bonds for income, and equity for risk. Now it’s the other way round. Only equities provide income yields that have the potential to keep ahead of inflation. Bonds carry increasing risk of loss in real terms as inflation and interest rates rise. Real yields, which are bond yields less the inflation rate, are negative making traditional Bonds which aren’t linked to inflation highly unattractive. Bonds that are linked to inflation are highly sensitive to rising interest rates (called duration risk), so are not attractive either. How to navigate markets in this context? The big three themes for the year ahead are, in our view:
See full report in pdf Attend our 2022 Outlook webinar 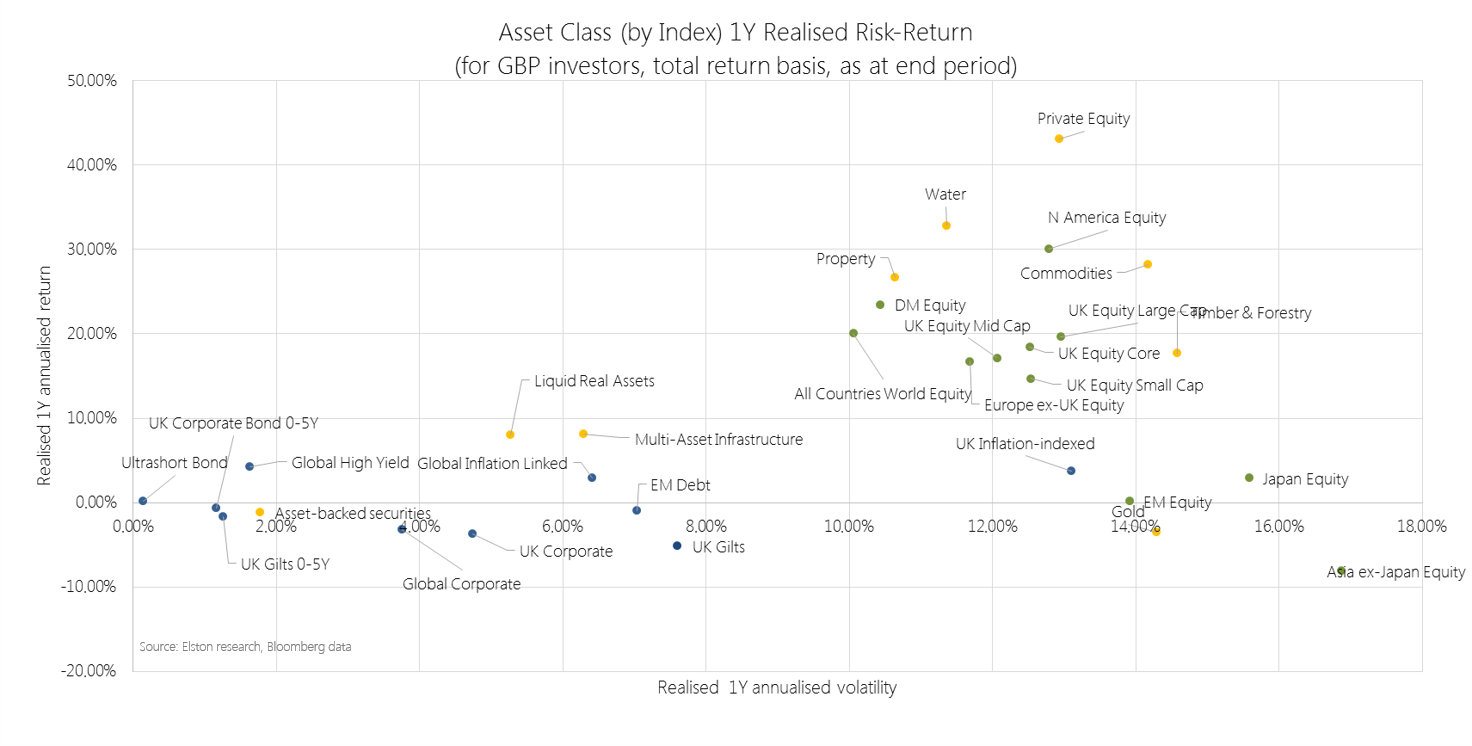 [3 min read, open as pdf]
Sustained recovery in risk assets 2021 saw a sustained recovery in risk assets, with the exception of Emerging Markets. Listed Private Equity was the top performing exposure returning +43.08% in GBP terms. Regionally, US equities remained the strongest performing market +30.06%. Real assets to the fore Real asset exposures, such as Water, Commodities and Timber continued to rally in face of rising inflation risk, returning +32.81%, +28.22% and +17.66% respectively. Our Liquid Real Assets Index (ticker ELSLRA Index) – which combines higher risk real assets and lower risk rate-sensitive assets to deliver volatility similar to bonds – returned +7.98%, whilst UK Gilts declined -5.16%. UK equity income strength Within UK equity market segments, UK Equity Income outperformed all other segments as inflation fears made income-generative, value-oriented shares relatively more attractive. UK Equity Income, represented by our Freedom Smart Beta UK Dividend Index (ticker ELSUKI Index), returned +20.77%, whilst UK Large Cap returned +19.68% and UK Core returned +18.44%. UK Small Cap was the weakest UK segment, returning +14.70% for the year. Read as pdf Register for our Quarterly Investment Outlook on 26 January 2022 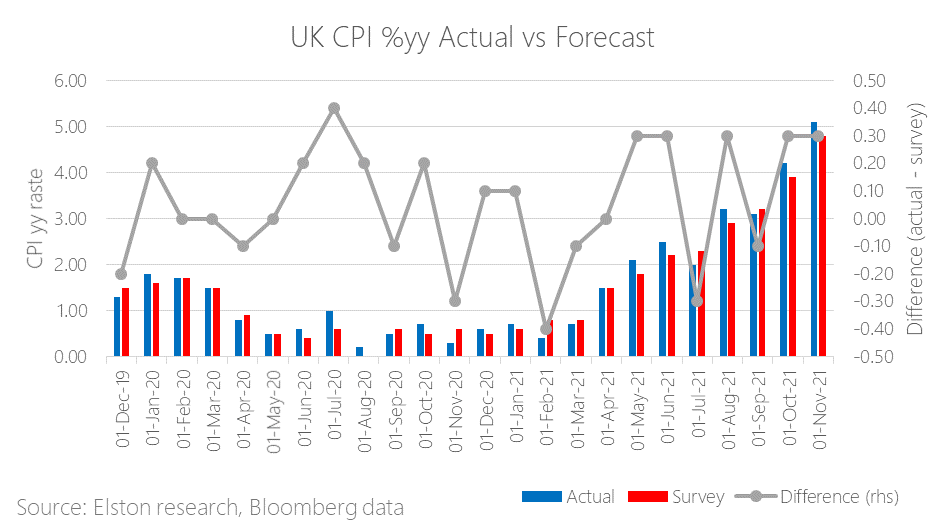 [7 min read, open as pdf]
Fed signals tightening Fed Chairman Jerome Powell signalled that inflation is now the biggest risk to growth, and getting the labour market back to pre-pandemic levels. The US will accelerate “tapering” or reduction of supportive asset purchases, and set out the potential for rate hikes in coming years (although no change in long-term target rate). And despite rate hikes usually spooking markets, markets rallied: why? Because the bigger concern was that the Fed was behind the curve and not getting on top of inflation. The risk of a so-called “policy error” had investors concerned. The fact that market-implied policy rates did not change before and after the policy announcement, suggests that this was a case of the Fed catching up with the market, than the market catching up with the Fed. UK inflation Meanwhile, UK inflation pressure continues, with November inflation data coming in at +5.1%yy, ahead of +4.8%yy forecast, the fastest rate in a decade. Transport, clothing and food were the main contributors. The risk is that inflation creeps into wage growth which would make it harder to bring inflation down to long-term target of 2.0%. This is the second month in a row of an upside surprise. The figure is also at the upper end of scenarios envisaged by the Bank of England at the November MPC meeting. Bank of England raises rates The Bank of England today announced a +0.15% increase in the Bank Rate from 0.10% to 0.25% citing “more persistent” inflation, and following the Fed’s lead in a greater level of tightening. Furthermore, the Bank of England minutes suggest that inflation could remain at elevated levels and “expect inflation to remain around 5% through the majority of the winter period, and to peak at around 6% in April 2022” Markets are pricing a 80% chance of a further +0.25% to 0.50% in February 2022. In October, BoE Governor, Andrew Bailey guided that rates would need to rise to address inflation. Where are breakeven rates? The UK 5 year breakeven rate is at 4.38%, following the announcement, compared to 4.66% at the end of last week. The US 5 year breakeven rate is at 2.73% today from 2.80% at the end of last week. Liquid Real Assets performance Our Liquid Real Assets Index combines exposure to higher risk-return real assets for inflation protection and lower risk-return rate-sensitive assets for interest rate hike protection for an overall volatility that is comparable to UK bonds. By incorporating allocations to exposures that are driving inflation, such as Commodities, or can pass-through inflation, such as Property and Infrastructure, the real assets index can provide a return premium in excess of inflation and in excess of nominal bonds. Summary Inflation is proving persistent, policy makers are catching up to keep it in check. Nominal bonds will remain under pressure, particularly longer-duration in a rising inflation, rising interest rate environment. We advocate pairing equity allocations with diversified real asset exposure that can respond to inflation and floating rate notes that can respond to interest rate hikes. Read full article with charts as pdf Register for our Quarterly Investment Outlook on 26 January 2022  [5 min read, open as pdf]
Interest rates expected to rise As the run up in inflation looks more persistent, than transitory, there is growing likelihood that Central Banks will raise interest rates in response. Following an extended “lower for longer” near-Zero Interest Rate Policy following the 2008 Global Financial Crisis and the 2020 COVID Crisis, the market futures-implied expectations for the Fed Funds rate, points to a “take off” in 2022 in response to rising inflation, following COVID-related policy support, to an expected 1.01% interest rate level in Dec-23[1], from 0.88% last quarter. Fig.1. Fed Funds Rate and implied expectations 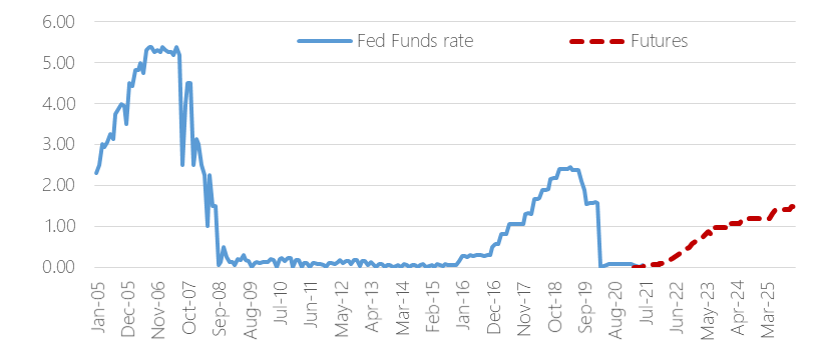 Source: Elston research, Bloomberg data
The potential for increased interest rate volatility, as rate hike expectations increase, means that investors that are seeking to dampen interest rate sensitivity (“duration”) are allocating to shorter-duration exposures, such as ultrashort-duration bonds, and also to Floating Rate Notes (FRNs). What is a Floating Rate Note? Floating Rate Notes receive interest payments that are directly linked to changes in near-term interest rates and can therefore provide a degree of protection against interest rate risk, when interest rates are rising. Issued for the most part by corporations, FRNs pay a periodic coupon – typically quarterly – that resets periodically in line with short-term interest rates. This could be expressed as a premium or “spread” over a currency’s short-term risk-free rate, such as (in the UK) the 3 month SONIA rate (Sterling Overnight Index Average, and prior to that GBP LIBOR) in the UK, or (in the US) the 3 month SOFR (Secured Overnight Funding Rate, and prior to that USD LIBOR). These indices overnight borrowing rates between financial institutions. The size of the premium or spread reflects the creditworthiness of the issuer: the higher the spread, the greater the rewarded risk for owning that security, and typically stays the same for the life of the bond and is based on the issuer’s credit risk as deemed by the market. How can FRNs benefit investors? Floating Rate Notes are a lower-risk way of putting cash to work and provide a useful direct hedge against interest rate fluctuations. When incorporated into a bond portfolio, they can help bring down duration given their reduced sensitivity to interest rate changes, as well as provide a return pattern that is directly and positively correlated with changes in interest rates. Compared to nominal bonds, such as Corporate Bonds and UK Gilts, FRNs’ yield can increase as/when interest rates increase. Relative to money market funds, FRNs may provide some additional yield pick-up, as well as very short <1 year duration. Key considerations when investing in FRNs Portfolio investors can access FRNs through funds and ETFs. Key considerations when investing in FRNs include, but are not limited to:
Summary The expected timing of interest rate “lift off” in the US and UK will change as markets adapt to evolving growth and inflation outlook during the post-COVID recovery, and in response to the risk of further disruption from new virus variants. However, as interest rate rises become more likely, and incorporating an allocation to Floating Rate Notes for protection against interest rate risk makes sense within the bond allocation. Watch the CPD Webinar: The Quest for Yield [1] Data as at last quarter end 
Inflation is proving more persistent than transitory. In an inflationary environment, Value style investing has the potential for continued outperformance relative to other factors. For UK fund investors, actively managed funds with a value-oriented philosophy, UK equity income funds with an inherent value bias and Value-factor index funds/ETFs offer ways of increasing allocation to Value within a portfolio. Read the article (5 min read) Watch the webinar 
Read the article in full (5 min read) Following the post-COVID restart, there would necessarily be an inflationary spike, from base effects alone. Central Banks’ core thesis was that this spike would be “transitory”, rather than “persistent”. However, the combination of pent-up demand, supply chain disruptions and an energy crisis suggests that inflation could prove more persistent than transitory. We look at the numbers and how this informs the “big picture triangle” of three key macro factors: growth, inflation and interest rates. Finally, we outlined potential interventions in portfolio positioning from an asset allocation perspective. Nominal bonds are known to be structurally challenged in an inflationary regime, and propose real asset exposure instead. Within equities, we would propose an income/value bias. Regiser for our 3q21 Review & Outlook: The Big Squeeze 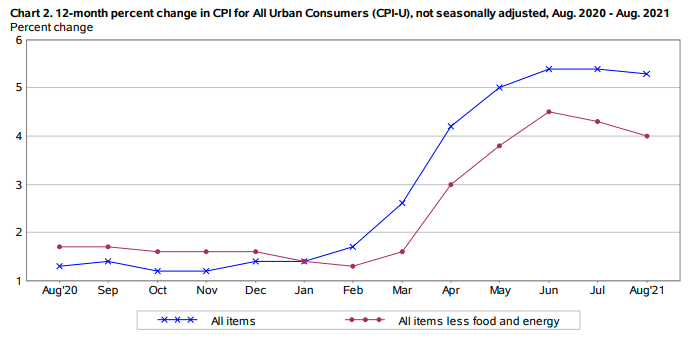 [3 min read, open as pdf]
US inflation moderates US CPI moderated from +5.4% to +5.3% y/y, whilst Core PCI (excluding energy and food) moderated from +4.3%yy to +4.0%yy. Full article in pdf 
US inflation at highest level in 13 years running at +5.4%yy for second month, Core inflation (excl energy) +4.3%yy (Jul) from +4.5% (Jun). With a slight moderation in core inflation, economists are calling this as the inflation "peak". Whilst this may represent "peak inflation" year over year, overall inflation levels will remain elevated on restart and supply chain constraints As explored in our recent article on “catch-up” rates, we believe Fed policy will remain accommodative, with interest rates "lower for longer", as it lets inflation run "hotter for longer". This is positive for risk assets that offer inflation protection In inflationary regime we favour value-bias equities and real assets for diversification. 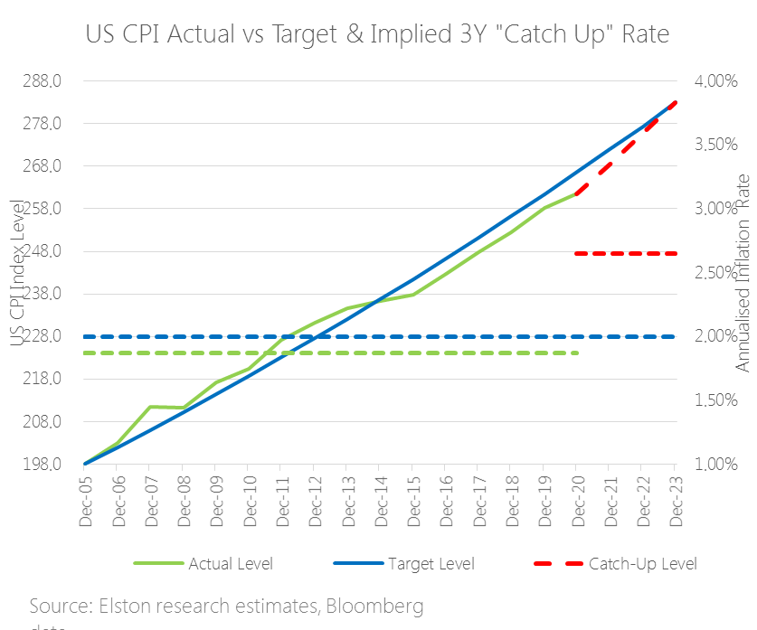 [3 min read, open as pdf]
The inflation theme is resonating in US earnings calls with company CEOs seeing this "temporary regime" lasting longer into 2022. In terms of prints, June CPI in the US was +5.4% and core CPI +4.5% - the highest print since November 1991. Markets have been caught between a push-pull between inflation data and interest rate policy response. Concerns that inflation is more persistent than transitory is driving flows to “risk on” assets. Related concerns that the Fed might start tightening policy earlier and sharper has been the “risk off” trade. Looking at inflation “catch-up” rates suggests that the Fed might let inflation run hotter for longer, pointing to a later lift off in rates from current low interest rates. This would be supportive for risk assets. What are “catch-up” rates? In 2020 ahead of the annual Jackson Hole conference the Fed indicated that it would take a more accommodative approach to inflation crossing the 2% target threshold. Why is this? Part of the answer is the concept of “catch up” rates. Essentially this means that a rate above 2% temporarily is ok if it means we are getting back to a 2% long-term trend-line. Effectively, letting inflation run hot and overshoot target in the short-term can make up for system slack/undershoots in prior years. What are the reference points? We don’t’ know the reference points (basis, trend-lines or catch-up period) the Fed will be using in its Policy decisions. So to illustrate this concept of “catch up rates”, we created an example with cumulative inflation (left hand scale) and average inflation rates (right hand scale). Our methodology We took December 2005 as a base, applied a cumulative 2% target inflation path (in blue), and then plotted cumulative path based on actual inflation rate (in green, averaging (dotted green line) 1.87%p.a. to June 2020 – i.e. below target rate). The red dashed line is the implied path back to trend-line assuming a “catch-up rate” of 2.65%p.a. (red-dotted line) that it would take for inflation to get back to the original trendline over 3 years. The catch up rate would be higher if using a shorter time-frame, and lower if using a longer-time frame. Conclusion Looking at implied three year “catch-up” rate helpso illustrate the concept and explains why Fed might let inflation run hotter for longer, pointing to a later lift off in rates. In inflationary regime we favour value-bias equities and real assets for diversification. Find out more in our quarterly review and outlook.  [10 min read, open as pdf]
 In this white paper, we revisit the core principles of inflation
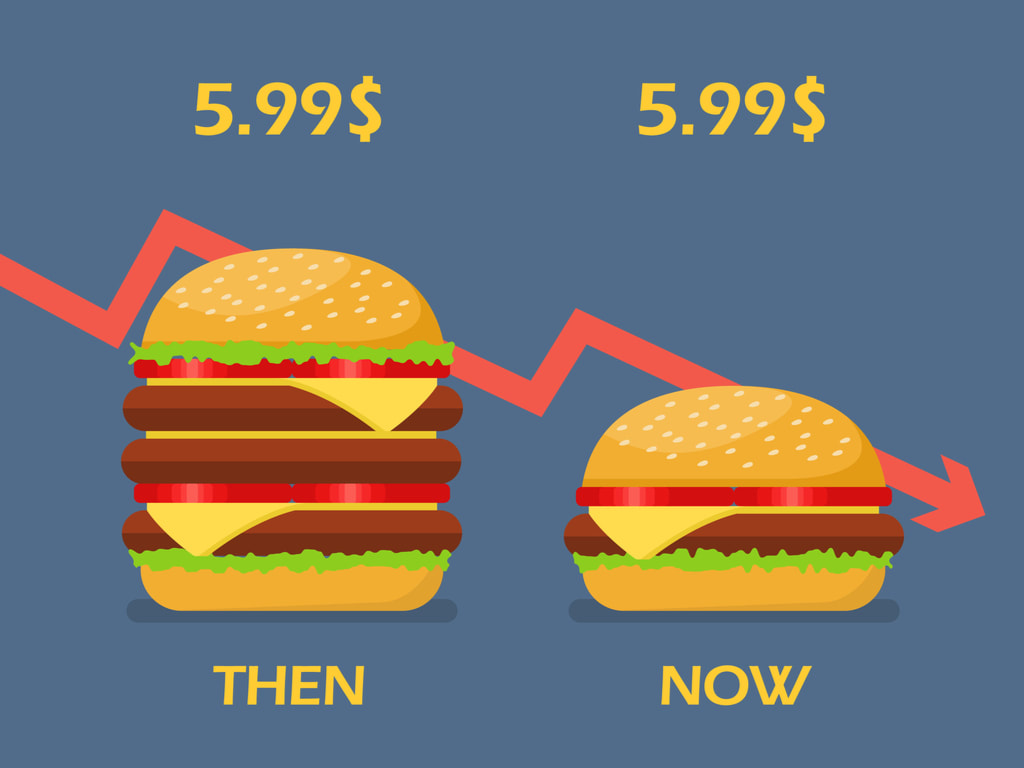
[15 min read, open as pdf]  [3 min read, open as pdf] Inflation is on the rise: equities provide long-term inflation protection Inflation risk means greater focus on intrinsic value such as dividends UK equities with value and/or income bias are attractive Inflation is on the rise, and whilst it’s broadly accepted that equities can provide a long-term inflation hedge, which kind of equities are best positioned to provide this. Since the financial crisis, Value investors have been jilted by a market love affair with Momentum. The switch back to Value was already being called on purely a valuation basis since late 2019. But the rekindling of inflation risk in the market is only making companies with a Value-bias and a progressive quality income stream back in the spotlight. What is quality income? Quality means persistency, focusing on companies that regularly pay a stable or increasing dividend, whilst mitigating dividend concentration risk. “One of the most persuasive tests of high quality is an uninterrupted record of dividend payments going back many years.” Benjamin Graham Indeed, research suggests that Dividends are a key anchor of Total Returns, although this differs from market to market. 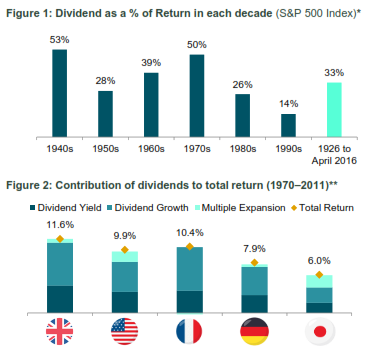 Figure 1: Source: S&P Dow Jones Index Research August 2016
Figure 2: Source: JP Morgan, The Search for Income: A Global Dividend Strategy, 2012 How then to screen for companies that can deliver this type of strategy? Is it just about yield? We don’t think so. High yield is not high quality Screening for high dividend yield alone can lead to “value-traps” that negatively impact performance. The poor performance is because those high-yielding companies might be poor businesses with unstable dividends. Market cap weight or Dividend contribution weight Traditional equity indices are market-capitalisation weighted. The resulting dividend income for an index is therefore a function of each company’s size. An alternative approach is to weight the holding in each company by its contribution to overall dividends. This way the index is focused on the biggest dividend payers, rather than the biggest companies by size. This creates a direct bias towards Yield, and an indirect bias towards Value, from a factor-exposure perspective. Forward- or backward-looking Active equity income managers typically look at forward-looking dividend estimates. Index-based “passive” equity income strategies often look at historic dividend yield for ranking purposes. This is sub-optimal. We believe that index strategies that focus on equity income should use forward-looking estimates, to systematically capture upswings in earnings and dividend estimates. Equities as an inflation hedge It’s broadly accepted that equities can provide a long-term inflation hedge. But what kind of equities are likely to perform well in an inflationary regime? We believe there are three characteristics:
Why the Value focus in inflationary environment? When the two major styles of investing are compared, i.e., growth and value investing, the latter style rejects the efficient market hypothesis and choses an equity with lower expectations, which is often undervalued and would profit quickly when the market adjusts itself. During an inflationary environment, economic concepts direct that the ‘time value of money’ has a major role to play. Thus, an equity today, becomes of greater value, when compared to its worth tomorrow. Hence, value investing seems attractive in an inflationary world since the investors are less willing to pay up for future earnings and can regain their money sooner rather than later, when compared to growth investing. (Murphy, 2021) With a global pandemic, many predicted deflation as a threat; however, with the counter-balancing forces, investors soon realized inflationary threat. (Baron, 2021). Rising inflation is good for value investing for a number of reasons. In general, equity markets are dynamic and display a stronger corelation to inflationary environment, this lays a very strong premise that higher inflation and stronger earnings are co-dependent. Financially speaking, Sectors such as energy, financial are major drivers of the major economic growth. A rise in these value stocks tends to pace up the overall economic growth, thus outperforming others. (Lebovitz,2021) According to JP Morgan’s chief strategist, the change in investing style, this time around could be a more impactful due to several factors such as the failure of monetary and fiscal policies whilst recovering from a pandemic. (Ossinger, 2021) Dividends, dividends, dividends: a tried and tested approach The most fundamental explanation, by John Kingham, a value investor, states that a dividend discount model, attempts to find the true value of the stock, under any market circumstances and focuses on the dividend pay-out factors and the market expected returns. Historically, the companies with dividend have generated higher returns when compared to companies which either have no dividend or eliminated the dividend. (Park and Chalupnik, 2021) This means that dividends hold value when it comes to the total return of the portfolio. Moreover, with the market getting more and more inflationary, and equities getting exposed. Adding companies which can provide returns even in a low growth environment can create a sustainable portfolio. Government bonds have not performed well with rising inflation (Baron,2021) High yielding corporate bonds offered better protection compared to government gilts since these inflations linked bonds add value in-line with RPI Inflation according to Barclays Equity Guilt Study and can protect investors from unexpected inflation, yet they are still not considered as a safe haven like government gilts. (Dillow,2021) Investment manager of Iboss Chris Rush recently told Portfolio Adviser that in order to reduce the inflationary shock the firm had already reduced its positions from treasures and gilts and incorporated strategic bonds They also plan on holding a short duration fixed income. (Cheek, 2021) Although, it might have not been the fundamental goal, over the past several decades until 2017 dividends reported 42% of the S&P 500 Index’s total return. The global recession and now pandemic have created a lack of stability for the layer of support for future returns, however, analysts have assured there is room for recovery. (Markowicz, 2021) Summary Whether transitory or persistent, with inflation on the rise, there is a strong rationale for having an allocation to Value from a factor-exposure perspective. Those value-type firms that generate and pay a progressive dividend policy provides a level of inflation protection both in absolute terms and relative to bonds that is more than welcome, and potentially essential. Henry Cobbe & Aayushi Srivastava |
ELSTON RESEARCHinsights inform solutions Categories
All
Archives
April 2024
|
 RSS Feed
Company |
Solutions |
|