|
[3 min read, open as pdf]
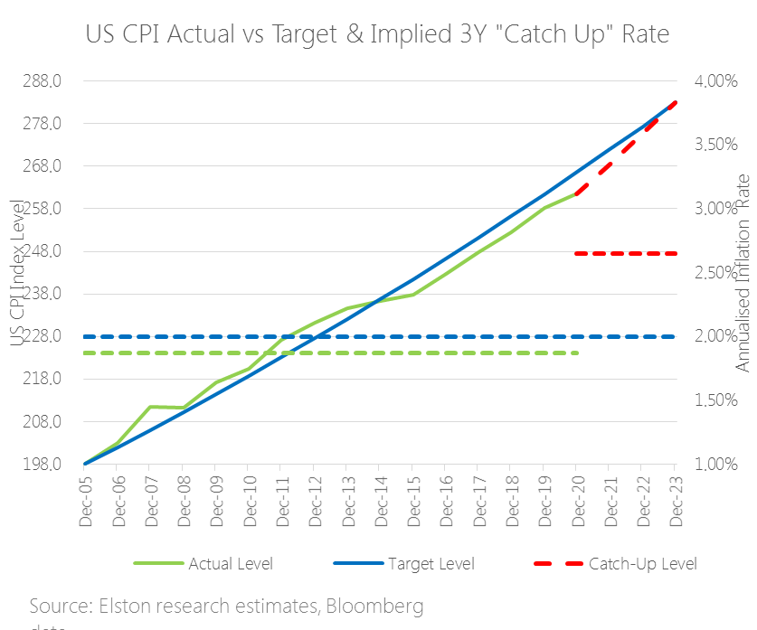
The inflation theme is resonating in US earnings calls with company CEOs seeing this "temporary regime" lasting longer into 2022. In terms of prints, June CPI in the US was +5.4% and core CPI +4.5% - the highest print since November 1991. Markets have been caught between a push-pull between inflation data and interest rate policy response. Concerns that inflation is more persistent than transitory is driving flows to “risk on” assets. Related concerns that the Fed might start tightening policy earlier and sharper has been the “risk off” trade. Looking at inflation “catch-up” rates suggests that the Fed might let inflation run hotter for longer, pointing to a later lift off in rates from current low interest rates. This would be supportive for risk assets. What are “catch-up” rates? In 2020 ahead of the annual Jackson Hole conference the Fed indicated that it would take a more accommodative approach to inflation crossing the 2% target threshold. Why is this? Part of the answer is the concept of “catch up” rates. Essentially this means that a rate above 2% temporarily is ok if it means we are getting back to a 2% long-term trend-line. Effectively, letting inflation run hot and overshoot target in the short-term can make up for system slack/undershoots in prior years. What are the reference points? We don’t’ know the reference points (basis, trend-lines or catch-up period) the Fed will be using in its Policy decisions. So to illustrate this concept of “catch up rates”, we created an example with cumulative inflation (left hand scale) and average inflation rates (right hand scale). Our methodology We took December 2005 as a base, applied a cumulative 2% target inflation path (in blue), and then plotted cumulative path based on actual inflation rate (in green, averaging (dotted green line) 1.87%p.a. to June 2020 – i.e. below target rate). The red dashed line is the implied path back to trend-line assuming a “catch-up rate” of 2.65%p.a. (red-dotted line) that it would take for inflation to get back to the original trendline over 3 years. The catch up rate would be higher if using a shorter time-frame, and lower if using a longer-time frame. Conclusion Looking at implied three year “catch-up” rate helpso illustrate the concept and explains why Fed might let inflation run hotter for longer, pointing to a later lift off in rates. In inflationary regime we favour value-bias equities and real assets for diversification. Find out more in our quarterly review and outlook. Comments are closed.
|
ELSTON RESEARCHinsights inform solutions Categories
All
Archives
July 2024
|
Company |
Solutions |
|


 RSS Feed