
What just happened? The UK’s financial services watchdog, the Financial Conduct Authority (FCA) has fined Henderson Investment Funds Limited, the fund provider that is now part of Janus Henderson, £1.9m ($2.5m) for “failing to treat fairly more than 4,500 retail investors in two of its funds.” The funds named are the Henderson Japan Enhanced Equity Fund and the Henderson North American Enhanced Equity Fund, which had been originally set up and marketed as actively managed funds. In November 2011, the funds’ appointed manager Henderson Global Investors Limited decided to reduce the level of active management of these funds – effectively making them more similar to a passively-managed tracker fund. Who was affected? While this change of strategy was communicated to institutional investors, who were also offered fees to be reduced to zero, there was no such communication or fee adjustment for the 4,713 direct retail investors (who represented 5% of fund value by AUM), and 75 intermediary companies (for example, financial advisers) who remained invested in those funds. How long did this go on for? This discrepancy continued between November 2011 and August 2016, Henderson allowed this discrepancy to continue with retail investors seeing no change in prospectus, objectives or fee levels while the fund was deliberately reposition to a more passive-style strategy: effectively Henderson wilfully converted two of its funds into closet index funds, but just didn’t tell its retail clients. What was performance like during this period? The charts below show the performance of each fund between November 2011 and August 2016. The charts show the funds underperforming the index owing to active fees which creates heavier and heavier drag. Henderson Japan Enhanced Equity (old name) 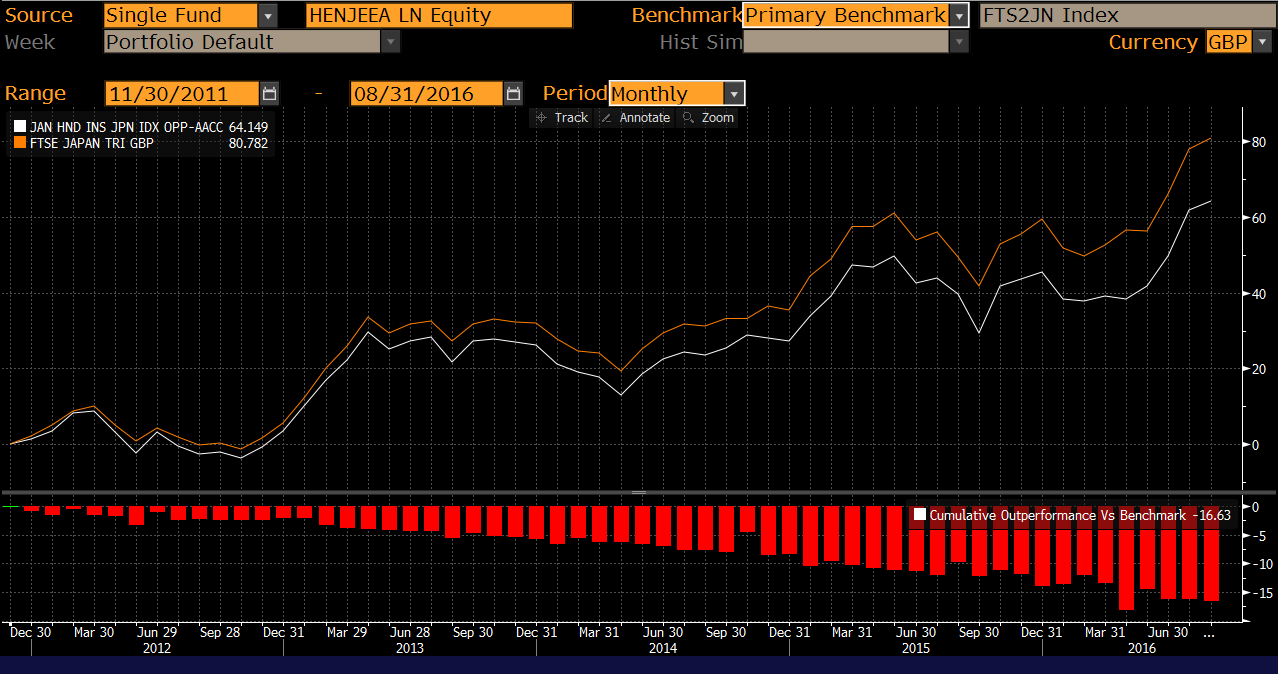 Source: Bloomberg, GBP terms, monthly data, vs selected index Henderson North American Enhanced Equity (old name) 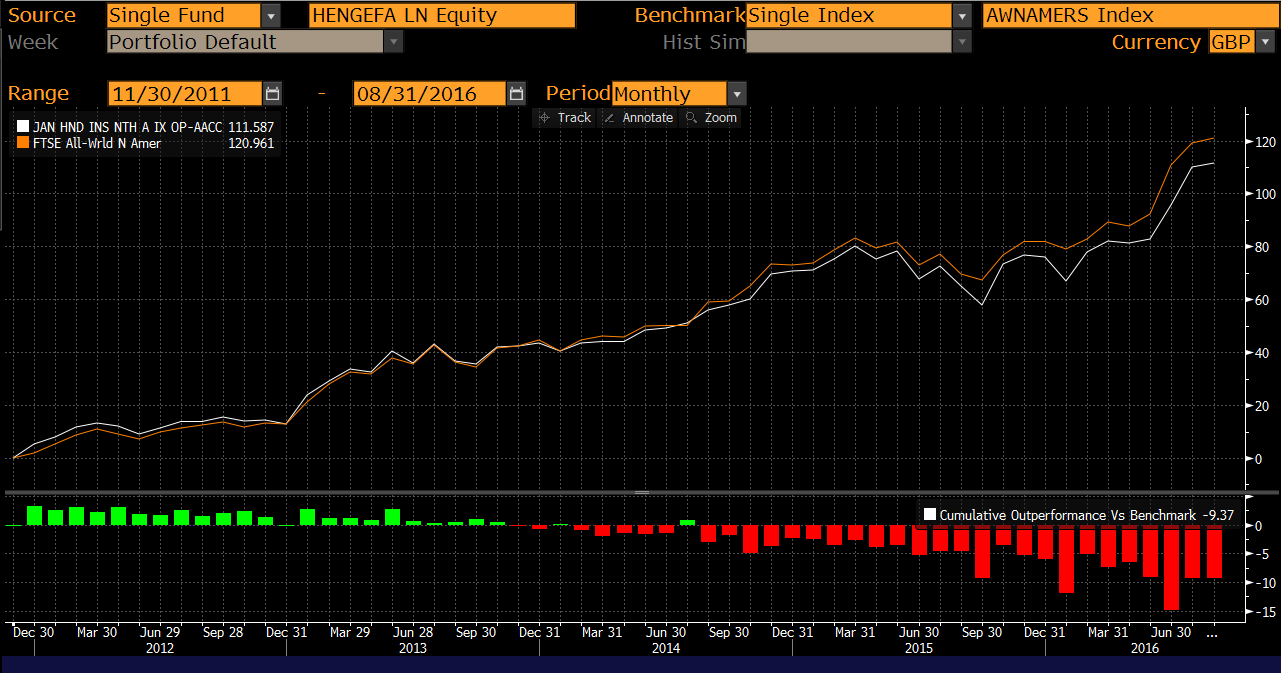 Source: Bloomberg, GBP terms, monthly data, vs selected index What happened after 2016? Based on our research, in 2016, the two offending funds were renamed. The Henderson Japan Enhanced Equity became the Henderson Institutional Japan Index Opportunities fund. The Henderson North American Enhanced Equity became the Henderson Institutional North American Index Opportunities. The retail AMC on these funds was reduced from 1.50% to 0.50%. Information on the two funds is presented in the table below. Fund particulars 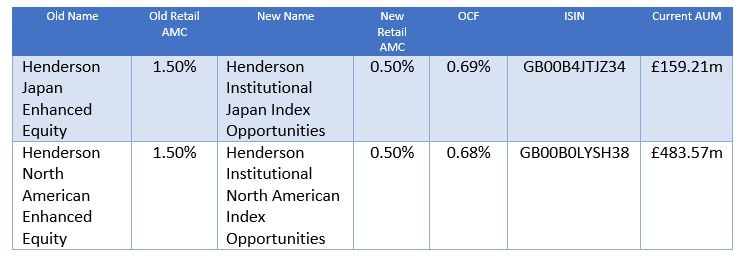 Note: Old name and old retail AMC is pre 2016 changes. New name, new retail AMC and new OCF is as at April 2019. AUM as at November 2019. Source: See fund provider data for each fund here and here Fined for being a closet index fund? The fine is for not treating customers fairly, because for retail clients the change in strategy was not communicated and fees were left unchanged. This contrasts to the treatment of institutional clients, where changes were communicated and fees were offered to be waived. The fine is therefore for leaving retail investors thinking they were invested in active fund even though it had – deliberately – become a closet tracker. Is the first fine for closet indexing in the UK? No, the FCA led the way in 2018 and issued the first fine in Europe for closet index funds, fining a number of unnamed fund houses £34m to compensate clients invested in closet index funds. What’s different this time is that both the manager and the specific funds have been “named and shamed”. How can you tell if an active fund is a closet tracker There are a number of metrics used such as active share, tracking error and R-squared that have been set out by ESMA. On that basis, between 5-15% of all funds offered in Europe could be deemed closet index funds. How was the fine worked out? The total fine was £2.7m, based on £5.8m revenues during the period, but a 30% discount was applied based on Henderson’s cooperation resulting in a £1.9m fine. £1.8m of this fine represents compensation to affected clients, based on the difference in fees paid by retail investor between the two Henderson funds and similar passive products. How can we evaluate a “closet index” fund? There is no defined formula for evaluating a closet index fund. Some measures look at active share, others at a combination of active share, tracking error and correlation. In our view, a closet index fund will have zero or negative alpha, a beta to its index that is close to 1.0x and a high correlation between the fund and the index. Negative alpha means the fund underperforms the index. Beta close to 1.0x means that the fund moves in tandem with the index. Correlation close to 100% means the behaviour of the fund is similar to the index. In terms of similarity to the index, we can see the following metrics for the period under review: Henderson Japan Enhanced Equity (old name) Alpha: -0.198% Beta: 1.033 Correlation: 95.6% Source: Elston research, Bloomberg data, 1-Nov-11 to 31-Aug-16, monthly data Henderson North American Enhanced Equity (old name) Alpha: -0.137% Beta: 1.052 Correlation: 90.0% Source: Elston research, Bloomberg data, 30-Nov-11 to 31-Aug-16, monthly data Investor awareness The fines are helping to increase investor awareness of the closet indexing issue, and we expect long-only retail active managers to remain under scrutiny. Find out more Read the FCA’s final notice Disclosure: I/we have no positions in any stocks mentioned, and no plans to initiate any positions within the next 72 hours. I wrote this article myself, and it expresses my own opinions. I am not receiving compensation for it. I have no business relationship with any company whose stock is mentioned in this article. Additional disclosure: Additional disclosure: This article has been written for a UK audience. Tickers are shown for corresponding and/or similar ETFs prefixed by the relevant exchange code, e.g. “NYSEARCA:” (NYSE Arca Exchange) or “LON:” (London Stock Exchange). For research purposes/market commentary only, does not constitute an investment recommendation or advice, and should not be used or construed as an offer to sell, a solicitation of an offer to buy, or a recommendation for any product. This blog reflects the views of the author and does not necessarily reflect the views of Elston Consulting, its clients or affiliates. For information and disclaimers, please see www.elstonconsulting.co.uk Photo credit: as per specified source; Chart credit: as per specified source; Table credit: as per specified source. All product names, logos, and brands are property of their respective owners. All company, product and service names used in this website are for identification purposes only. Use of these names, logos, and brands does not imply endorsement. 
In this report, we analyse the data around a selected opportunity set of bond indices as represented by London-listed ETFs. The report covers global, USD, EUR, GBP and Emerging Market bond markets, for aggregate, government, corporate, high yield and emerging market exposures. Whilst the bond market dwarfs the equity market, the majority of ETFs are focused on equity exposures. That is gradually changing with growing acceptance of bond ETFs as a convenient and liquid way of accessing targeted bond exposures by geography, issuer type, credit quality, or maturity profile. In this report, we:
For more information and important notices, view the full report. Disclosure: I/we have no positions in any stocks mentioned, and no plans to initiate any positions within the next 72 hours. Business relationship disclosure: This article references research by Elston Consulting that is sponsored by State Street Global Advisors Limited. I wrote this article myself, and it expresses my own opinions. Additional disclosure: This article has been written for a UK audience. Tickers are shown for corresponding and/or similar ETFs and may be prefixed by the relevant exchange code, e.g. “LON:” (London Stock Exchange) for UK readers. For research purposes/market commentary only, does not constitute an investment recommendation or advice, and should not be used or construed as an offer to sell, a solicitation of an offer to buy, or a recommendation for any product. This blog reflects the views of the author and does not necessarily reflect the views of Elston Consulting, its clients or affiliates. For information and disclaimers, please see www.ElstonETF.com All product names, logos, and brands are property of their respective owners. All company, product and service names used in this website are for identification purposes only. Use of these names, logos, and brands does not imply endorsement. Image credit: Elston; Chart credit: n.a.; Table credit: n.a.
What’s new? A bond ETF is not brand new: the first bond ETF launched back in 2002. But they are gaining traction, and as adoption increases the breadth and depth of bond ETFs have also broadened. In my first DIY multi-asset ETF portfolio back in 2008, the main bond ETFs available back then were for broad exposures like Gilts, Index-Linked Gilts and Corporate Bonds. Fast forward over ten years and there’s the ability to access much more targeted exposures. Investors can access both corporate and government bonds for GBP issuers as well as for major currency issuers such as USD and EUR, both unhedged and hedged to GBP. Furthermore, within these opportunity sets investors can select from a range of investment term options, whether short-term (e.g. <5 years), medium term (e.g. 5-10 years), or long-term (>10 years). As well as high yield bonds, more specialised bond exposures are also increasingly available. So whatever the exposure, there is an investable index to express it, and increasingly an ETF to track it. But what is a bond ETF and what are the benefits? A bond ETF is simply a bond fund that can be bought or sold on an exchange, like a share. This has three benefits: it enables access, provides diversification and creates liquidity. According to a recent survey of UK managers, while the access and diversification points are readily understood, there are concerns about liquidity.
Understanding bond ETF liquidity Ultimately the liquidity of a bond fund, whether a traditional fund or an ETF is only as good as the underlying asset. We can term this “internal liquidity”. But if liquidity of a fund itself is a concern then you are probably better off in a bond ETF than a traditional bond funds. Why is that? Simply put the stock exchange creates a secondary market for ETFs (buyers and sellers of bond ETFs trading with each other without necessarily requiring a creation or redemption of units of the bond ETF that would impact underlying bond liquidity). We can term this “external liquidity”. If liquidity of the underlying asset class was a concern and you wished to exit a traditional bond fund, your redemption would be at the discretion of the fund provider and in extremis, you may find yourself gated. So if bond liquidity is a concern, avoid traditional funds and stick to ETFs: there’s a secondary market for them other than the fund issuer. Additional liquidity of bond ETFs By way of example, 2017 provided a stress test for the bond market – in particular high yield bonds. The findings are reassuring. When high yield bond yields spiked in March 2017 and high yield bond values came under pressure, we can see how high yield bond ETFs actually fared in these challenging conditions. The volumes of the secondary market trading between investors buying/selling on exchange (which requires no trading of the fund’s underlying securities) eclipsed net share redemptions (which does require trading of the underlying securities) by a significant factor. The volumes on secondary markets increased to an average of $12.7bn in the first two weeks of March (versus a previous nine-week average of $6.7bn), whilst the net redemptions of high yield bond ETFs was only $3.5bn (representing 6.1% of total assets). A similar resilience was exhibited in November 2017. So far from triggering a liquidity stampede in the underlying holdings, the presence of secondary market enabled investors to trade the ETF holding those bonds amongst themselves. This is why secondary market liquidity is seen as an advantage, rather than a disadvantage. Secondary Market Trading of High-Yield Bond ETFs Increased When Yields Rose in 2017, 29-Dec-16 to 29-Dec-17* 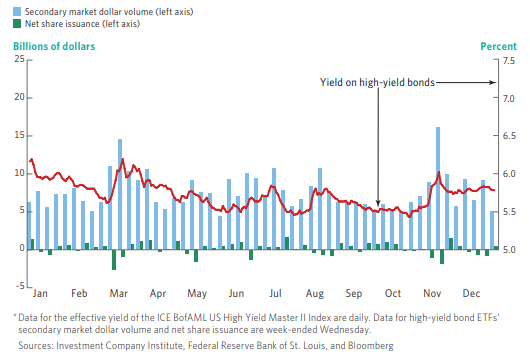 Source: ICI 2018 Factbook. Figure 4.6
The ratio of secondary market volume to net share issuance is therefore one measure of bond ETF liquidity, but the most indicative measure of bond ETF liquidity is bid-ask spread. Conclusion Innovation for bond ETF investing is focused on more nuanced index design and construction of bond ETFs which provide the tools managers need to reflect their views as regards issuer type, term and credit quality when allocating to bonds. The adoption of bond ETFs is demand-led as it enables access, provides diversification and creates liquidity. This is and should be welcome to investors large and small. For more information and important notices, view the full report. Disclosure: I/we have no positions in any stocks mentioned, and no plans to initiate any positions within the next 72 hours. Business relationship disclosure: The article includes references to research by Elston Consulting that was sponsored by State Street Global Advisors Limited. I wrote this article myself, and it expresses my own opinions. Additional disclosure: This article has been written for a UK audience. Tickers are shown for corresponding and/or similar ETFs and may be prefixed by the relevant exchange code, e.g. “LON:” (London Stock Exchange) for UK readers. For research purposes/market commentary only, does not constitute an investment recommendation or advice, and should not be used or construed as an offer to sell, a solicitation of an offer to buy, or a recommendation for any product. This blog reflects the views of the author and does not necessarily reflect the views of Elston Consulting, its clients or affiliates. For information and disclaimers, please see www.ElstonETF.com All product names, logos, and brands are property of their respective owners. All company, product and service names used in this website are for identification purposes only. Use of these names, logos, and brands does not imply endorsement. Image credit: n.a.; Chart credit: ICI; Table credit: n.a. 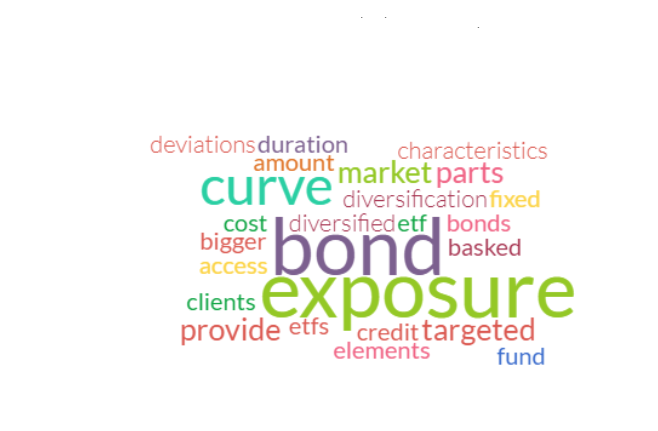
We conducted a Survey of senior portfolio managers and decision makers from firms whose combined assets under management is in excess of £500bn. The survey was designed to get a better understanding on how those managers approach bond investing. Our key findings based on the survey are summarised below:
For more information and important notices, view the full report. Disclosure: I/we have no positions in any stocks mentioned, and no plans to initiate any positions within the next 72 hours. Additional disclosure: The data in this article comes from an Elston ETF Research report “Bond ETF Investing Survey” that was sponsored by State Street Global Advisors Limited. We warrant that the information in this article is presented objectively. For further information, please refer to important Notices and Disclosures in that Report which is available on our website www.ElstonETF.com This article has been written for a UK audience. Tickers are shown for corresponding and/or similar ETFs prefixed by the relevant exchange code, e.g. “LON:” (London Stock Exchange) for UK readers. For research purposes/market commentary only, does not constitute an investment recommendation or advice, and should not be used or construed as an offer to sell, a solicitation of an offer to buy, or a recommendation for any product. This article reflects the views of the author and does not necessarily reflect the views of Elston Consulting, its clients or affiliates. For information and disclaimers, please see www.ElstonETF.com Image credit: Elston Consulting; Chart credit: Elston Consulting; Table credit: Elston Consulting 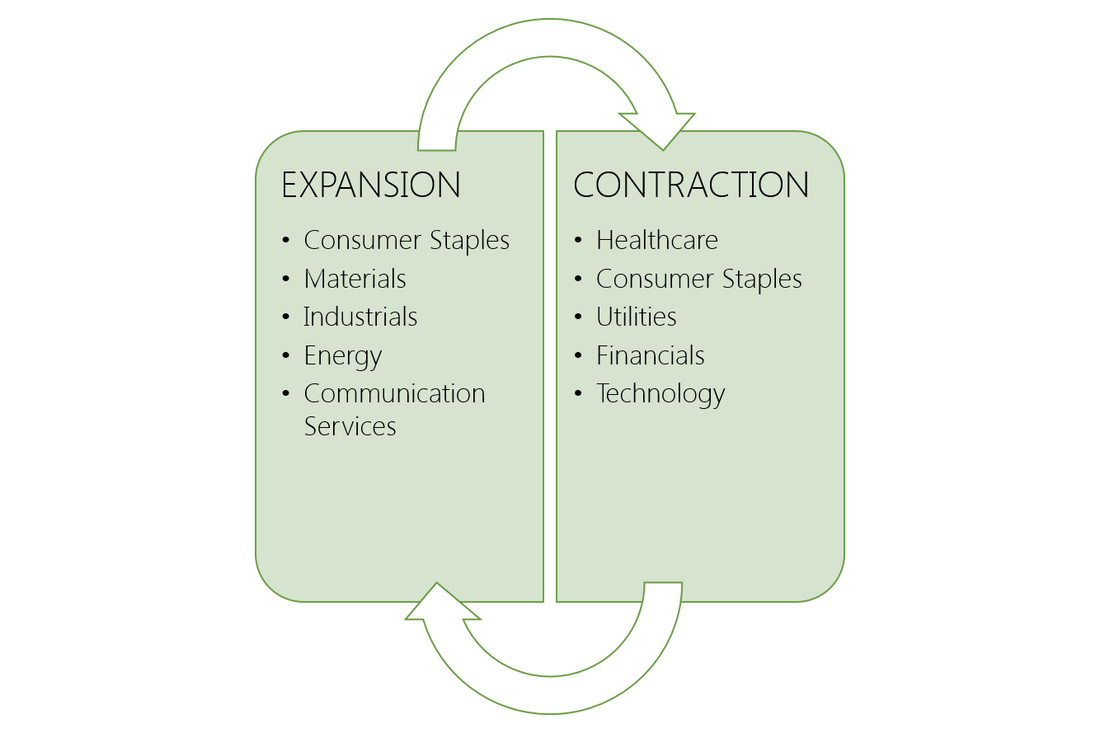
Sectors: walking or just talking? Most portfolio managers discuss markets within the context of the economic cycle. And no wonder: the main drivers of market performance – growth, inflation and interest rates – are not constants but fluctuate with the economic cycle. Managers point to their stock selection decisions because a particular company is seen as “cyclical” or “defensive”. In theory, cyclical companies do relatively better when the economy is expanding. Defensive companies do relatively better when the economy is slowing or contracting. But despite talking the talk on sectors when analysing the economic outlook, it’s harder to judge whether or not managers are walking the walk when it comes to sector investing. If your portfolio manager is not providing a sector allocation in their reporting back, perhaps ask for one. What exactly is a sector? A sector is a group of companies which provide the same or related product or service. The most broadly use classification system is the Global Industry Classification Standard (“GICS”) which categorises companies into 11 distinct sectors. GICS further defines 69 industry types that fall within each of those sectors. Cyclical or Defensive? When a company’s earnings are dependent on or more correlated with the broader economic business cycle, they are “cyclical”. When a company’s earnings are independent of or less correlated with the broader economic business cycle, they are defensive as in theory are less impacted by downswings in the economy. The list of sectors includes sectors considered “cyclical” such as: Communication Services, Consumer Discretionary, Financials, Industrials, Materials, and Technology; and sectors considered “defensive” sectors such as: Consumer Staples, Energy, Health Care, Utilities and Real Estate. Sector indices Sector indices calculate the performance of, typically, the combined market capitalisation of each distinct sector. In this way we are able to see the performance of each sector at different stages of the economic cycle on a standalone basis, in comparison with other sectors, and relative to the overall equity market. Why use a sector lense? By looking both the economy AND the market through a sector lense it is possible to analyse how groups of companies with commonalities as regards their input (expenses) and output (revenues) behave relative to their peers to inform comparisons within each sector, and comparisons between sectors over different time frames. This helps us understand the impact the economy has on sector-specific drivers, and which sectors could be in favour or out of favour at different stages of the economic cycle. Understanding the economic cycle The economic cycle (a.k.a business cycle) is the fluctuation in economic growth rates over time as measured by real (inflation adjusted) Gross Domestic Product as measured by national statistic offices. The economic cycle can be broken down into two broad states: expansion (trend of economic growth) and recession (trend of economic decline). Expansions are measured from the trough (or bottom) of the previous economic cycle to the peak of the current cycle, while recession is measured from the peak to the trough. The economic is different from the market cycle (the fluctuation of the equity markets over time), although one can impact the other. What drives sector performance? Economic activity changes at different changes in the cycle. In periods of expansion, consumers are more likely to increase their non-essential discretionary spending – so Consumer Discretionary should do better. In periods of recession, consumers are more likely to hunker down and focus only on essential spending – so Consumer Staples and Utilities should do better, for example. This seems intuitive. Furthermore, research suggests that more specifically it is the role of monetary policy that really drives sector performance. Central Banks adapt monetary policy based on the economic cycle. When monetary policy is easing, cyclical stocks do generally better. When monetary policy is tightening, defensive stocks generally do better. Surfing the cycle Given the economic cycle and monetary policy are in flux, it follows that an investor with a strategic allocation to equities should dynamically allocate to different sectors at different stages of the cycle, rotating from cyclicals to defensives and back again as the economic cycle fluctuates. This sector rotation strategy can earn “consistent and economically significant excess return while requiring only infrequent rebalancing”. Accessing sectors All equities fall within a sector grouping. Investors must therefore decide whether they wish to construct a portfolio of stocks within each sector or have a fairly concentrated holding within each sector. For investors that want to maximise diversification within each sector, a sector ETF is a convenient way of accessing targeted and comprehensive exposures to distinct sectors. Sector investing Whether investing in a particular sector to capitalise on specific sector trends, or seeking to implement a dynamic allocation strategy between sectors over the economic cycle with an equity allocation, sector ETFs offer a low-cost and convenient way of implementing cyclical sector views efficiently and precisely. Notices and Disclaimers: Disclosure: I/we have no positions in any stocks mentioned, and no plans to initiate any positions within the next 72 hours. Additional disclosure: Recently published Elston ETF Research reports “Sector Equities: 4q18 Update” and “Sector Equities: 4q18 Survey” were sponsored by State Street Global Advisors Limited. We warrant that the information in this article is presented objectively. For further information, please refer to important Notices and Disclosures please see our website www.ElstonETF.com This article has been written for a UK audience. Tickers are shown for corresponding and/or similar ETFs prefixed by the relevant exchange code, e.g. “LON:” (London Stock Exchange) for UK readers. For research purposes/market commentary only, does not constitute an investment recommendation or advice, and should not be used or construed as an offer to sell, a solicitation of an offer to buy, or a recommendation for any product. This article reflects the views of the author and does not necessarily reflect the views of Elston Consulting, its clients or affiliates. For information and disclaimers, please see www.ElstonETF.com Photo credit: N/A; Chart credit: Elston Consulting; Table credit: Elston Consulting 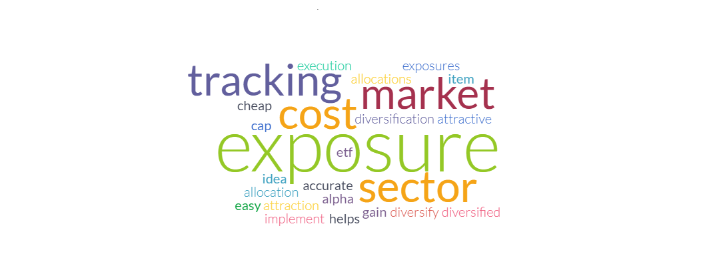 In December we conducted a Survey of senior portfolio managers and decision makers from firms whose combined assets under management is in excess of £500bn. The survey was designed to get a better understanding on how those managers approach sector investing.
Our key findings based on the survey are summarised below:
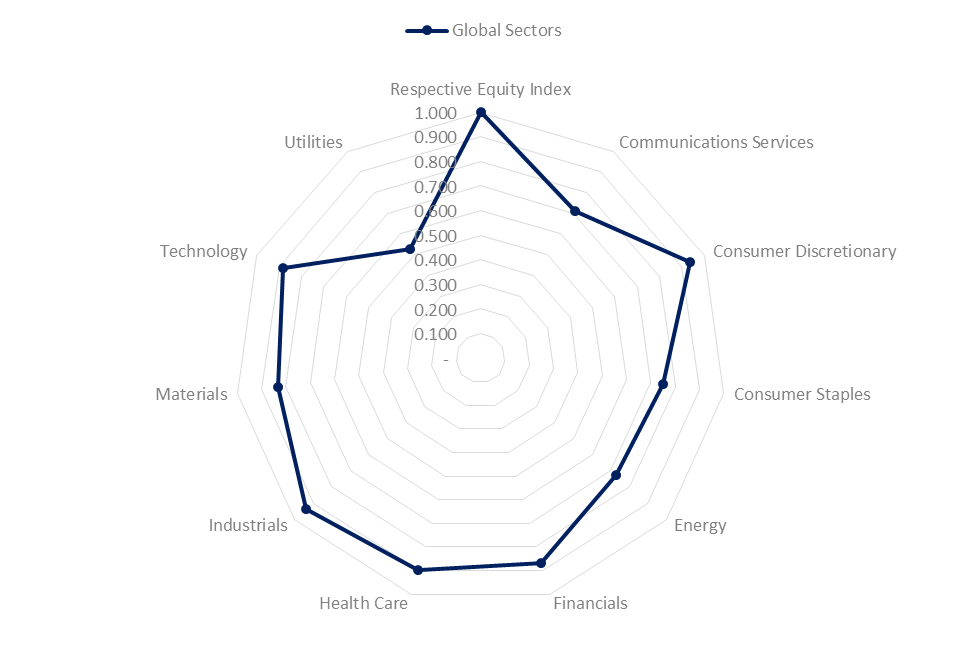
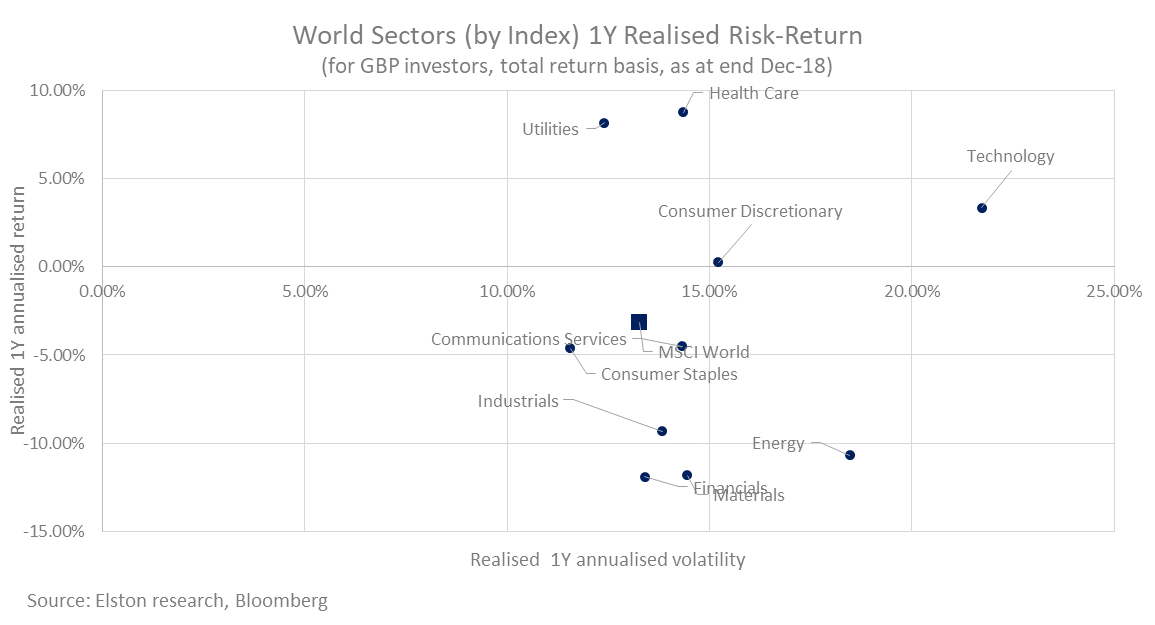
Anywhere to hide? For investors with a broad mandate, asset allocation decisions between equities, alternatives, bonds and cash and equivalents gives scope to limit the impact of market volatility. But what about for mandates which necessarily must remain fully invested in equities. Within the equity sleeve, we believe a sector perspective enables investors to make nuanced adjustments to their equity portfolio. Lower volatility On a one year basis, the lowest volatility sector is Consumer Staples with a volatility of 11.6% compared to 13.3% for World Equities. Consumer Staples is nonetheless 75.1% correlated to world equities. Potential Diversifier Over the last two years, Utilities has shown both lowest beta (0.52) and lowest correlation (52.8%) to world equities. This makes the Utilities sector a potential diversifier within a portfolio context. Chasing growth? From a momentum perspective, Technology remains the strongest performing sector with an annualised return over 3 years of +20.2% (in GBP terms). Conclusion Whilst economic outlook remains key driver for sector-based performance, the current volatility and correlation characteristics of specific sectors are informative from a portfolio construction perspective. Source: Elston Research, Bloomberg. Indices used: MSCI World Index and MSCI World sector index data Notes: Volatility: annualised 260 day volatility to 31-Dec-18; Correlation: 2 year correlation of daily returns to 31-Dec-18; all data expressed in GBP terms. Notices and Disclaimers: Disclosure: I/we have no positions in any stocks mentioned, and no plans to initiate any positions within the next 72 hours. Additional disclosure: The data in this article comes from an Elston ETF Research report “Sector Equities: 4q18 Update” that was sponsored by State Street Global Advisors Limited. We warrant that the information in this article is presented objectively. For further information, please refer to important Notices and Disclosures in that Report which is available on our website www.ElstonETF.com This article has been written for a UK audience. Tickers are shown for corresponding and/or similar ETFs prefixed by the relevant exchange code, e.g. “LON:” (London Stock Exchange) for UK readers. For research purposes/market commentary only, does not constitute an investment recommendation or advice, and should not be used or construed as an offer to sell, a solicitation of an offer to buy, or a recommendation for any product. This article reflects the views of the author and does not necessarily reflect the views of Elston Consulting, its clients or affiliates. For information and disclaimers, please see www.ElstonETF.com Photo credit: N/A; Chart credit: Elston Consulting; Table credit: Elston Consulting
  The phenomenal rise in ETF adoption looks extraordinary. But viewed in the context of any technology upgrade – from tape to CD, from CD to MP3 – there’s nothing outstanding about it. It’s just common sense.
ETFs are just a more flexible and lower cost way of getting exposure to an asset class relative to traditional mutual funds. Whilst some vested interests in the active world murmur about “How might ETFs cope in market distress?” The answer is, repeatedly (including in recent market turmoil), “Just fine, thank you”. Born out of crisis Indeed, the massive switch from Mutual Funds to ETFs is in part a direct result of the Global Financial Crisis. In the GFC, some investors were caught out by 1) not knowing exactly what was in their fund and 2) not being able to sell funds they no longer wanted to manage their risk exposure because they were “gated”. We’ve seen similar gatings of property funds after the Brexit vote, and of bond funds in face of interest rate rises. The two greatest benefits of ETFs are, in my view, their transparency (knowing exactly what’s inside the fund on a daily basis, and how it’s likely to behave) and their liquidity (there’s a secondary market in ETFs via the exchange, which means you can buy or sell an ETF without necessarily triggering a creation/redemption process within the fund). Transparency enables a more precise way of accessing specific asset class exposures. Liquidity is not just about intra-day trading, it’s more about the simple fact that if you don’t want to hold a fund anymore, rather than relying on the goodwill of the manager to accept your redemption order, you can simply sell it on via the exchange. This simple difference is a key advantage of ETFs. Secondary market Take the high yield bond market. So in a rising rate environment, if investors wish to sell high yield bonds, with mutual funds the manager has to sell the underlying investments (putting further pressure on price and liquidity), with ETFs, the manager can simply sell the ETF to another participant willing to come in at a level that is a bargain for both. The underlying investments need not necessarily be sold. Liquidity is only ultimately as good as the underlying asset class. But in every bond market jitter (including last week’s) bond ETFs have continued to function, and enabled liquidity. I prefer to turn the question on its head: what product do you know of (aside from a mutual fund) that you can only sell back to its vendor? I’m struggling for examples: just a quick look on eBay is enough to show that there’s a secondary market in pretty much everything, be it vintage newspapers, matchbox cars or antique furniture. A quick look on the London Stock Exchange, shows there’s a market for pretty much every type of fund: global equity, UK value, UK gilts of different maturity buckets, corporate bonds of different investment grades, gold, commodities, property: you name it, you’ll find it. It’s asset allocation that counts Furthermore, I’ve never bought the argument that “ETFs only work in a bull market”. Sure equity ETFs do well in a bull market, but there are ETFs for each asset class that could be in favour at different stages of the cycle. ETFs are a portfolio construction tool to reflect a desired asset allocation. If you only want high quality, dividend paying equities, there are dual-screened income/quality ETFs. If you don’t want equity exposure, there are bond ETFs. If you don’t want long-duration bonds, there are short-duration bond ETFs. If you want a cash proxy with a bit more yield, there are Ultrashort Duration Bond ETFs. So ETFs don’t perform better or worse at different times in the cycle. Managers can perform better or worse by getting their asset allocation right. ETFs are just a straightforward way of managing a multi-asset portfolio. From closet index to true index ETFs are by definition the commoditisation of mutual fund industry (standardised formats that can be bought and sold at a published price). The plethora of index rules are the systemisation of investment process: whether you’re philosophy is traditional (cap-weighted), momentum, value, small cap, income, or quality there are now indices for most investment styles for most asset classes in most regions. The investor’s toolkit has got smarter, cheaper and more flexible. What’s not to like? Given the large number of closet index funds out there, we can expect a continued switch from closet index to true index to drive ETF adoption yet higher. In the meantime, if anyone knows of an eBay for old mutual fund holdings – please let me know. BMO has lowered the cost of its bond ETF range by -43% from 30bp to 17bp as it passes through the economies of scale to end investors.
BMO’s bond ETFs offer access to the global corporate bond market, whilst giving investors the choice to select their preferred exposure, as defined by maturity. iShares offers the most popular London-listed global corporate bond ETF (CRPS). This tracks the Bloomberg Barclays Global Aggregate Corporate Bond Index at 0.20% TER. Its GBP-hedged version (CRHG) understandably costs slightly more at 0.25% TER for the convenience of in-built currency hedging. Like iShares, BMO also offers a GBP-hedged range, but has a more nuanced approach by offering investors a choice of three different ETFs each with a different maturity range: 1 to 3 years (ZC1G), 3 to 7 years (ZC3G) and 7 to 10 years (ZC7G). This compares to the average maturity of the main index of approximately 9 years. The ability to access this exposure by maturity is particularly useful for UK institutional and pension scheme investors who are looking to construct liability-relative portfolios where both duration and currency controls are important to avoid asset-liability mismatches. The BMO range has gathered some £117m AUM since launch in November 2015 (inflows of £3m per month on average). This compares to iShares' CRPS size of £824m since launch in September 2012 (inflows of £12m per month on average). As the advantages of bond investing with ETFs become more apparent (secondary liquidity, transparent exposure, daily disclosure of underlying), we expect increasing price competition and greater nuance within the most popular strategies. ETFs mentioned ZC1G BMO Barclays 1-3 Year Global Corporate Bond (GBP Hedged) 0.17% TER ZC3G BMO Barclays 3-7 Year Global Corporate Bond (GBP Hedged) 0.17% TER ZC7G BMO Barclays 7-10 Year Global Corporate Bond (GBP Hedged) 0.17% TER CRPS iShares Global Corporate Bond (Unhedged) 0.20% TER CRHG iShares Global Corporate Bond (GBP Hedged ) 0.25% TER (All ETFs mentioned are UCITS ETFs listed on the London Stock Exchange)
What are CoCos? Following the 2008 financial crisis, banks had difficulty issuing traditional debt securities, and had to sit on a large amount of capital to ensure their balance sheet strength was maintained. CoCos were created as the issuing banks flexible friend. This is because are designed to absorb losses when the balance sheet of the issuing banks weakens below a threshold level. Losses can be absorbed by the CoCo converting into equity or suffering a write-down of its principal value making it more flexible than traditional bank securities. To offset the risk of loss, CoCos are issued with a higher coupon than traditional bank bonds. Accessing CoCos Whilst bond funds may include CoCos, direct access to CoCos as a targeted allocation was previously only available to institutions who could meet minimum issuance sizes from one or more issuer. By accessing CoCos using an ETF, the minimum investment drops to $100, and the ETF is diversified across 29 CoCos from 24 different issuers. Why include CoCos in a portfolio? Convertibility into the issuing bank’s shares means that CoCos provide an exposure that has both bond and equity-like characteristics. When there is higher risk of balance sheet stress, CoCo's behave more like equities. When there is lower risk of balance sheet stress, CoCo’s behave more like bonds. CoCos' moderate correlation to equities and low correlation to Corporate and Government Bonds makes them a useful diversifier from a portfolio construction perspective. Fig.1. Correlations to major asset classes 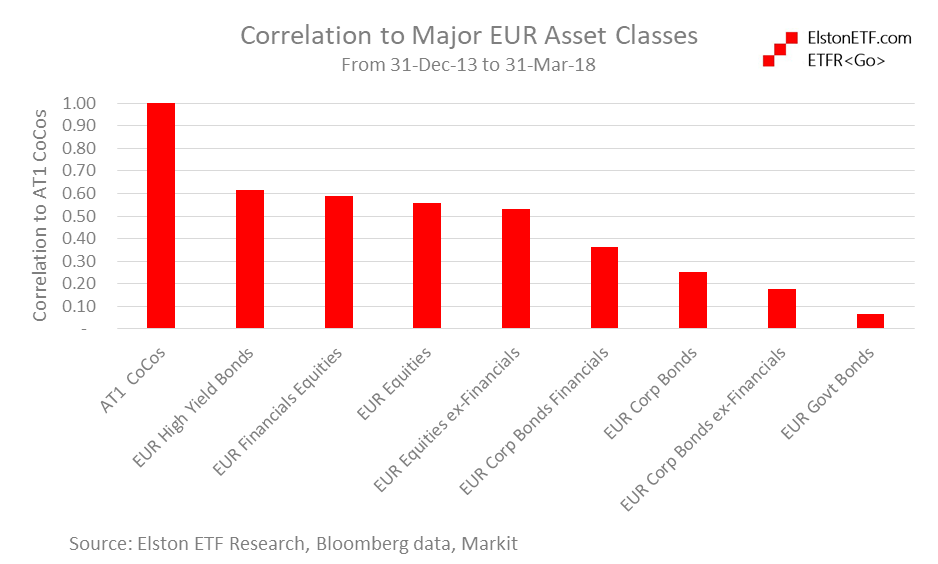 Bigger income & better credit quality CoCos have an attractive income to reward risk taken, but a better quality credit rating compared to traditional High Yield Bonds. Fig.2. Income Profile 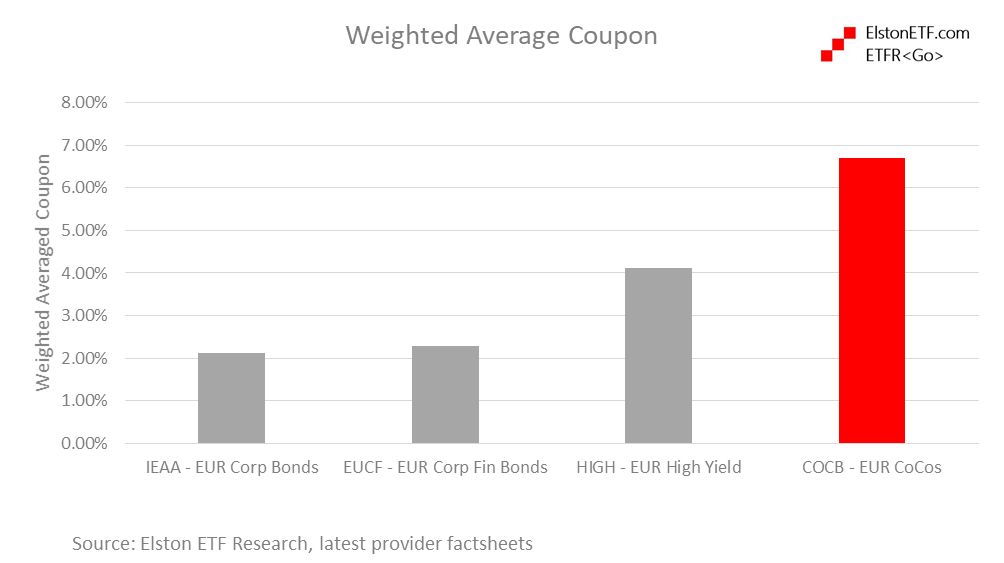 Fig.3. Credit Profile 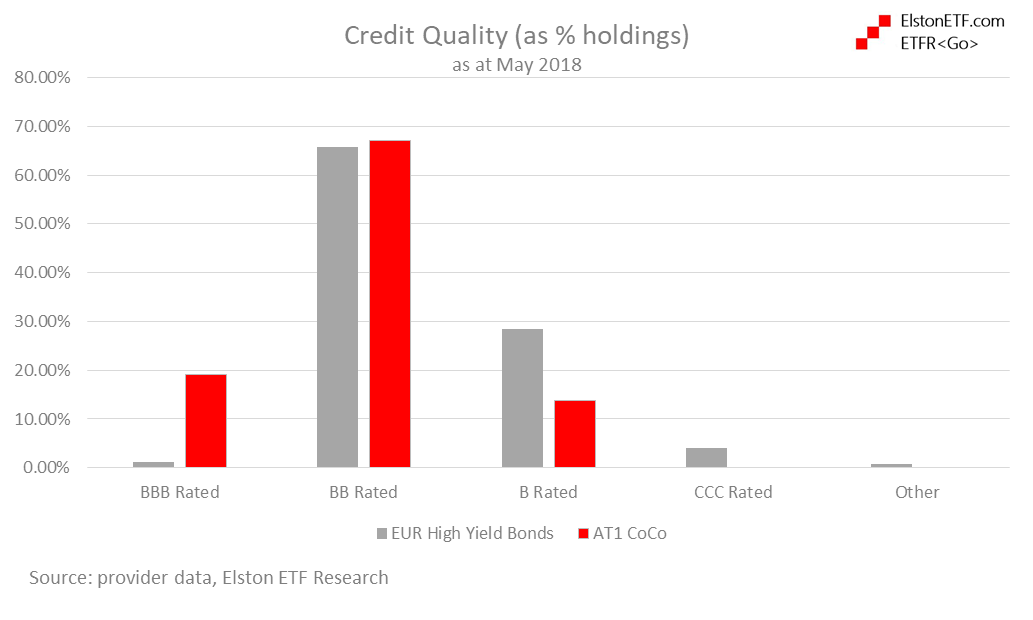 Furthermore, in terms of counterparty risk, CoCos are only issued by large banks that are well regulated with high capital ratios. How about performance? CoCos have outperformed EUR bonds and equities, both excluding and including Financials exposure. Fig.4. Total Returns 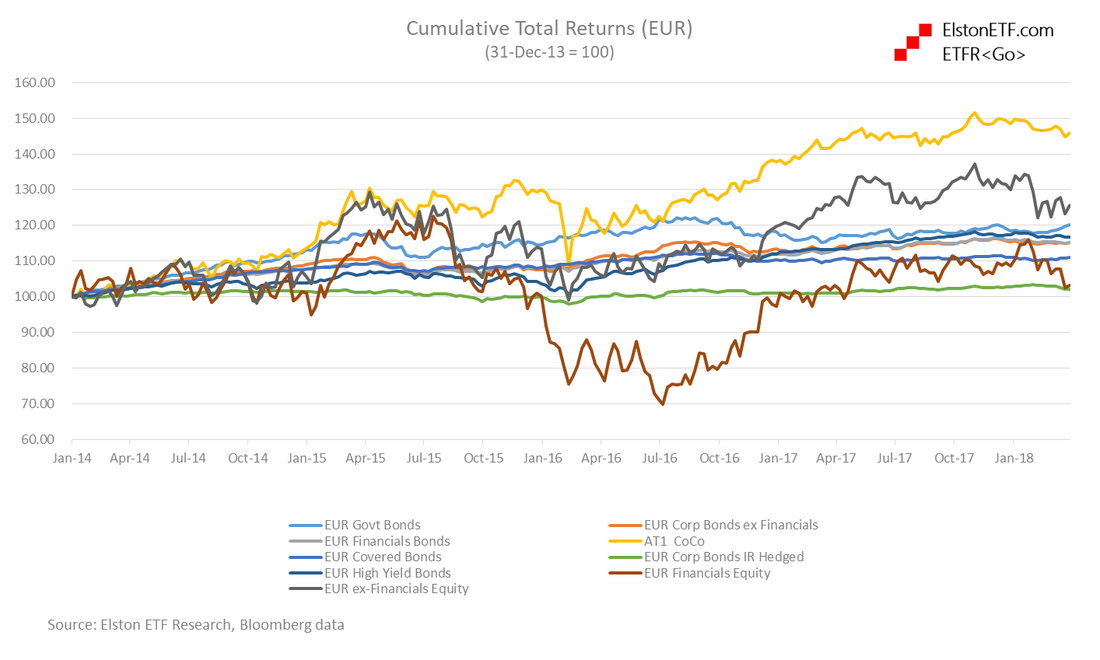 CoCos are positioned between equities and bonds in respect of realised volatility, but with better risk-adjusted returns. Fig.5. Risk-Return 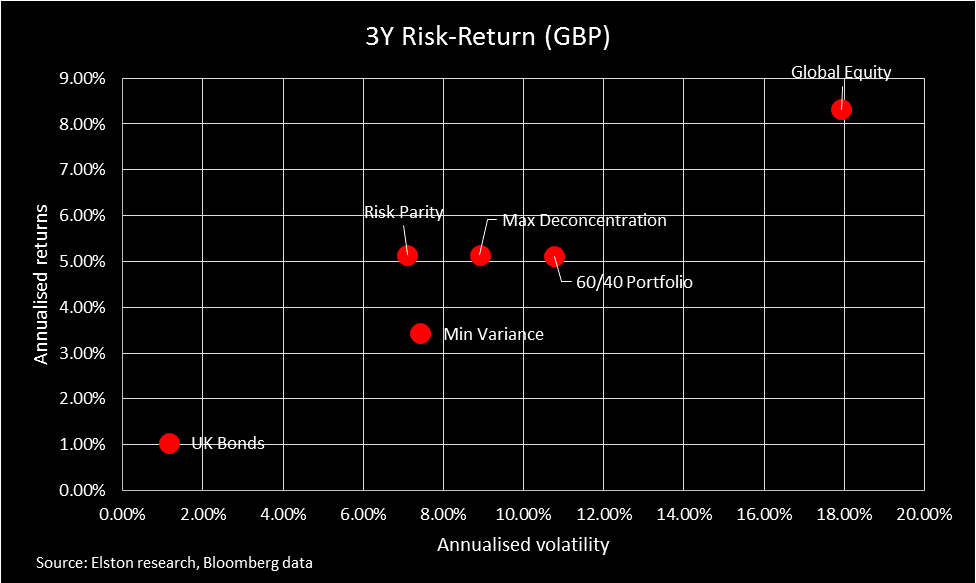 In summary, CoCos have offered solid risk-adjusted returns (Sharpe Ratio), and have a low correlation to bonds from a diversification perspective and a higher income with better credit quality relative to traditional high yield bonds.
 Following our initiation of overage of the UK Equity Income Index/ETF universe (data to 4q17), we have updated the data for 1q18 performance update for selected indices.
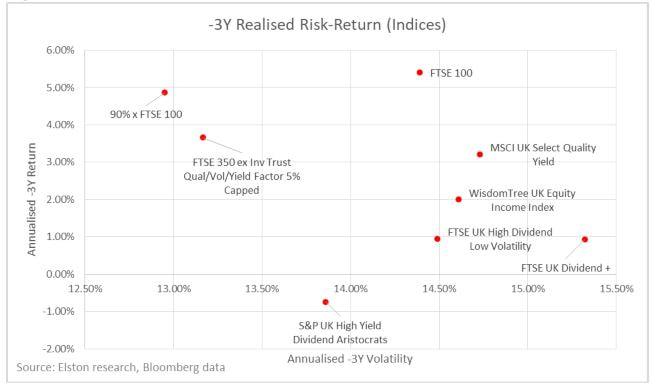
Returns For 1q18, the most defensive UK Equity Income index was the MSCI UK Select Quality Yield, tracked by ZILK, at -5.49% compared to -7.21% for the FTSE 100. On a 1Y basis, 90%xFTSE 100 returned +0.2% tracked by ZWUK, followed by -0.24% MSCI UK Select Quality Yield tracked by ZILK has performed best. On a 3Y basis our proxy benchmark for ZWUK, which takes 90%xFTSE100, returned +15.4%,, followed by +11.4% for FTSE 350 ex Inv Trust Qual/Vol/Yield Factor 5% Capped tracked by DOSH. Risk Adjusted On a 3Y basis, 90%xFTSE 100 as a proxy for the benchmark tracked by ZWUK, followed by FTSE 350 ex Inv Trust Qual/Vol/Yield Factor 5% Capped tracked by DOSH, have delivered best risk-adjusted returns. Correlation On a 3Y basis, the FTSE UK High Dividend Low Volatility Index tracked by UKHD offers most differentiated returns relative to the FTSE 100 (lowest beta and correlation). Gross Dividend Yield Over the last year WUKD has offered the highest historic dividend yield. View Report Learn about ETF Research Visit SEARCH ETF<Go> on the Bloomberg Terminal 
“Mutton dressed as lamb” is a derogatory old saying of something or someone that’s dressed up to look better than it is. In olden days, some dodgy butchers would dress mutton up to look like lamb to get a higher price. I’ve got nothing against mutton. It offers good value for money and does a nutritious job. But I don’t want to be given one thing when sold another. Some “active” funds that actually hug an index is another form of misrepresentation. And this month, the UK regulator got tough forcing a number of fund houses to pay £34m compensation to customers overcharged in closet index funds. As this is the first closet indexing fine of its kind internationally, it’s worth taking a closer look. What happened? The furore is around “closet indexing” where mutual funds charge active fees to deliver an investment style that pretty much tracks the index which it aims to outperform. When marketed as active, this is misrepresentation. Furthermore, closet index funds offer poor value for money compared to genuine index-tracking fund or ETFs for the same given exposure. What exactly is closet indexing? “Closet indexing” is a term first coined – in public at least – by academics Cremers & Petajisto in 2009. The study and metrics around “active share” and “closet indexing” caused a stir in the financial pages on both sides of the Atlantic as active managers started to watch the relentless rise of ETFs and other index-tracking products. In 2016, ESMA – the pan-European financial services regulatory coordinator – undertook a study whose findings were published in 2016, outlining the potential scale of the problem in Europe. In a Market Study published by the UK regulator in June 2017, the FCA put asset managers on notice that it would be investigating closet index funds as an area that offers poor value for money for customers and potential misrepresentation. In March, the UK regulator struck after sampling funds from 19 UK asset management firms. Of the 84 suspected closet index funds reviewed, the FCA required changes to the descriptions of 60 funds to ensure they were not misleading. Furthermore, an undisclosed number of unnamed firms managing an undisclosed number of funds were required to compensate their customers £34m: not for providing index-like returns, but for saying one thing and doing another. To be clear, the issue around closet index funds is not simply about fees. It’s as much about transparency and customer expectations. How can you define “closet indexing”? There has been some speculation as to what methodology the FCA used to deem funds a closet indexer. In this respect, ESMA’s 2016 paper may be informative. Their study applied a screen to focus on funds with 1) AUM over EUR50m, 2) an inception date prior to January 2005, 3) Fees of 0.65% or more, and 4) were not marketed as index funds. Having created this screen, ESMA ran three metrics to test for a fund’s proximity to an index: active share, tracking error and R-Squared. The Closet Index Metrics in summary Active share shows the percentage of the portfolio that does not coincide with index. Tracking Error shows volatility of difference in return fund and index. R-Squared represents the percentage of fund performance explained by index performance – a correlation measure. On this basis, a fund with low active share, low tracking error and high R-Squared means it is very similar to index-tracking fund. But what are the thresholds for each metric and how many funds are caught in the net? A trillion euro problem? ESMA sets out three thresholds – each increasingly stringent – by which closet indexing could be defined. These are set out in the table below: ESMA Closet Index Evaluation Thresholds Threshold/Tracking Error/% of European Active Funds/Est 2016 AUM Affected Active Share <60%/TE <4%/15%/€1,200bn Active Share <50%/TE <3%/7%/€560bn Active Share <50%/TE <3% & R2 >95%/5%/€400bn Source: ESMA, Elston Based on Morningstar data we estimate the European funds industry to be approximately €8tr in 2016, implying on our estimates €1.2tr could be defined (at its loosest definition) as closet indexing, with €400bn (at its tightest definition) coming under particular scrutiny. Where next for fund houses? Fund houses in the UK and Europe have some thinking to do. Are they offering building block components, or managing solutions? Our view remains that those offering solutions will prosper, whilst those offering building blocks risk commoditisation. Price pressure from index funds and ETFs has been present for a while, but so far traditional brands and distribution networks have proven resilient. But with the regulator now joining in to target closet indexers, the “big switch” for core exposures from actively managed funds to index-tracking funds is likely to accelerate, in our view. Embracing change Rather than embracing change, European asset managers that don’t currently offer ETFs have so far been hesitant to launch. They should get over it. Fund houses have embraced different fund wrappers which have over time: investment trusts (one of the earliest just celebrated its 150th anniversary), unit trusts, OEICs, SICAVs, ICVCs to name a few. ETFs are just a not-so-new tradable way of delivering a basket of securities to the investor. Technology changes. Purpose does not. So European asset managers should launch, not fear, ETFs. Or watch their American cousins eat an ever cheaper lunch. A winning formula Tomorrow’s winners in the European asset management space, in our view, are those firms that are: 1) close to asset owners; 2) can offer solutions as well as components; and 3) are part of the low-cost revolution, not victims of it. Fund houses that meet all three of these tests are in good shape. There are some big British behemoths that don’t yet meet those tests. Unless they act, they risk getting left behind. Indexing and proud Index investing is transforming the UK retail investment landscape. It is creating a Moore’s Law for the fund manufacturing. It’s time to get involved. Disclosure: I/we have no positions in any stocks mentioned, and no plans to initiate any positions within the next 72 hours. I wrote this article myself, and it expresses my own opinions. I am not receiving compensation for it. I have no business relationship with any company whose stock is mentioned in this article. Additional disclosure: This article has been written for a UK audience. Tickers are shown for corresponding and/or similar ETFs prefixed by the relevant exchange code, e.g. “NYSEARCA:” (NYSE Arca Exchange); “LON:” (London Stock Exchange). For research purposes/market commentary only, does not constitute an investment recommendation or advice, and should not be used or construed as an offer to sell, a solicitation of an offer to buy, or a recommendation for any product. This blog reflects the views of the author and does not necessarily reflect the views of Elston Consulting, its clients or affiliates. For information and disclaimers, please see www.elstonconsulting.co.uk Photo credit: as per specified source; Chart credit: as per specified source; Table credit: as per specified source. All product names, logos, and brands are property of their respective owners. All company, product and service names used in this website are for identification purposes only. Use of these names, logos, and brands does not imply endorsement.
UK Equity Income Indices Investors have a choice of UK Equity Income index strategies, each with different risk-return characteristics, weightings methodologies and factor tilts. These difference influence the performance of each index strategy (all figures below are on a total return basis for GBP investors). Best performing for 2017 The best performing strategies for UK Equity Income in 2017 were:
This compares to +12.3% for FTSE 100 (best tracked by HSBC FTSE 100 UCITS ETF (LON:HUKX)). Best performing over last 3 years The best performing strategies for UK Equity Income over the last 3 years were:
This compares to +31.5% cumulative return for FTSE 100 (best tracked by HSBC FTSE 100 UCITS ETF (LON:HUKX)). Fig. 1: Total Returns (Cumulative) by strategy/index (cumulative, GBP terms) 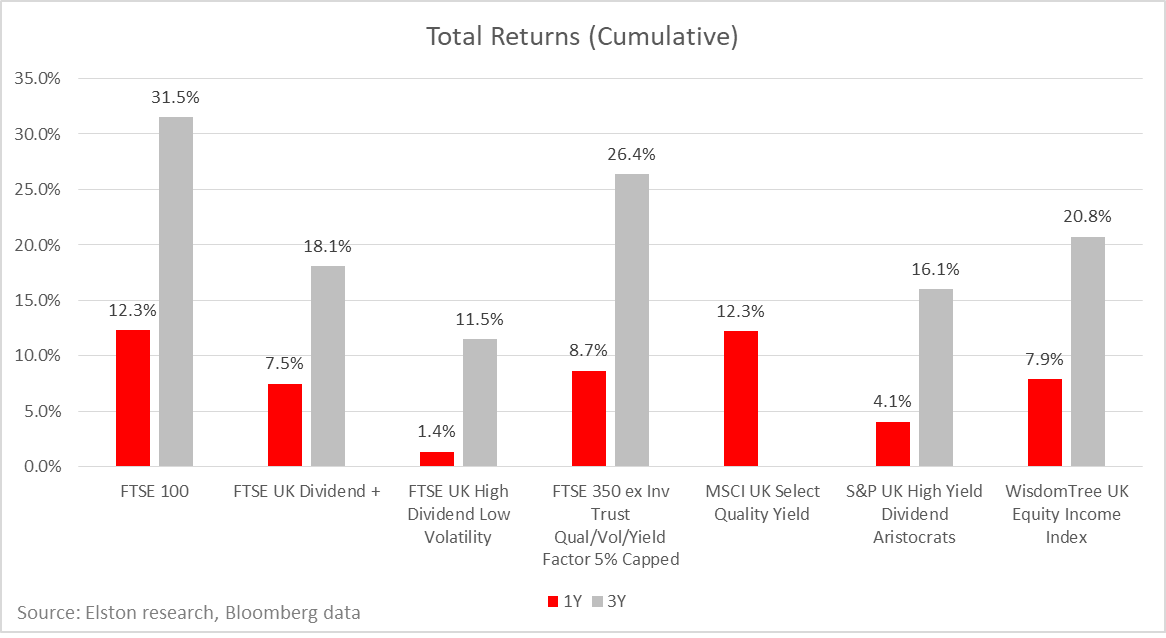 Best risk-adjusted returns The best risk-adjusted returns in 2017 of available UK Equity Income indices was achieved by:
To look at consistency of risk-adjusted returns, we have plotted 1Y Sharpe ratios vs 3Y Sharpe ratios for each UK Equity Income index strategy in Fig.2 below. Fig.2. 1Y & 3Y Sharpe Ratios, selected UK Equity Income index strategies (GBP terms) 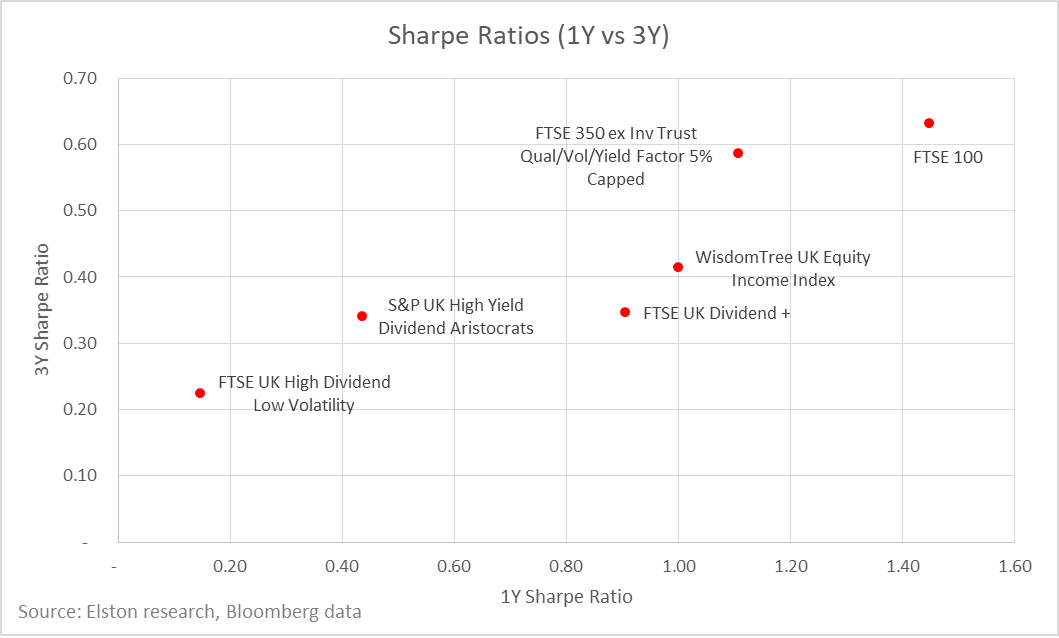 Conclusion Different index construction methodologies has a material impact on performance outcomes – both in absolute terms and on a risk-adjusted basis. A naïve interpretation is to consider performance in isolation, however our view is that index selection is more nuanced than that: it should relate to the objectives and constraints of individual client portfolios and the desired exposure - on asset-basis, risk-basis and factor-basis and the interaction between the selected strategy and the rest of a client portfolio. Note: Scope of our comparison For these reports, we have analysed the indices and ETFs detailed in Fig.3. Fig. 3: UK Equity Income Indices & ETFs vs HSBC FTSE 100 UCITS ETF (LON:HUKX) 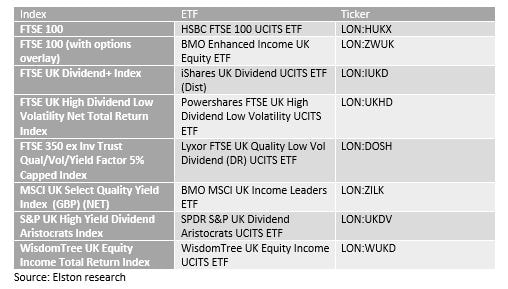 [ENDS]
NOTICES: I/we have no positions in any stocks mentioned, and no plans to initiate any positions within the next 72 hours. I wrote this article myself, and it expresses my own opinions. I am not receiving compensation for it. This article has been written for a US and UK audience. Tickers are shown for corresponding and/or similar ETFs prefixed by the relevant exchange code, e.g. “NYSEARCA:” (NYSE Arca Exchange) for US readers; “LON:” (London Stock Exchange) for UK readers. For research purposes/market commentary only, does not constitute an investment recommendation or advice, and should not be used or construed as an offer to sell, a solicitation of an offer to buy, or a recommendation for any product. This blog reflects the views of the author and does not necessarily reflect the views of Elston Consulting, its clients or affiliates. For information and disclaimers, please see www.elstonconsulting.co.uk Photo credit: N/A; Chart credit: Elston Consulting; Table credit: Elston Consulting All product names, logos, and brands are property of their respective owners. All company, product and service names used in this website are for identification purposes only. Use of these names, logos, and brands does not imply endorsement. Chart data is as at 30-Dec-17 |
ELSTON RESEARCHinsights inform solutions Categories
All
Archives
April 2024
|
 RSS Feed
Company |
Solutions |
|