
Focus on market cap indices is a choice, not an obligation A market cap weighted approach has well known drawbacks: it biases larger companies, regardless of efficiency and is "procyclical" - buying larger amounts of more expensively valued companies. This is a critique of "passive investing". We don't believe there's such a thing as passive investing. There is index investing and non-index investing. There is subjective investing and systematic investing. Choice of index, choice of methodology, choice of asset allocation are all active decisions. Index investing simply delivers the desired investment approach in a way that is efficient, transparent and cheap. Factor-based indices The arrival of factor-based indices, means that for a required World Equity exposure, we can select which factors we want exposure to: for example, Size, Momentum, Quality, Value or Minimum Volatility. The different factors can be summarised as follows:
How have these different factors fared? Ranking the 1Y performance of these factors in 2017: Momentum factor delivered the highest total return at +20.6%, followed by Size factor at +13.1%, followed by Quality factor at +12.5%, followed by Value factor at +11.5%, and finally Min Volatility at +7.1%. This compares to +13.2% for the traditional cap-weighted approach. Fig 1. Equity Factor 1Y Realised Risk-Return 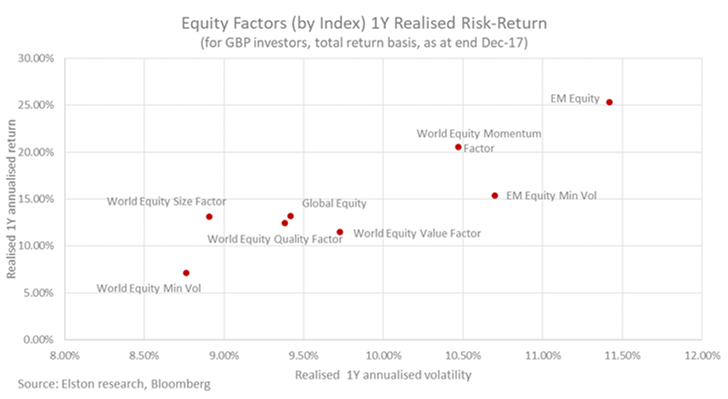 On a 3Y basis, the annualised returns of Momentum come in at +18.2%, followed by Size at +15.7%, followed by Quality at +15.2%. This compares to +14.6% for the traditional cap-weighted approach. Fig 2. Equity Factor 3Y Realised Risk-Return 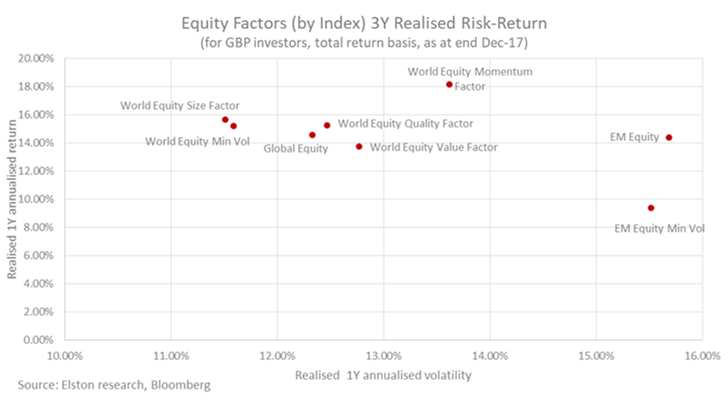 Risk-Adjusted Returns Ranking the 1Y risk adjusted performance by Sharpe Ratio: Momentum leads at 1.94, followed by Size at 1.44, followed by Quality at 1.30. This compares to 1.37 for the traditional cap-weighted approach. On a 3Y basis, Size leads at 1.33, followed by Momentum at 1.30, followed by Quality at 1.19. This compares to 1.15 for the traditional cap-weighted approach. In Fig 3. we plot the 1Y and 3Y Sharpe ratio for each World Equity factor relative to traditional cap-weighted Global and EM Equity indices, to compare the risk-adjusted returns of different factor exposures over different time frames. Fig 3. Equity Factor Sharpe Ratios 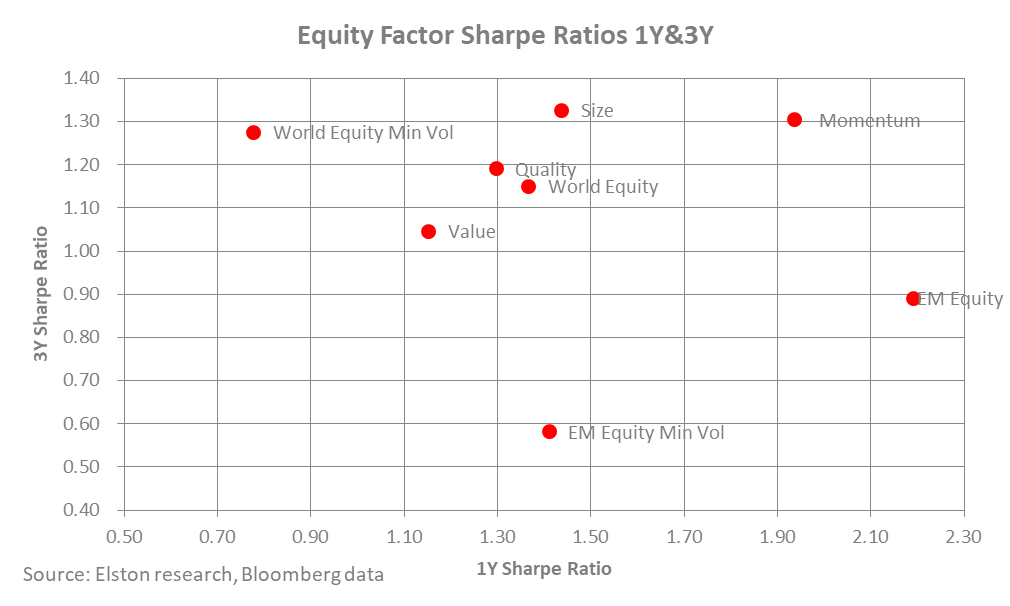 Conclusion: a differentiated approach
We are not suggesting that one factor approach is inherently superior to another. But with a broader array of factor exposures readily accessible to decision-makers to match with their portfolio requirements, there's no longer need to complain about the limitations of cap-weighted indices. NOTICES: I/we have no positions in any stocks mentioned, and no plans to initiate any positions within the next 72 hours. I wrote this article myself, and it expresses my own opinions. I am not receiving compensation for it. This article has been written for a US and UK audience. Tickers are shown for corresponding and/or similar ETFs prefixed by the relevant exchange code, e.g. “NYSEARCA:” (NYSE Arca Exchange) for US readers; “LON:” (London Stock Exchange) for UK readers. For research purposes/market commentary only, does not constitute an investment recommendation or advice, and should not be used or construed as an offer to sell, a solicitation of an offer to buy, or a recommendation for any product. This blog reflects the views of the author and does not necessarily reflect the views of Elston Consulting, its clients or affiliates. For information and disclaimers, please see www.elstonconsulting.co.uk Photo credit: N/A; Chart credit: Elston Consulting; Table credit: Elston Consulting All product names, logos, and brands are property of their respective owners. All company, product and service names used in this website are for identification purposes only. Use of these names, logos, and brands does not imply endorsement. Chart data is as at 30-Dec-17
UK Equity Income ETF Choices Investors have a choice of UK Equity Income index strategies, each with different risk-return characteristics, weightings methodologies and factor tilts. Portfolio managers and advisers considering a UK Equity Income ETF should understand the differences of each to inform their selection process. In the first of a series of studies of this key sector, we have done a sector analysis of London-listed UK Equity Income ETFs, to understand their inherent characteristics relative to the UK main equity index, the FTSE 100. For these studies, we have analysed the indices and ETFs detailed in Fig.1. Fig. 1: UK Equity Income Indices & ETFs vs HSBC FTSE 100 UCITS ETF (LON:HUKX) 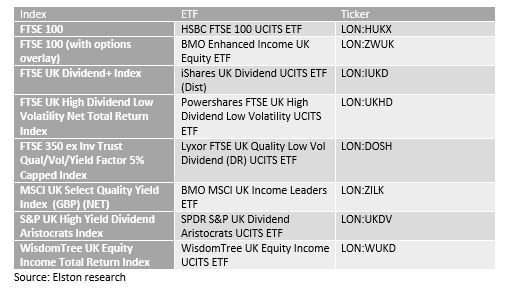 Methodology impact on sector allocation The result of the application of various index methodologies to the UK equities opportunity set materially impacts the sector exposures of available Equity Income ETFs. In some cases, sector caps form part of the index rules. In other cases they do not. For example, the FTSE100’s bias to Energy and Financials is well documented. For some Equity Income strategies, such biases are mitigated or even eliminated. Selecting the right Equity Income ETF for the business cycle For investors that focus on the business cycle, we have analysed the available UK Equity Income ETFs by GICS sectors, and classified those GICS sectors into two broad groups – Cyclicals and Defensives. This enables us to rank UK Equity Income ETFs by their exposure to the business cycle. On this basis, investors wanting access to UK Equity Income with a Cyclical bias (coloured red in Fig.2. below), should consider (in order) LON:WUKD, LON:IUKD, and LON:HUKX. Conversely, investors wanting access to UK Equity Income with a Defensive bias (coloured grey in Fig.2. below), should consider (in order) LON:DOSH, LON:UKDV and LON:ZILK. Fig. 2: UK Equity Income ETFs by Sector Allocation vs HSBC FTSE 100 UCITS ETF (LON:HUKX) 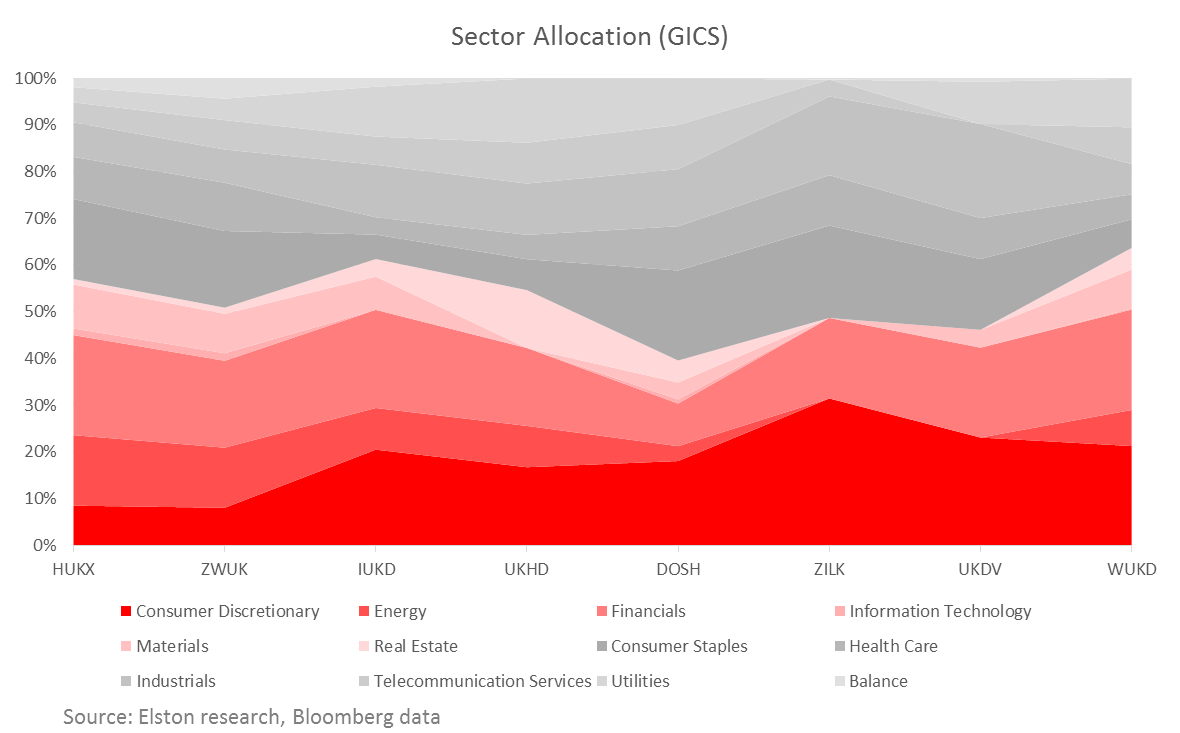 Conclusion
There is more to UK Equity Income than yield alone, by understanding the look-through sector exposures of the available UK Equity Income ETFs, investors can make more informed decisions as regards ETF selection that is consistent with their preferences, and client needs. NOTICES I/we have no positions in any stocks mentioned, and no plans to initiate any positions within the next 72 hours. I wrote this article myself, and it expresses my own opinions. I am not receiving compensation for it. This article has been written for a US and UK audience. Tickers are shown for corresponding and/or similar ETFs prefixed by the relevant exchange code, e.g. “NYSEARCA:” (NYSE Arca Exchange) for US readers; “LON:” (London Stock Exchange) for UK readers. For research purposes/market commentary only, does not constitute an investment recommendation or advice, and should not be used or construed as an offer to sell, a solicitation of an offer to buy, or a recommendation for any product. This blog reflects the views of the author and does not necessarily reflect the views of Elston Consulting, its clients or affiliates. For information and disclaimers, please see www.elstonconsulting.co.uk Photo credit: N/A; Chart credit: Elston Consulting; Table credit: Elston Consulting All product names, logos, and brands are property of their respective owners. All company, product and service names used in this website are for identification purposes only. Use of these names, logos, and brands does not imply endorsement. Chart data is as at 30-Nov-17  Whilst advisers and investments are comfortable and familiar with the simple term “funds” (has anyone heard of an “CIS (Collective Investment Scheme) Conference” or being an “AUT (Authorised Unit Trust) investor”? There is much less familiarity with the once-institutional and now pervasive ETFs (Exchange Trade Funds). That lack of familiarity means that for some reason that particular TLA has stuck.
Claer Barrett in FT Weekend’s FT Money section tries to demystify the jargon – but ends up makes thing sound more complicated than they need to be. Advisers wanting to check or brush up on the difference between an ETP, ETF, ETN and ETC could do well to invest 2 hours of their time to earn accredited CPD (Continuous Professional Development) from the roadshow being run by Copia Capital Management to get a solid understanding of this increasingly popular and pervasive investment vehicle. As for civilians – customers and investors – it's actually quite simple. It’s about money. Client money. And how it gets put to work. So forget the TLAs and the alphabet soup of ET-this and ET-that. The key question to ask managers is “What are you doing for your fee, and how do I get to keep the most of my available return?” The investment management industry is waking up to the fact that its customers deserve more English-language dialogue, and fewer abbreviations. QED. NOTICES: I/we have no positions in any stocks mentioned, and no plans to initiate any positions within the next 72 hours. I wrote this article myself, and it expresses my own opinions. I am not receiving compensation for it. This article has been written for a US and UK audience. Tickers are shown for corresponding and/or similar ETFs prefixed by the relevant exchange code, e.g. “NYSEARCA:” (NYSE Arca Exchange) for US readers; “LON:” (London Stock Exchange) for UK readers. For research purposes/market commentary only, does not constitute an investment recommendation or advice, and should not be used or construed as an offer to sell, a solicitation of an offer to buy, or a recommendation for any product. This blog reflects the views of the author and does not necessarily reflect the views of Elston Consulting, its clients or affiliates. For information and disclaimers, please see www.elstonconsulting.co.uk Photo credit: squarespace,com; Chart credit: N/A; Table credit: N/A 
Smart beta strategies are “smart” because they take a scientific, quantitative and objective approach to investing by combining a range of index-tracking ETFs with different market risk or “beta” exposures. In contrast to the opacity of hedge funds, dynamic allocation “smart beta” investment strategies should do what they say on the tin. Elston runs a number of diversified multi-asset investment strategies, two of which have been offered as indices for asset owners and investment managers to benchmark against or track. Chart 1: Risk and Return 2016 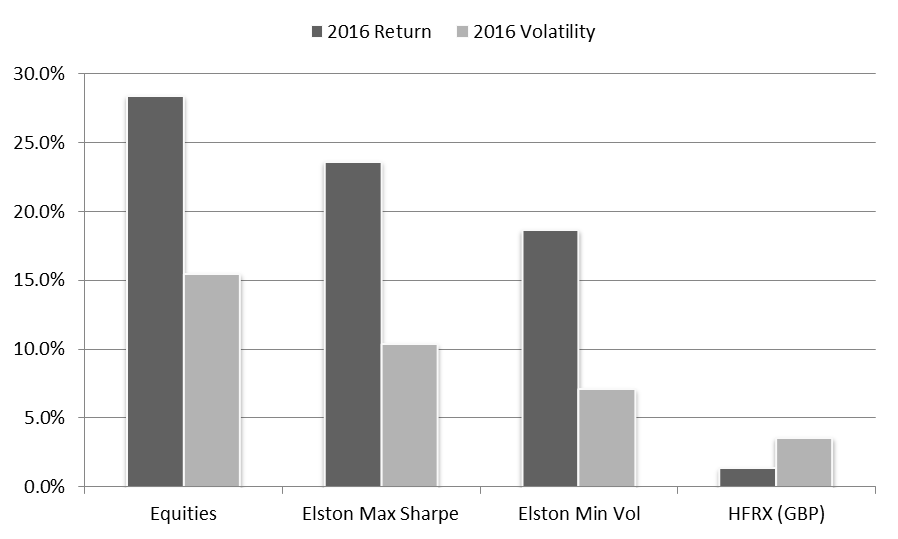 Source: Elston, Bloomberg, all in GBP Looking at outcomes Our multi-asset Global Max Sharpe index (Bloomberg: ESBGMS) did what it said on the tin delivering a Sharpe ratio (our primary measure of success for this strategy) of 2.06 for 2016, compared to 1.94 for Equities, 1.90 for Bonds and 1.45 for Commodities. On a returns basis (our secondary measure of success) the strategy returned 23.58% for the year, compared to 28.35% for equities, but with volatility of 10.35% compared to 15.45% for equities. Put differently, the strategy captured 83% of equity returns with just 67% of equity risk. Chart 2: Elston Multi-Asset Max Sharpe (ESBGMS) 2016 Outcome 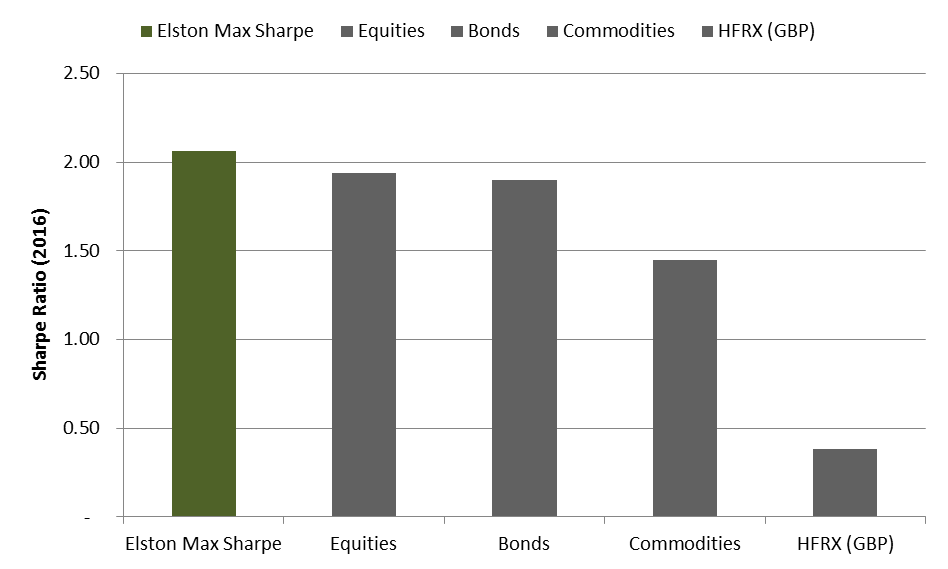 Source: Elston, Bloomberg, all in GBP Our multi-asset Global Min Volatility index (Bloomberg: ESBGMV) also did what it said on the tin whilst maintaining exposure to a broad set of return-seeking asset classes. The realised volatility (our primary measure of success for this strategy) for 2016 was 7.08%, compared to 15.45% for equities, 13.64% for bonds and 25.28% for commodities. Our dynamic asset allocation approach minimised portfolio variance whilst harvesting returns. On a returns basis (our secondary measure of success), the strategy returned 18.62% for the year, compared to 28.35% for equities, but with volatility of 7.08% compared to 15.45% for equities. Put differently, the strategy captured 66% of equity returns with just 46% of equity risk. Chart 3: Elston Multi-Asset Min Volatility (ESBGMV) 2016 Outcome 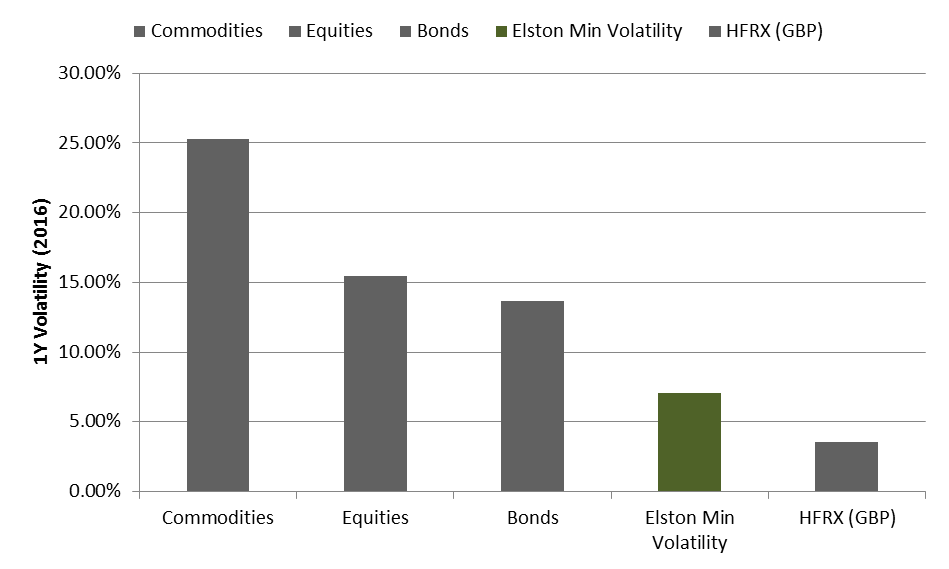 Source: Elston, Bloomberg, all in GBP Theory and practice Our strategies constituent parts are ETFs representing a broad range of asset classes and geographies. The Sharpe of our Global Max Sharpe strategy’s whole is greater than the sum of its constituent parts. The Volatility of our Global Min Volatility strategy’s whole is less than the sum of its constituent parts. And that’s the intention. A low cost more consistent alternative to hedge funds? Hedge funds were popular because they provided differentiated returns and mitigated risk. In 2016, Hedge Funds returned 1.35% with volatility of 3.56%. Put differently, on average they captured just 5% equity returns, despite taking on 23% of equity risk. We plot out equity return capture (return relative to global equity return) and risk outlay (volatility relative to global equity volatility) for the main asset classes, our strategies and HFRX (all in GBP) in the summary matrix below. Chart 4: 2016 Return Capture vs Risk Outlay 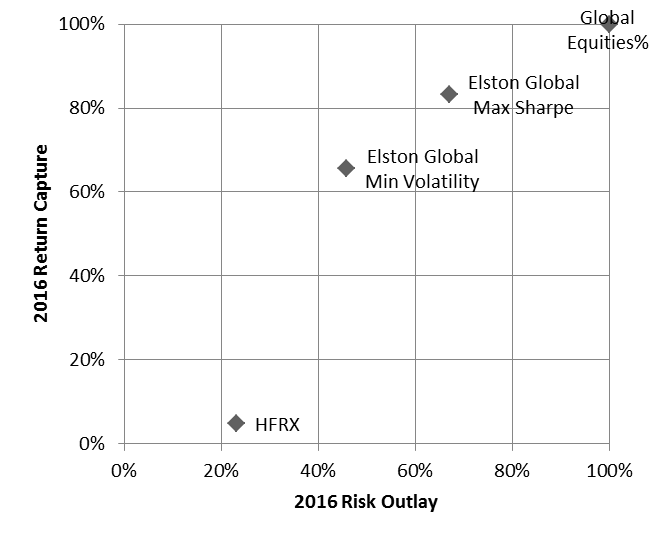 Source: Elston, Bloomberg
The problem with many hedge funds is that they are not doing what they say on the tin. They aim to provide diversified differentiated returns – but their process, statistically, amounts to trial and error, fraught with subjective bias. We seek to achieve similar outcomes, but using a clinically quantitative approach. To paraphrase a famous composer: “At the end of the day, it’s just maths.” What next? The Elston Strategic Beta multi-asset indexes were launched in December 2014. They are priced daily with index values available for free, factsheets are published daily. Our research strategies and indices are available for licensing. 
Big dreams The cuddly caption announcing the move says “Smaller Fees means Bigger Dreams”, which is warm-hearted. But it’s also sort of fair. Today’s retail investor has more access to breadth and depth of international markets than our parents ever dreamed of (if they ever dreamed of that sort of thing). What does this mean, apart from being cheaper? Well firstly, Moore’s law applies to ETF pricing & capacity as much as it does to semiconductors. That’s not new or surprising. But the sustained deflationary pressure on fund fees is forcing the convergence of institutional and retail investment offers. This will create pressures on asset managers that do not adapt. Adapt to what? The quest for elusive alpha from security selection looks like the right way of solving the wrong puzzle. The puzzle to solve is how to design asset allocation strategies to help investors achieve their desired or required outcome. Put differently, investment houses need to offer solutions (or “dreams”?), not products (“funds, OEICs, ETFs”). Who are the winners? Market access has basically become commoditised, so the only value in the value chain is in distribution (having customers), and solution design (giving them what they want). Asset managers and financial adviser that embrace this new reality should flourish. Those that linger on in yesteryear’s product based world will gradually lose momentum. NOTICES: I/we have no positions in any stocks mentioned, and no plans to initiate any positions within the next 72 hours. I wrote this article myself, and it expresses my own opinions. I am not receiving compensation for it. This article has been written for a US and UK audience. Tickers are shown for corresponding and/or similar ETFs prefixed by the relevant exchange code, e.g. “NYSEARCA:” (NYSE Arca Exchange) for US readers; “LON:” (London Stock Exchange) for UK readers. For research purposes/market commentary only, does not constitute an investment recommendation or advice, and should not be used or construed as an offer to sell, a solicitation of an offer to buy, or a recommendation for any product. For more information see www.elstonconsulting.co.uk Photo credit: coinquest.com Chart & Table credit: N/A
Post-Brexit fears around commercial property values has led to managers of three UK property funds locking investors in. They fear a potential rush of investors to sell units following the Brexit result in the EU Referendum. Decisions to suspend will typically reviewed every 28 days. The funds affected are those managed by Standard Life, Aviva and M&G, totalling some £9bn of assets (see table). While the justification given – to “protect the interests of all investors in the fund” – is fair and reasonable, some investors may not be too happy to be locked in for potentially quite a scary ride. The paternalistic reading is that investors are being protected from themselves, as they are denied the temptation to panic sell. Funds that locked in investors in 2008 eventually “came good”. But while investors may agree that “buy and hold” is right for the long run, that’s not the same deal as “buy and be held prisoner at the manager’s will”. This episode shines a much needed spotlight on the opacity around the underlying liquidity within funds that trade in less liquid assets. As always, investment funds are only as liquid as their underlying holdings. One of the main reasons advisers give for using funds over ETFs is that daily liquidity is not necessarily important as their investors take a long-term view. This does however deny the opportunity to make tactical adjustments to changing economic circumstances, particularly event-driven ones such as the UK referendum. What this episode illustrates that by contrast to funds, ETFs benefit from better internal liquidity (they typically invest only in liquid securities), from better daily external liquidity (as they are both OTC and exchange-traded), and from active liquidity management (the creation and redemption of units through capital markets activity by the issuer). For UK investors whose property exposure was through ETFs which such as iShares UK Property UCITS ETF (LSE:IUKP) which tracks the FTSE EPRA/NAREIT UK Property Index, the flexibility remains whether to adjust exposure or to the ride this out. And for portfolio management, flexibility counts. In terms of underlying exposure, Property ETFs and Property Funds are similar but different. Whereas property funds may have direct exposure to commercial or residential property, property ETFs typically own shares in listed real estate companies. As Property ETFs are by nature “equity only”, they can be expected to have higher volatility than property funds that which have exposure to bond-like steady streams of net rental income from less liquid direct holdings. So if risk is defined by standard deviation, it is clearly higher for a property ETF. If risk is defined by liquidity, it is clearly higher for a fund. Aside from volatility, the level of yield from property ETFs relative to funds is comparable, while the overall fee level is of course much lower. Table: Fee Comparison 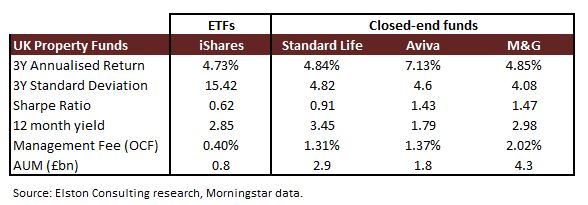 For investors seeking exposure to UK property as an asset class, then exchange-traded liquid ETFs that provide that from a portfolio construction perspective. But importantly, property ETFs won’t share the underlying liquidity risk that is (now) all too apparent.
NOTE Funds compared are iShares UK Property UCITS ETF (GBP), Standard Life Investments UK Real Estate Fund Retail Acc, Aviva Investors Property Trust 1 GBP Acc, M&G Feeder of Property Portfolio Sterling A Acc. Returns data as of 5th July 2016 (except M&G as of 4th July 2016). Standard deviationfigures as of 30th June 2016 for all funds. NOTICES: I/we have no positions in any stocks mentioned, and no plans to initiate any positions within the next 72 hours. I wrote this article myself, and it expresses my own opinions. I am not receiving compensation for it. This article has been written for a US and UK audience. Tickers are shown for corresponding and/or similar ETFs prefixed by the relevant exchange code, e.g. “NYSEARCA:” (NYSE Arca Exchange) for US readers; “LON:” (London Stock Exchange) for UK readers. For research purposes/market commentary only, does not constitute an investment recommendation or advice, and should not be used or construed as an offer to sell, a solicitation of an offer to buy, or a recommendation for any product. For more information see www.elstonconsulting.co.uk Photo credit: pictogram-free.com. Table credit: Elston Consulting 
A panel session at the Inside ETFs Europe 2016 Conference examined the renewed interest in Liquid Alternatives. This article draws out and expands on some of the key findings from the panel discussion of the same title. The role of alternatives in portfolio construction The role of “alternative” asset classes in portfolio construction has traditionally been to provide differentiated asset returns that reduce overall portfolio volatility through diversification. Alternative asset classes can be broadly defined as non-equity and non-bonds, so typically includes hedge funds, property, commodities, infrastructure and private equity, and subsets of those groups. Lessons from the global financial crisis This classic Markowitz-style portfolio construction approach, based on single period mean variance optimised models was severely challenged in the global financial crisis, when diversification failed to protect assets in the short run (correlations trended to one), and risk-return opportunities became more binary (risk-on/risk-off). Assumptions challenged More specifically, some key assumptions on correlation, liquidity and time horizons that underpin portfolio construction theory required closer scrutiny. Firstly, correlations are unstable, particularly over shorter time horizons. This means that while a static approach to a diversified asset allocation may be adequate in the long run for the long run, in the short run diversification can fail to provide any protection to a portfolio. Hence the need for a tactical asset allocation approach that is dynamic. Dynamic means adapting to the fact that correlations between asset classes are different in the short run to how they are in the long run, and remain in constant flux. It’s therefore important to understand the role and correlation of alternatives to other asset classes across a time horizon that is relevant to an investor, as not all (in fact very few) investors are endowments with infinite time horizons. Secondly, liquidity matters, and matters more when needed most. While portfolio theory assumes perfect liquidity to move between asset classes, the relevance of liquidity became all too apparent in the financial crisis both from a timing perspective and a counterparty perspective. From a timing perspective, the gating of investors in certain hedge funds, and the relevance of redemption notice periods – whether daily, monthly, quarterly or annually – became all too relevant. From a counterparty perspective, solvency, capital structure and legal title became a primary concern. Finally, time horizon matters. For investors with a long-run time horizon who had no need to access capital and could weather extreme market volatility, there was sufficient risk budget not to worry about near-term correlations and liquidity constraints. But for those that needed to access capital in the near to medium term, or wished to dial-down their exposure to all risk assets in the face of potential market dislocation, these factors could not matter more. Industry response Once the dust settled, the industry response to client concerns was to consider how to offer alternative strategies (for the same diversification reasons as before), but with some hard lessons learned. Strategies had to be sufficiently flexible to be adaptive to changing market circumstances, and sufficiently liquid to be bought and sold on a daily basis. “Liquid alternatives” therefore became a buzzword for strategies that can 1) from a portfolio construction perspective, provide uncorrelated returns to traditional asset classes; and 2) from a portfolio implementation perspective, provide daily liquidity. Put differently, liquid alternatives are products that enable investors to trade “anything other than conventional beta”, according to Jean-René Giraud, CEO of Trackinsight, a European ETF research provider that is part of Koris International. Liquid Alts – delivered as mutual funds The growth in “liquid alt” was focused initially in the US mutual fund space (and were sometimes known as 40 Act funds as they were governed by the US Investment Company Act of 1940). The nature of investment strategies offered was therefore governed by what was permissible under the 1940 legislation – for example the requirement to offer daily liquidity, and to calculate a daily NAV. However, this also meant constraints around concentration, excessive leverage and short-selling. While these constraints were more restrictive than private/non-registered hedge funds, this sub-optimality was considered outweighed by investor demand for daily liquidity. Following the financial crisis, there was explosive growth in liquid alt funds, as illustrated in Fig. 1, below: Figure 1: Growth in Liquid Alt Mutual Funds (US) 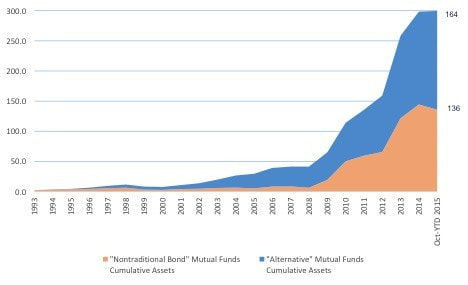 Note: The chart combines the Morningstar Alternative Mutual Funds and Morningstar Non-Traditional Bond Funds sectors to represent a Liquid Alt mutual fund sector.
Source: Spouting Rock, Morningstar Direct, as at 31st October 2015. Morningstar subdivides liquid alt funds into the following sub-sectors: Managed Futures, Long-Short Equity, Multi-Alternative, Market Neutral, Nontraditional Bond, Multicurrency, Bear Market. Managers of liquid alt funds ranged from specialist boutiques to retail versions of established hedge fund managers. Growth in AUM in liquid alt mutual funds has since tapered off possibly because the liquid alt exposure is becoming more readily available – to institutional and retail investors alike – through Exchange Traded Products (ETPs). Liquid Alts – delivered as ETPs The growth in Liquid Alts continues in the ETP space which has enabled rapid innovation in the breadth and depth of the range of strategies available. With TERs of 0.20% to 0.60% for ETPs, compared to TERs of approximately 2.00% for 40 Act funds, there is a compelling cost efficiency too. This is a key reason that institutional investors are looking at liquid alt ETPs as a lower cost alternative to hedge funds with a similar portfolio function, according to Jay Pelosky of J2ZAdvisory a New York-based global investment advisory firm. The number of liquid alt (including Smart Beta) index strategies available to fulfil the role of of providing differentiated returns to traditional asset classes is expanding rapidly on both sides of the pond:
While the range of products available is far greater in the US than in Europe at this stage there is potential for Europe to “leapfrog” and catch up in terms of innovation and development given the high level of research in alternative strategies from institutional investors, index providers and academia, according to Mr Giraud. Liquid Alts – delivered as Model Portfolios Retail investors are not limited to alternative mutual funds, or alternative ETPs. Liquid Alt strategies can be made available via managed accounts which are unconstrained by the parameters of the 1940 Act or individual ETP construction. One of the key enablers for this was the investment into platform technology by North American brokerages that made Model Portfolios readily manageable, according to Suzanne Alexander of Cougar Global Investments, a tactical ETF global investment strategist focusing on portfolio construction with downside risk management. So whether as an investment strategy in itself, or an alternative part of traditional strategy, liquid alternatives are helping to redefine portfolio construction. In this respect, Europe is lagging with platform providers slow to offer ETFs, let alone ETF Model Portfolios (“EMPs"), according to Giraud. UK Platforms – ETF Ready? In the UK, platform providers remain focused on mutual funds as a way of delivering investment allocation to clients, and the bulk of investment research is skewed to fund manager research, rather than ETF research. Novia Financial is one of the few platforms to offer not only traditional fund services, but is actively seeking to improve adviser access to ETFs, through technology upgrades. Platforms that are “ETF enabled” can provide advisers the tools, products, and cost structure they need to compete on like for like terms with robo-advisers which typically use ETF Portfolios, aggregated trading, and fractional dealing to deliver low-cost scalable investment solutions. With this technological parity, advisers can then differentiate themselves on the core services that robos can’t offer: financial planning/wealth structuring (typically more material than investment allocation), face to face support and a relationship based on trust. Broadening the portfolio construction toolkit Retail investors continue to seek ways to diversify their portfolios. Institutional investors are losing patience with Hedge Funds’ lack of “value for quality” evidenced by the material redemptions from hedge funds (some $14.3bn net outflows in 1q16 alone, according to Preqin). This means there is growing demand for liquid alts both from the top down and the bottom up, according to Pelosky. Funds formerly allocated to hedge funds will have to find a home, and a reinvigorated lower cost liquid alt ETP sector could be in the running to capture part of it. Notes: Participants in the panel discussion on this topic included: Henry Cobbe, Elston Consulting (moderator) Susanne Alexander, Cougar Global Investments Jean-René Giraud, Trackinsight Jay Pelosky, J2Z Advisory NOTICES: I/we have no positions in any stocks mentioned, and no plans to initiate any positions within the next 72 hours. I wrote this article myself, and it expresses my own opinions. I am not receiving compensation for it. This article has been written for a US and UK audience. Tickers are shown for corresponding and/or similar ETFs prefixed by the relevant exchange code, e.g. “NYSEARCA:” (NYSE Arca Exchange) for US readers; “LON:” (London Stock Exchange) for UK readers. For research purposes/market commentary only, does not constitute an investment recommendation or advice. For more information see www.elstonconsulting.co.uk Image credit: Elston Consulting. Chart credit: Spouting Rock 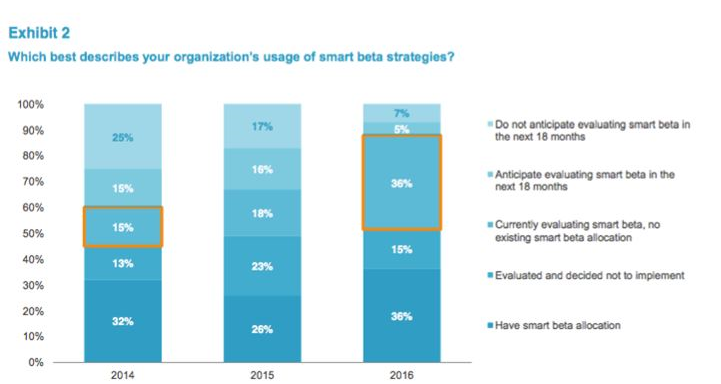
A survey published this week of 250 institutional asset owners with AUM in excess of USD2 trillion suggests that there is continued growth of interest in reviewing Smart Beta strategies. The survey is published by FTSE Russell and is available here. It suggests that 36% of institutional asset owners are currently evaluating smart beta, up from 15% in 2014. This implies the potential for large inflows into smart beta strategies over the coming 12-24 months. What is smart beta? From an index construction perspective, if beta is defined as index-based investment strategy constructed using a cap-weighted approach (size factor), smart beta can be defined as an index-based investment strategy using an alternatively weighted approach (any factor other than size). From a portfolio construction perspective, smart beta can be defined as an asset allocation strategy constructed using different optimisation techniques to combine a range of index-based investment strategies. What the factor? Risk and return can be broken down into many contributing factors. Analysing factors requires the ability to statistically distil, isolate, and observe a factor for significance. There are therefore potentially thousands of factors, depending on your ability to analyse them, which could include aside from the obvious (size and volatility), quality, momentum, value, liquidity, profits, dividend yield, leverage, etc which make up the components of earnings and/or the cost of capital which classically define a company’s value. The broadening and deepening of data availability and accelerating computing power is facilitating the growth in this quantitative approach. How do factors help? Buying the (cap-weighted) index for an asset-class (e.g. S&P 500 NYSEARCA:SPY, NYSEARCA:IVV (US); LON:CSPX (UK)) could be seen as a straightforward “passive” approach. Through a factor lense, however, it looks like a blind overweight of a size factor. Size factor may outperform in some market conditions and underperform in others. So while asset owners traditionally thought of asset allocation in terms of geographies and asset classes, they are starting to consider portfolio analysis and construction from a factor perspective. It’s no secret that sovereign wealth funds have been early adopters of smart beta investing: the transparency of a rules-based approach is additionally attractive. Is “smartie” the new “hedgie”? Like the original attraction of hedge fund, return enhancement and risk reduction are the primary motivations for reviewing Smart Beta strategies, according to the FTSE Russell report. Unlike hedge funds, cost savings are an attraction too. Sounds familiar? One of the original motivations for including hedge funds in a portfolio was for return enhancement and portfolio risk reduction through the inclusion of an uncorrelated asset. This ostensibly required exceptional skill, and hence exceptionally high fees. But the mantra supported the exponential growth in hedge funds from niche to mainstream from the early 2000s. Arguably, smart beta strategies can serve the same purpose from a portfolio construction perspective, but using a systematic rules-based approach that replaces manager risk (unpredictable, rarely consistent), with model risk (predictable, consistent). Combined with ego-free fees, it’s no wonder that there is so much interest in this investment approach. Flexible delivery? Furthermore, unlike hedge funds, smart beta strategies can be delivered to in-house managers, segregated accounts,– the equivalent of being able to “enjoy in your own home” – as well as ETPs and CITs (Collective Investment Trusts). Relative to hedge funds, this creates greater transparency about the counterparty risk you are taking. Has the switch started already? As if on cue, two stories on the same day this week illustrate the point. In the UK, some listed hedge funds are reported as losing two-thirds of their assets as performance disappoints and expensive alpha proves elusive. Separately, in the US there are reports of further M&A activity in the smart beta space with Hartford Funds, a $74bn asset manager acquiring Lattice Strategies, a San Francisco-based smart boutique with $215m AUM. This is the latest in a series of acquisitions by large asset managers of quantitative boutiques. What kind of smart beta equity strategies are available? Smart beta equity strategies for USA (NY-listed) and world markets (London-listed) include factor based strategies from BlackRock’s iShares® such as Quality (eg NYSEARCA:QUAL (US) & LON:IWQU (UK)), Value (eg NYSEARCA:VLUE (US) & LON:IWVL (UK)), Momentum (eg NYSEARCA:MTUM (US); LON:IWMO (UK)), and Size (eg NYSEARCA:SIZE (US); LON:IWSZ (UK)). What about multi-asset? Our approach has been to focus on risk-based portfolio construction which is why we launched our multi asset Global Max Sharpe Index (ticker ESBGMS) and multi-asset Global Min Volatility Index (ticker ESBGMV) back in December 2014. Our view is that smart beta is a new and powerful part of the portfolio construction toolkit. Conclusion We see smart beta as a diversifier for classically constructed portfolios and as a flexible tool for analysing and managing factor exposures at different stages of the market cycle. If the large institutional asset owners follow through their interest in smart beta with mandates, it will be an investment style that is impossible to ignore. NOTICES: I/we have no positions in any stocks mentioned, and no plans to initiate any positions within the next 72 hours. I wrote this article myself, and it expresses my own opinions. I am not receiving compensation for it. This article has been written for a US and UK audience. Tickers are shown for corresponding and/or similar ETFs prefixed by the relevant exchange code, e.g. “NYSEARCA:” (NYSE Arca Exchange) for US readers; “LON:” (London Stock Exchange) for UK readers. For research purposes/market commentary only, does not constitute an investment recommendation or advice. For more information see www.elstonconsulting.co.uk Image credit: FTSE Russell  "Asset allocation is not everything. It's the only thing."
One of the harshest lessons of the Global Financial Crisis was that when the going gets tough, correlations trend to one, giving even diversified investors very few places to hide. It wasn't about whether or not you got burned, it was a more a question of degree. While there's a time and a place for active stock selection, from a portfolio construction perspective, it's the active management of the overall asset allocation that affects the outcome. Using ETFs for portfolio construction The growing popularity in Exchange Traded Funds is in part because of their elegance in providing broad, liquid, efficient and cost-effective market access to most major asset classes with a single trade. We now have a broad range of building blocks with which to construct a diversified portfolio. As a result, the problem for investors has shifted from "How best can I access a broad choice of markets?", to "How do I create a portfolio that suits my needs?" How many ETFs are needed to create a portfolio? To create a portfolio with too few ETFs would mean there is limited scope to create different asset allocation strategies. To create a portfolio with too many ETFs introduces additional complexity, oversight requirements, and a higher degree of trading costs if the portfolio is to be regularly rebalanced. So what is the minimum number of ETFs needed to create a well-diversified portfolio? A Strategic Core For a strategic portfolio for a UK investor with £100,000 to invest and a desire to keep trading and ongoing costs to a minimum, we believe that advisers can construct strategic asset allocation models using the following “Magnificent Seven” broad asset classes alongside cash: UK Government Bonds, UK Corporate Bonds, Global Corporate Bonds, UK Property, UK Equities, Global Equities and Emerging Market Equities. All 7 of these asset classes can be accessed through BlackRock's iShares range, mostly from their cost-efficient Core range. Importantly, these ETFs are 'cash-based' or 'physical' meaning that they actually own the underlying holdings (unlike some ‘swap-based’ or ‘synthetic’ ETFs). Liquidity and diversification The fund sizes of these ETFs ranges from approx £400m to £4bn meaning external liquidity is high. Internal liquidity is as good as the underlying securities the ETF and index holds. While investors see only seven holdings, a portfolio containing these 7 large and liquid ETF building blocks represents a diversified portfolio of some 6,901 individual securities, all of which are fully disclosed for each fund. Strategic or Tactical After creating a strategic asset allocation model, ETFs mean that tactical asset allocation changes can be executed in real-time, which can give significant implementation advantage in these volatile times. As a starting point for advisers look to provide low-cost portfolio construction, using ETF building blocks for these key seven asset classes are a helpful first step. www.elstonconsulting.co.uk NOTICE This material is not intended to be relied upon as a forecast, research or investment advice, and is not a recommendation, offer or solicitation to buy or sell any securities or to adopt any investment strategy. The opinions expressed are as of date of publication and may change as subsequent conditions vary. The information and opinions contained in this post are derived from proprietary and nonproprietary sources deemed by Elston Consulting to be reliable, are not necessarily all-inclusive and are not guaranteed as to accuracy. As such, no warranty of accuracy or reliability is given and no responsibility arising in any other way for errors and omissions (including responsibility to any person by reason of negligence) is accepted by Elston Consulting, its officers, employees or agents. This post may contain “forward-looking” information that is not purely historical in nature. Such information may include, among other things, projections and forecasts. There is no guarantee that any forecasts made will come to pass. Reliance upon information in this post is at the sole discretion of the reader. ©2016 Elston Consulting Limited. All rights reserved. BirthStar, Elston Gamma, and Elston Strategic Beta are registered trademarks of Elston Consulting Limited. All other marks are the property of their respective owners. |
ELSTON RESEARCHinsights inform solutions Categories
All
Archives
April 2024
|
 RSS Feed
Company |
Solutions |
|