
Focus on market cap indices is a choice, not an obligation A market cap weighted approach has well known drawbacks: it biases larger companies, regardless of efficiency and is "procyclical" - buying larger amounts of more expensively valued companies. This is a critique of "passive investing". We don't believe there's such a thing as passive investing. There is index investing and non-index investing. There is subjective investing and systematic investing. Choice of index, choice of methodology, choice of asset allocation are all active decisions. Index investing simply delivers the desired investment approach in a way that is efficient, transparent and cheap. Factor-based indices The arrival of factor-based indices, means that for a required World Equity exposure, we can select which factors we want exposure to: for example, Size, Momentum, Quality, Value or Minimum Volatility. The different factors can be summarised as follows:
How have these different factors fared? Ranking the 1Y performance of these factors in 2017: Momentum factor delivered the highest total return at +20.6%, followed by Size factor at +13.1%, followed by Quality factor at +12.5%, followed by Value factor at +11.5%, and finally Min Volatility at +7.1%. This compares to +13.2% for the traditional cap-weighted approach. Fig 1. Equity Factor 1Y Realised Risk-Return 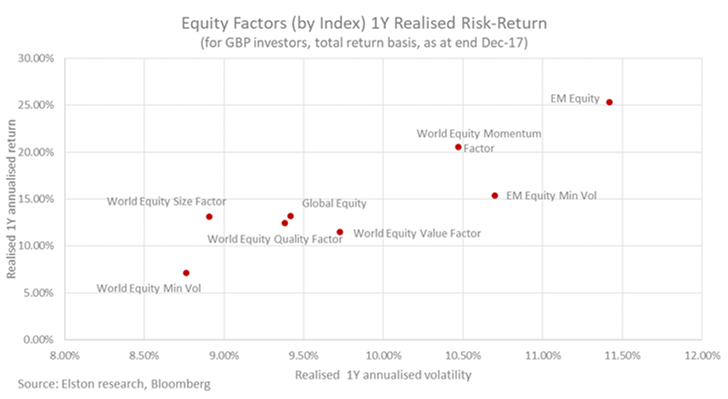 On a 3Y basis, the annualised returns of Momentum come in at +18.2%, followed by Size at +15.7%, followed by Quality at +15.2%. This compares to +14.6% for the traditional cap-weighted approach. Fig 2. Equity Factor 3Y Realised Risk-Return 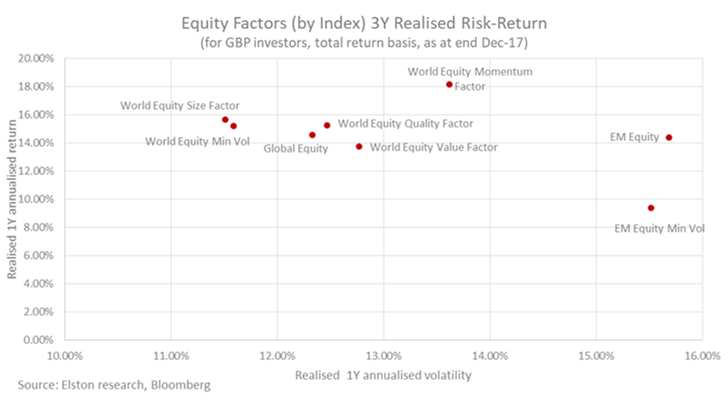 Risk-Adjusted Returns Ranking the 1Y risk adjusted performance by Sharpe Ratio: Momentum leads at 1.94, followed by Size at 1.44, followed by Quality at 1.30. This compares to 1.37 for the traditional cap-weighted approach. On a 3Y basis, Size leads at 1.33, followed by Momentum at 1.30, followed by Quality at 1.19. This compares to 1.15 for the traditional cap-weighted approach. In Fig 3. we plot the 1Y and 3Y Sharpe ratio for each World Equity factor relative to traditional cap-weighted Global and EM Equity indices, to compare the risk-adjusted returns of different factor exposures over different time frames. Fig 3. Equity Factor Sharpe Ratios 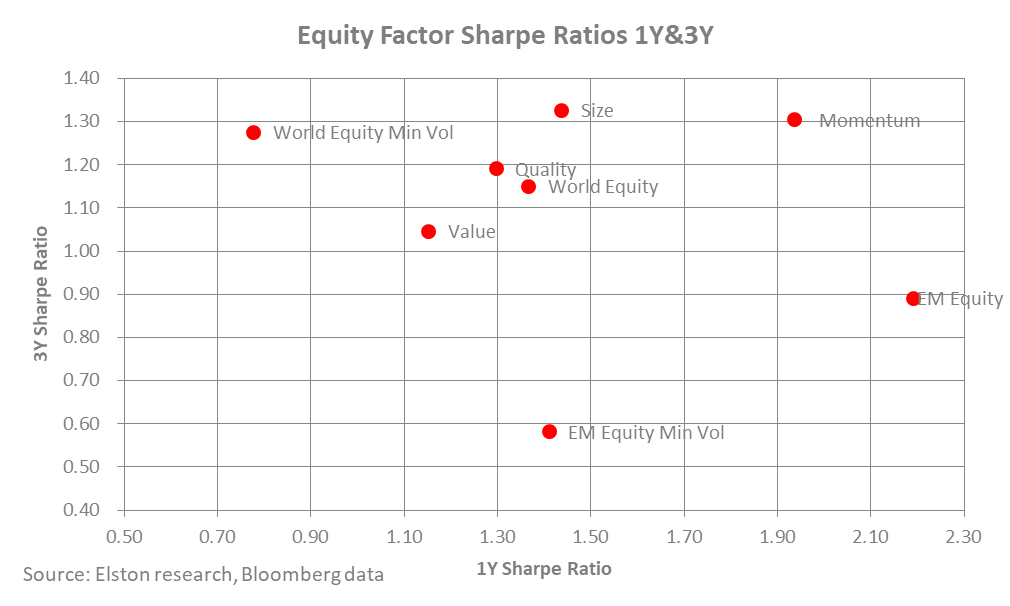 Conclusion: a differentiated approach
We are not suggesting that one factor approach is inherently superior to another. But with a broader array of factor exposures readily accessible to decision-makers to match with their portfolio requirements, there's no longer need to complain about the limitations of cap-weighted indices. NOTICES: I/we have no positions in any stocks mentioned, and no plans to initiate any positions within the next 72 hours. I wrote this article myself, and it expresses my own opinions. I am not receiving compensation for it. This article has been written for a US and UK audience. Tickers are shown for corresponding and/or similar ETFs prefixed by the relevant exchange code, e.g. “NYSEARCA:” (NYSE Arca Exchange) for US readers; “LON:” (London Stock Exchange) for UK readers. For research purposes/market commentary only, does not constitute an investment recommendation or advice, and should not be used or construed as an offer to sell, a solicitation of an offer to buy, or a recommendation for any product. This blog reflects the views of the author and does not necessarily reflect the views of Elston Consulting, its clients or affiliates. For information and disclaimers, please see www.elstonconsulting.co.uk Photo credit: N/A; Chart credit: Elston Consulting; Table credit: Elston Consulting All product names, logos, and brands are property of their respective owners. All company, product and service names used in this website are for identification purposes only. Use of these names, logos, and brands does not imply endorsement. Chart data is as at 30-Dec-17 Comments are closed.
|
ELSTON RESEARCHinsights inform solutions Categories
All
Archives
July 2024
|
 RSS Feed
Company |
Solutions |
|