
 Compared to traditional retail funds, ETFs offer transparency, liquidity and efficiency [7 min read, Open as pdf] In this series of articles, I look at some of the key topics explored in my book “How to Invest With Exchange Traded Funds” that also underpin the portfolio design work Elston does for discretionary managers and financial advisers. Indexes: the DNA of an ETF An Exchange Traded Fund is an index-tracking investment fund that aims to track (perform exactly in line) with the benchmark index in the fund’s name. The index defines an ETF’s “DNA”. An index is a collective measure of value for a defined group of securities, where criteria for inclusion and weighting within that group are defined by a systematic set of rules. Indices can represent a basket of equities like the FTSE 100 Index (the “Footsie”) or a basket of bonds like the FTSE Actuaries UK Conventional Gilts All Stocks Index (the “gilts” index). Indices can be used as benchmarks to represent the performance of an asset class or exposure. ETFs aim to track these benchmark indices by holding the same securities in the same weights as the index. Whilst ETFs can be an equity fund or bond fund (amongst others) with respect to its underlying holdings and the index it tracks, the shares in those ETFs trade on an exchange like an equity. This means ETFs combine the diversification advantages of a collective investment scheme, with the accessibility advantages of a share, all at a management fee that is substantially lower than traditional active funds. These features make ETFs easy to buy, easy to switch and easy to own, revolutionising the investment process as well as reducing investment costs. Indices enable transparency ETFs are regulated collective investment schemes (often UCITS[1] schemes) that can be traded on a recognised exchange, such as the London Stock Exchange. Whereas the manager of a traditional active fund aims to outperform an index such as the FTSE 100 by overweighting or underweighting particular securities within that index or holding non-index securities, an ETF aims to deliver the same returns as the index by holding within the fund the same securities as the index in the same proportion as the index. If the index represents a basket of securities weighted by their respective size, it is a “Capitalisation-weighted index”: this is the traditional index approach. If the index represents a basket of securities weighted by a criteria other than their respective size, it is an “Alternatively-weighted” index. For example, an equal weighted index means all the securities in an index are given an equal weight. [1] UCITS: Undertakings for Collective Investment in Transferable Securities (the European regulatory framework for retail investment funds) 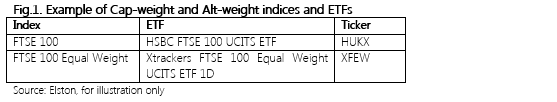 ETFs track indices, and indices have rules. Index rules are publicly available and set out how an index selects and weights securities and how frequently that process is refreshed. Indices therefore represent a range of investment ideas and strategies, but codified using a rules-based approach. This makes ETFs’ investment approach transparent, systematic and predictable, even if the performance of securities within the index is not. Furthermore, ETFs publish their full holdings every day so investors can be sure of what they own. This makes ETFs’ investment risks transparent. The investment risk-return profile of an ETF is directly link to the risk-return profile of the index that it tracks. Hence ETFs tracking emerging market equity indices are more volatile than those tracking developed market indices, which in turn are more volatile than those tracking shorter-duration bond indices. As with direct shares, traditional active mutual funds and index-tracking funds, when investing in ETFs, capital is at risk, hence the value of investments will vary and the initial investment amount is not guaranteed. ETFs vs traditional funds An ETF is different to other types of investment fund in the following ways:
The primary advantage of ETFs is the additional liquidity that a “secondary market” creates in the shares of that ETF (meaning the ability for investors to buy or sell existing shares of that ETF amongst themselves via a recognised exchange). However it is important to note that ultimately the liquidity of any ETF is only as good as its underlying assets. Traditional mutual funds can be traded once a day and investors transact with the fund issuer who must buy or sell the same amount of underlying securities. Fund issuers have the right to “gate” funds and refuse to process redemptions to protect the interests of the broader unitholders of the fund. If this happens, there is no secondary market for shares/units in the fund. Recent examples of “gating” include UK property funds after the Brexit vote[1] and strategic bond funds as interest rates expectations rose[2]. By contrast, Exchange Traded Funds can be traded throughout the day and investors generally transact with each other via the exchange. If necessary the fund issuer must create (or redeem) more units to meet demand and then buy (or sell) the same amount of underlying securities. Whilst, the liquidity of the fund is ultimately only as good as the underlying assets, there is, however, additional liquidity in the secondary market for shares in the fund which can be bought or sold amongst investors. For example, there have been circumstances when some markets have closed, and the underlying shares aren’t traded, the ETF continues to trade (albeit a premium or discount to Net Asset Value (NAV) may appear owing to the inability of the ETF to create/redeem units when there is no access to the underlying shares) and indeed becomes a vehicle of price discovery for when the market eventually reopens[3]. As regards fees, whereas funds have different fee scales for different types of investor based on share classes available, the fees on ETFs are the same for all investors meaning that the smallest investors benefit from the economies of scale that the largest investors bring. Whilst the active/passive (we prefer the terms non-index/index) debate grabs the headlines, it is this targeted acces to specific asset classes, fee fairness and secondary market liquidity that makes ETFs so appealing to investors of any size. A summary of similarities and differences of ETFs to other types of fund is presented in the table below: [1] https://seekingalpha.com/article/3986464-investors-u-k-property-etfs-affected-9b-fund-lock [2] https://www.ft.com/content/a007d563-4454-3c92-aeaa-4d0dc64e425b [3] https://www.cnbc.com/id/41354109 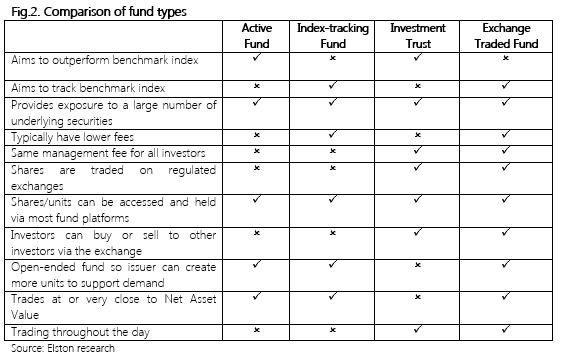 From the table above, we see how, ETFs offer the combined functionality of a collective investment scheme with the flexibility and access of an exchange traded instrument. Ways to use ETFs We see three key applications for ETFs in portfolio construction: “core”, “blended” and “pure”. Using ETFs for a core portfolio means creating and managing a core asset allocation constructed using ETFs, with satellite “true active” fund holdings for each of the same exposures in an attempt to capture some manager alpha at a fund level. This enables a portfolio manager to reduce partially the overall client costs without forsaking their hope of higher expected returns from “true active” non-index fund holdings for each exposure. Using ETFs for a blended portfolio means creating and managing an asset allocation constructed using ETFs for efficient markets or markets where a portfolio managers may lack sufficient research or experience; and active funds for asset class exposures where the manager has high conviction in their ability to deliver alpha from active fund or security selection. For example, a UK portfolio manager with high conviction in UK stock picking may prefer to access US equity exposure using an ETF that tracks the S&P500 rather than attempting to pick stocks in the US. Use of ETFs for a pure ETF Portfolio means creating and managing an asset allocation constructed using ETFs entirely. For example, a portfolio manager looking to substantially reduce overall client costs without compromising on diversification is able to design a portfolio using ETFs for each asset class and risk exposure. Fig.3. Illustration representing core, blended and pure approaches to ETF adoptio 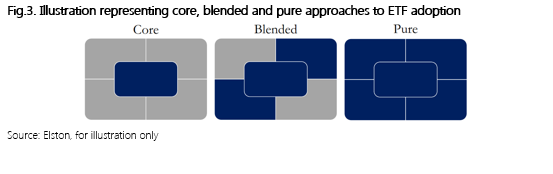 Who uses ETFs and why?
ETFs are used by investors large and small to build and manage their portfolios. As well as providing low cost, diversified and transparent access to a market or asset class, the liquidity of ETFs namely that 1) they only invest in liquid securities that index-eligible and 2) the ETF can itself be bought or sold between market participants means that investors can adapt their portfolio in a timely basis, if required. Put differently traditional funds are one of the few things in the world that you can only sell back to the person you bought it from (the fund issuer), and that fund issuer has the right to say no. Furthermore, the dealing cycles for traditional funds are long. If you want to sell one to buy another, it could take 4-5 days to sell and 4-5 days to buy. An 8-10 day round trip is hardly timely. In the meantime you may be out of the market, which could dramatically impact performance, particularly in periods of extreme volatility. By contrast, ETFs are designed to be tradable on a secondary market via an exchange, and can be bought and sold between market participants on the same day without the fund manager’s involvement. This means that if investors want to alter their risk posture to respond to changing events, they can do so instantly and effectively if required. ETFs have therefore grown in popularity as a core part of institutional and retail investor’s toolkit for portfolio and risk management.  [2 min read, open as pdf]
A Factor-based approach to investing Factor-based investing means choosing securities for an inclusion in an index based on what characteristics or factors drive their risk-return behaviour, rather than a particular geography or sector. Just like food can be categorised simply by ingredients, it can also be analysed more scientifically by nutrients. Factors are like the nutrients in an investment portfolio. What are the main factors? There is a realm of academic and empirical study behind the key investment factors, but they can be summarised as follows The different factors can be summarised as follows:
Which has been the strongest performing factor? Momentum has been the best performing factor over the last 5 years. Value has been the worst performing factor. Fig.1. World equity factor performance 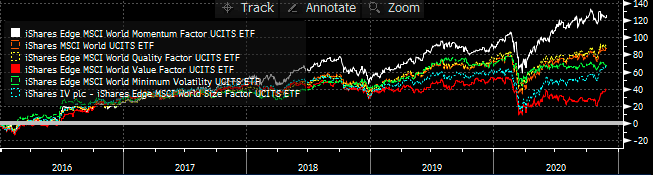 Source: Elston research, Bloomberg data A crowded trade? Data points to Momentum being a “crowded trade”, because of the number of people oerweighting stocks with momentum characteristics. This level of crowdedness can be an indicator of potential drawdowns to come. Fig.2. Momentum Factor is looking increasingly crowded 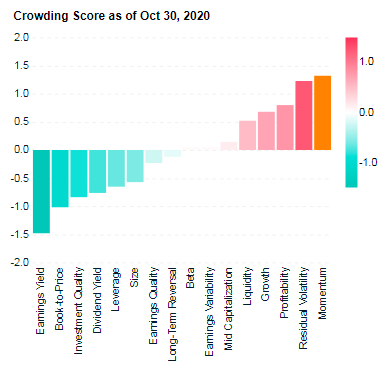 Source: MSCI Factor Crowding Model The best time to buy into a Momentum strategy has been when it is uncrowded – like in 2001 and 2009, which is also true of markets more generally. MSCI’s research suggests that with crowding scores greater than 1 were historically more likely to experience significant drawdowns in performance over subsequent months than factors with lower crowding scores. Fig.3. Factors with higher crowding score can be an indicator of greater potential drawdowns, relative to less crowded factors 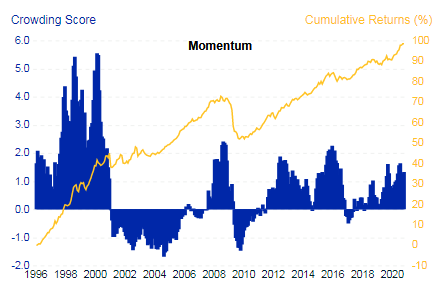 Source: MSCI Factor Crowding Model
Rotation to Value The value-based approach to investing has delivered lack lustre performance in recent times, hence strategists’ calls that there may be a potential “rotation” into Value-oriented strategies in coming months as the post-COVID world normalises. But can factors be timed? Marketing timing, factor timing? Market timing is notoriously difficult. Factor timing is no different. To get round this, a lot of fund providers have offered multi-factor strategies, which allocate to factors either statically or dynamically. Whilst convenient as a catch-all solution, unless factor exposures are dynamically and actively managed, the exposure to all factors in aggregate will be similar to overall market exposure. This has led to a loss of confidence and conviction in statically weighted multi-factor funds. Summary Factors help break down and isolate the core drivers of risk and return.
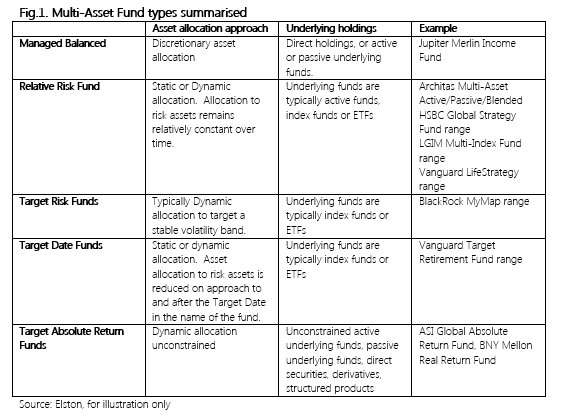
For more on Factor investing, see https://www.elstonsolutions.co.uk/insights/category/factor-investing https://www.msci.com/factor-investing  [7 min read, open as pdf] Whether or not investors enjoy creating and managing their own ETF portfolios, ready-made portfolios and funds of ETFs and index funds offer a convenient alternative In this series of articles, I look at some of the key topics explored in my book “How to Invest With Exchange Traded Funds” that also underpin the portfolio design work Elston does for discretionary managers and financial advisers. Who needs or wants a ready-made portfolio? Individual investors of all wealth levels may find the prospect of engaging with their investment daunting, time-consuming, or both. This is heightened by the high number of investment products and services available. In the UK, there are over 70 discretionary management firms, and over 3,000 investment funds and ETFs. For this reason, DIY investors may want ready-made portfolios that are an easy-to-buy and easy-to-own investment. Not only do these solutions look like a simple alternative but they can also address and can potentially mitigate behavioural mistakes. We look at three alternative ways of delivering ready-made portfolios for DIY investors in more detail: multi-asset funds, ETF portfolios and multi-asset ETFs. Multi-Asset Funds Multi-Asset Funds (also known as Asset Allocation Funds or Multi-Manager Funds) are the most established type of ready-made portfolios. By owning a single fund (or in some cases an investment trust), investors get exposure to a diversified portfolio of underlying funds to reflect a specific asset allocation. This means that having selected a strategy, the investor does not need to worry about asset allocation, or about the portfolio construction to achieve that asset allocation, or about security selection within each asset class exposure. We categorise Multi-Asset Funds into different categories by investment strategy:
 Despite the cost of wrapping underlying funds within a fund structure, economies of scale mean that Multi-Asset Funds can be delivered to investors at highly competitive price points with very low minimums. However, the disadvantage is that Multi Asset Funds have a one-size-fits-all approach that means there is little scope for customisation to the individual needs and characteristics of the investor’s objectives and constraints. ETF Portfolios ETF Portfolios are basket of individual ETFs providing an asset allocation. Rather than wrapping an investment strategy within a fund, a model portfolio is made available as a basket of ETFs that can be bought individually to create the strategy. Model portfolios may be “strategic” (rebalanced to fixed weights of the same securities) or “tactical” (rebalanced to changing weights of the same or different ETFs). Model portfolios are research portfolios meaning that the model portfolio provider has no control of client assets so it is up to a portfolio manager, adviser or DIY investor to implement any changes should they wish to follow a given model portfolio strategy. The advantages of ETF Portfolios include: firstly, potentially lower fees owing to removal of a fund wrapper to hold the strategy; secondly greater flexibility and specificity with regards to asset allocation design; and lastly agility as strategies can be launched or closed with ease. An example of an ETF Portfolio could be as simple as a classic global 60/40 Equity/Bond strategy constructed with ETFs. 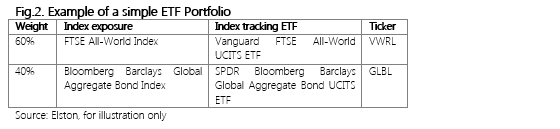 Whilst ostensibly very simple – a two security portfolio – the underlying holdings of each ETF means that investors get exposure to 3,133 equities in global and developed markets (approximately 47 countries) and 1,660 investment grade bonds in over 24 countries. Put simply, the investor is able to buy the bulk of the global equity and bond markets with two simple trades. When manager, advisers or research firms create model portfolios, the weighting scheme can be one of three types as summarised in the table below. 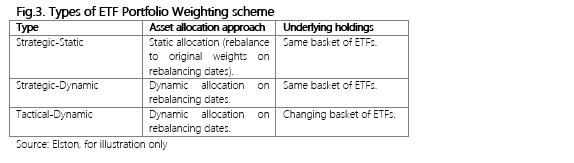 The ability to design and create ETF Portfolios with an increasing number of ETF building blocks means that both traditional (asset managers, stock brokers) and non-traditional providers (e.g. trade publications, investment clubs, industry experts) can create investment strategies that can be “followed” by investors. However, the usual due diligence rules for any investment provider should be applied as regards their investment process. Whilst the rise of more bespoke ETF strategies is welcome, the convenience of having a single strategy delivered as a single security from a portfolio construction perspective is attractive. This is where Multi-Asset ETFs could have a role to play. Multi-Asset ETFs Multi-Asset ETFs are an emerging way of delivering the returns of a managed ETF Portfolio using a single instrument. Whereas multi-asset funds are often funds of index-tracking funds, Multi-Asset ETFs can be viewed as an “ETF of ETFs”. In the US, there are a number of multi-asset ETFs available providing a ready-made allocation within a single trade. In the UK, there are currently only two ranges of multi-asset ETFs available. Multi-Asset Infrastructure (launched April 2015) SPDR® Morningstar Multi-Asset Global Infrastructure UCITS ETF ESG Multi-Asset ETFs (launched September 2020) BlackRock ESG Multi-Asset Conservative Portfolio UCITS ETF (MACG) BlackRock ESG Multi-Asset Moderate Portfolio UCITS ETF (MAMG) BlackRock ESG Multi-Asset Growth Portfolio UCITS ETF (MAGG) We expect multi-asset funds, constructed with ETFs and index funds, to gain more traction than multi-asset ETFs because as a “buy and hold” ready-made portfolio multi-asset funds do not need the intraday dealing availability that ETFs provide. Multi-asset funds (constructed with index funds/ETFs), ETF Portfolios, and Multi-asset ETFs provide a ready-made one stop for delivering a multi-asset investment strategy for all or part of an investment portfolio, whether defined by a multi-asset index or not. The advantages of a multi-asset fund of ETFs as a ready-made portfolio The advantages of a “one and done” approach include collectivisation, convenience and consistency. Firstly, is collectivisation of investor’s by objective which creates cost efficiency from the economies of scale. Adopting a collectivised approach, can be done where each group of clients shares the same goal (as defined by, for example, a target risk level or income objective, or volatility objective or target date). This can help achieve economies of scale and lower the cost of offering professionally managed asset allocations in at least three different ways. Firstly, each cohort becomes a multi-million pound ‘client’ of an asset manager who can deploy institutional-type bargaining power on the pricing of the underlying funds within their asset allocation. Secondly, the collective scale reduces frictional trading costs of implementing the asset allocation decisions: one managed investment journey is more efficient to manage and deliver than thousands of individual ones. Finally, by focusing on actively managing the asset allocation as the main determinant of the level and variability of returns[1] the asset allocation can be implemented with index-tracking ETFs to keep costs down. Secondly is convenience. Rather than focusing solely on building optimal multi-asset class portfolios that need monitoring, the proposition of investment offerings can be engineered to eliminate poor behavioural tendencies that prevent effective management. Engineering funds so that they offer a single investment journey which investors do not necessarily need to monitor regularly in order to reach their goals can help reduce the perceived hassle of investing. This can motivate individuals to invest. Such professionally managed funds prevent investors from either not rebalancing the portfolio or doing it in an improper fashion due to behavioural tendencies such as status quo bias[2] and disposition effect[3]. Furthermore, a professionally managed strategy can respond to other risks aside from market risk such as shortfall, concentration or longevity risks which lay investors can overlook. An additional advantage of offering managed diversified funds is that it automatically curtails the number of products offered, thereby reducing cognitive load of making an investment decision and can prevent decision deferral.[4] Finally is consistency. Investors in each strategy experience the same time-weighted investment returns thereby reducing the likely dispersion of returns that a group of investors would experience through an entirely self-directed approach. This consistency is why multi-asset funds have also been adopted by some financial advisers as a core or complete holding within a centralised investment proposition. The disadvantage of a ready-made portfolio are not secret. They are designed as a “one-size-fits-all” product with no scope for customisation. The respective features of the various types of ready-made portfolio are set out below. Whereas multi-asset funds of ETFs, and multi-asset ETFs can be accessed via a single trade, their scope for customisation is low. ETF Portfolios have the highest degree of flexibility for creating custom strategies, but are not accessible via a single trade. 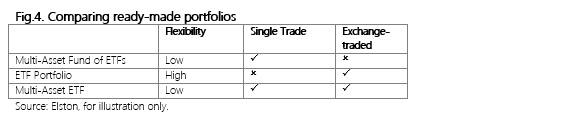 Summary Ready-made portfolios are easy to buy and easy to own. They enable a “set and forget” approach to investment management which can help design out key behavioural risks, or provide a useful core holding to a broader strategy. Obviously the primary choice is which strategy an investor must choose, or their adviser should recommend depending on their risk-return objectives and suitability considerations. [1] Ibbotson, “The Importance of Asset Allocation.” [2] Samuelson and Zeckhauser, “Status Quo Bias in Decision Making.” [3] Shefrin and Statman, “The Disposition to Sell Winners Too Early and Ride Losers Too Long”; Weber and Camerer, “The Disposition Effect in Securities Trading.” [4] Iyengar and Jiang, “How More Choices Are Demotivating”; Iyengar, Huberman, and Jiang, “How Much Choice Is Too Much?”  High risk, complex Exchange Traded Products that amplify (with “leverage”) index’ moves in the same (“long”) or opposite (“short”) direction are designed for sophisticated investors who want to trade and speculate over the short-term, rather than make a strategic or tactical investment decisions. Whilst they can have a short-term role to play, they should be handled with care. If you think you understand them, then you’ve only just begun. In this series of articles, I look at some of the key topics explored in my book “How to Invest With Exchange Traded Funds” that also underpin the portfolio design work Elston does for discretionary managers and financial advisers. For more speculators and or more sophisticated risk managers there are a range of inverse (short) and leveraged (geared) ETPs that can rapidly add or remove upside or downside risk exposure in short-term (daily) market movements. The difference between speculating and investing should be clearly defined.
Owing to the higher degree of risk management and understanding required to use these products, they may not be suitable for DIY or long-term investors. However a degree of knowledge is helpful to identify them within a managed portfolio or amongst research sites. Defining terms Unlike their more straightforward unleveraged ETF cousins, leveraged and inverse or “short” ETNs should be for sophisticated investor or professional use only. So hold onto your seat. Shorting and leverage are important tools in a professional manager’s arsenal. But first we need to define terms. Going long: means buying a security now, to sell it at a later date at a higher value. The buyer has profited from the difference in the initial buying price and final selling price. Going short: means borrowing a security from a lender and selling it now, with an intent to buy it back at a later date at a lower value. Once bought, the security can be returned to the lender and the borrower (short-seller) has profited from the difference in initial selling and final buying price. Leverage: means increasing the magnitude of directional returns using borrowed funds. Leverage can be achieved by:
Underlying index: is the underlying index exposure against which a multiplier is applied. The underlying index could be on a particular market, commodity or currency. Potential applications Managers typically have a decision only whether to buy, sell or hold a security. By introducing products that provide short and/or leveraged exposure gives managers more tools at their disposal to manage risk or to speculate. Going short, and using leverage can be done for short-term risk management purposes, or for speculative purposes. Leverage in either direction (long-short) can be used either to amplify returns, profit from very short market declines, or change the risk profile of a portfolio without disposing of the underlying holdings. Short/Leveraged ETPs available to DIY investors The following types of short/leveraged ETPs are available to implement these strategies. Fig.1. Potential application of inverse/leveraged ETPs 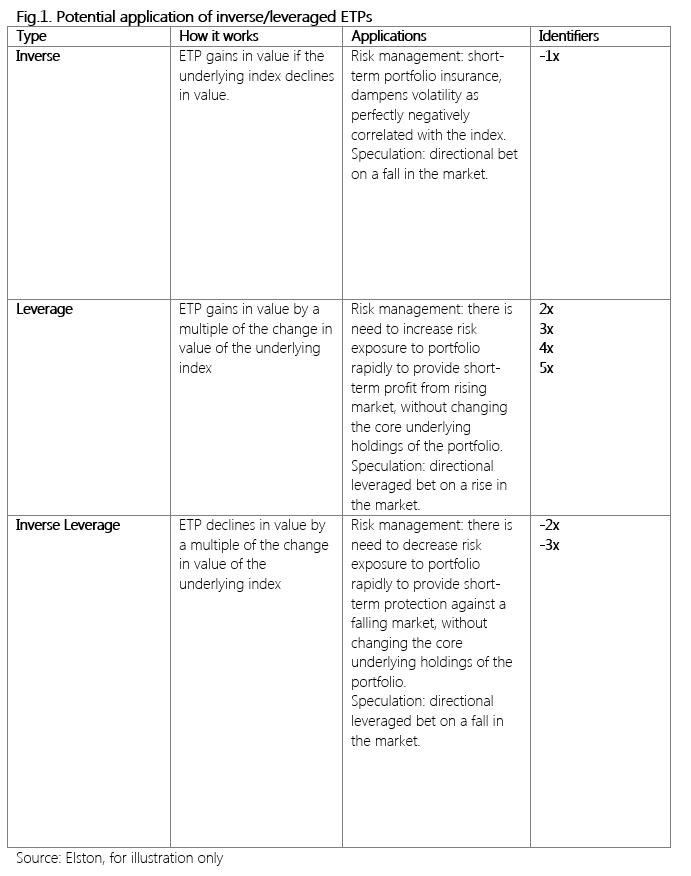 The ability to take short and/or leveraged positions was previously confined to professional managers and ultra-high net worth clients. The availability of more complex Exchange Traded Products gives investors and their advisers the opportunity to manage currency risk, create short positions (profit from a decline in prices) and create leveraged positions (profit more than the increase or decrease in prices).
Risks Leveraged and short ETPs have significantly greater risks than conventional ETFs. Some of the key risks are outlined below:
If concerned regarding risk of deploying short/leveraged ETPs, set a capped allocation i (eg no more than 3% to be held in leveraged/inverse ETPs, and a holding period for leveraged/inverse ETPs not to exceed 1-5 days). US Case Study: Inverse Volatility Blow Up VelocityShares Daily Inverse VIX Short-Term ETN (IVX) and ProShares Short VIX Short-Term Futures ETF were products created in the US for professional investors who wanted to profit from declining volatility on the US equity market by tracking the inverse (-1x) returns of the S&P VIX Short-Term Futures Index. The VIX is itself an reflecting the implied volatility of options on the S&P 500. As US equity market volatility steadily declined the stellar performance of the strategy in prior years not only made it popular with hedge funds[2], but also lured retail investors who are unlikely to have understood the complexity of the product. By complexity, we would argue that a note inversely tracking a future on the implied volatility of the stock market is hardly simple. On 5th February, the Dow Jones Industrial Average suffered its largest ever one day decline. This resulted in the VIX Index spiking +116% (from implied ~12% volatility to implied ~33% volatility). The inverse VIX ETNs lost approximately 80% of their value in one day which resulted in an accelerated closure of the product, and crystallising the one day loss for investors[3]. The SEC (US regulator) focus was not on the product itself but whether and why it had been mis-sold to retail investors who would not understand its complexity[4]. Summary In conclusion, on the one hand, Leveraged/Inverse ETP are convenient ways of rapidly altering risk-return exposures and provide tools with which speculators can play short-term trends in the market. Used by professionals, they also have a role in supporting active risk management. However, the risks are higher than for conventional ETFs and more complex to understand and quantify. RISK WARNING! Short and/or Leveraged ETPs are highly complex financial instruments that carry significant risks and can amplify overall portfolio risk. They are intended for financially sophisticated investors who understand these products, and their potential pay offs. They can be used to take a very short term view on an underlying index, for example, for day-trading purposes. They are not intended as a buy and hold investment. [1] https://seekingalpha.com/article/1457061-how-to-beat-leveraged-etf-decay [2] https://www.cnbc.com/2018/02/06/the-obscure-volatility-security-thats-become-the-focus-of-this-sell-off-is-halted-after-an-80-percent-plunge.html [3] https://www.bloomberg.com/news/articles/2018-02-06/credit-suisse-is-said-to-consider-redemption-of-volatility-note [4] https://www.bloomberg.com/news/articles/2018-02-23/vix-fund-blowups-spur-u-s-to-probe-if-misconduct-played-a-role  [5 min read, open as pdf]
What is Zero Carbon investing The Zero Carbon Society at Cambridge University is one of many campaign groups calling for university endowment funds to divest from all fossil fuels. This has been termed “Zero Carbon” investing. The divestment trend started in the US in 2012 when the city of Seattle divested from fossil fuels. In 2014, Stanford University followed suit. Campaigns across the US and UK led to other universities following suit. Some of the reasons universities found it hard to ensure that their investments were “fossil free” is because:
The challenge When set this challenge by a university college, we proposed to do two things. Firstly to create a Zero Carbon SRI benchmark to show how Zero Carbon investing could be done whilst also focusing on other ESG considerations. Secondly, to create a Zero Carbon portfolio to deliver on the primary aim of full divestment. Creating a Zero Carbon SRI benchmark We wanted to create a benchmark for the endowment’s managers that not only screened out fossil fuels, but went further to screen out one of the main consumer of fossil fuels, the Utilities sector, as well as other extractive industries – namely the Materials sector. We also wanted to screen in companies with high ESG scores and low controversy risk and cover the global equity opportunity set. We worked with MSCI to create a custom index, the catchily-named (for taxonomy reasons) the MSCI ACWI ex Energy ex Materials ex Utilities SRI Index (the “Custom Index”, please refer to Notice below). Creating a Zero Carbon portfolio The second part of the project was to create an implementable investment strategy that maintained a similar risk-return profile to World Equities, but fully excluded the Energy, Materials and Utilities sectors. Rather than creating a fund which introduces additional layer of costs, this was achievable using sector-based ETF portfolio. This portfolio meets the primary objective of creating a Zero Carbon, fully divested, world equity mandate. In the absence of ESG/SRI sector-based ETFs, it is not yet possible to create a sector-adjusted ESG/SRI ETF portfolio. But we expact that to change in the future. Custom Index Performance The back-test of both the custom index could deliver similar risk-return characteristics to global equities. The concern was would those back-test results continue once the index and portfolio went live. The answer is yes. Whilst the custom index has shown outperformance, that was not the objective. The objective was to access the same opportunity set, but with the fossil-free, ESG and socially responsible screens in place. Fig.1. Custom Index performance simulation from June 2012 & live performance from June 2018 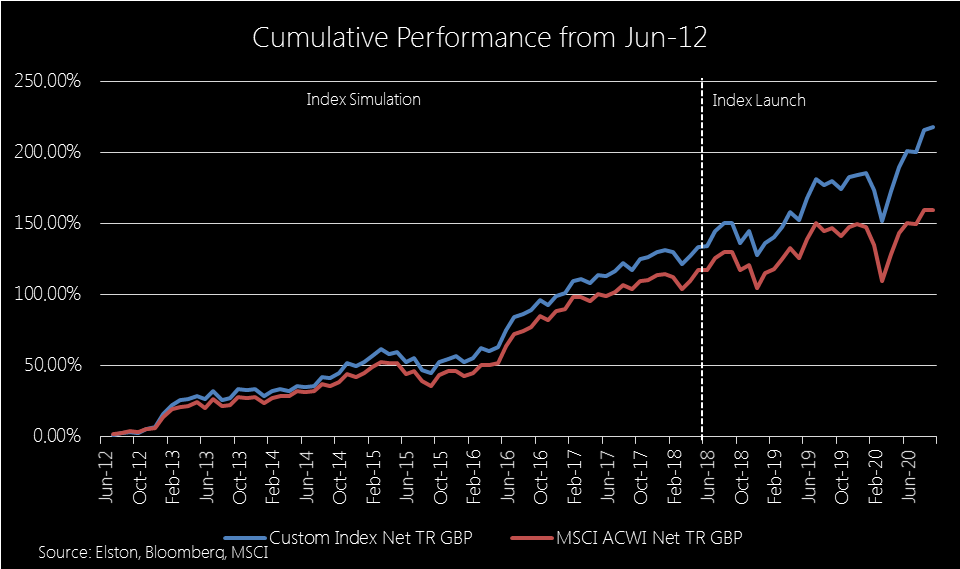 Zero Carbon Portfolio performance Similarly, the Zero Carbon portfolio has delivered comparable performance to MSCI World – hence no “missing out” on the opportunity set whilst being fully divested from fossil fuels. Although not intentional, the exclusion of Energy, Materials & Utilities has benefitted performance and meant that the performance, net of trading and ongoing ETF costs, is ahead of the MSCI World Index. Fig.2. Zero Carbon ETF portfolio performance from June 2018 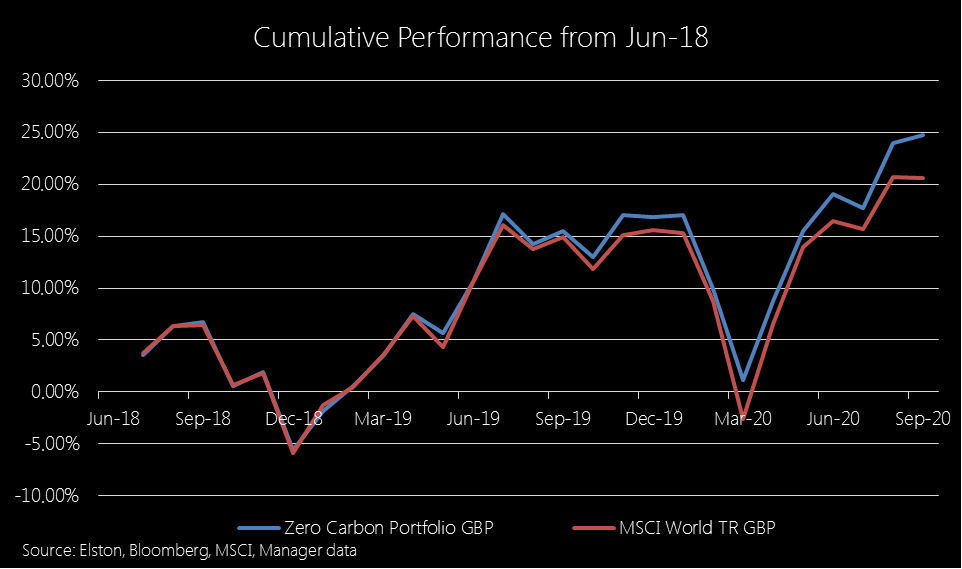 Summary
Whatever your views on the pros and cons of divestment, Zero Carbon investing is not an insurmountable challenge, and the combination of index solutions and ETF portfolios solutions creates a range of implementable options for asset owners and asset managers alike. IMPORTANT NOTICE ABOUT THE CUSTOM INDEX With reference to the MSCI ACWI ex Energy ex Materials ex Utilities SRI Index (“Custom Index”). Where Source: MSCI is noted, the following notice applies. Source: MSCI. The MSCI data is comprised of a custom index calculated by MSCI, and as requested by, Queens’ College Cambridge. The MSCI data is for internal use only and may not be redistributed or used in connection with creating or offering any securities, financial products or indices. Neither MSCI nor any third party involved in or relating to compiling, computing or creating the MSCI data (the “MSCI Parties”) makes any express or implied warranties or representations with respect to such data (or the results to be obtained by the use thereof), and the MSCI Parties hereby expressly disclaim all warranties of originality, accuracy, completeness, merchantability or fitness for a particular purpose with respect to such data. Without limiting any of the foregoing, in no event shall any of the MSCI Parties have any liability for any direct, indirect, special, punitive, consequential or any other damages (including lost profits) even if notified of the possibility of such damages.  Which asset classes are not indexable; what proxies do they have that can be indexed; and why it can make sense to blend ETFs and Investment Trusts for creating an allocation to alternative asset classes In this series of articles, I look at some of the key topics explored in my book “How to Invest With Exchange Traded Funds” that also underpin the portfolio design work Elston does for discretionary managers and financial advisers. Non-indexable asset classes Whilst Equities, Bonds and Cash are readily indexable, there are also exposures that will remain non-indexable because they are:
It is however possible to represent some of these alternative class exposures using liquid index proxies. Index providers and ETF issuers have worked on creating a growing number of indices for specific exposures in the Liquid Alternative Asset space. Some examples are set out below:
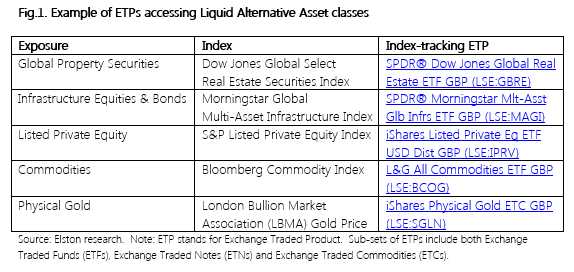 Alternative asset index proxies Whilst these liquid proxies for those asset classes are helpful from a diversification perspective, it is important to note that they necessarily do not share all the same investment features, and therefore do not carry the same risks and rewards as the less liquid version of the asset classes they represent. 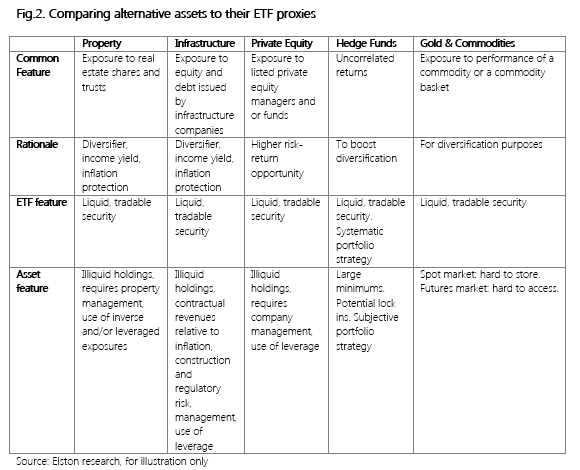 While ETFs for alternatives assets will not replicate holding the risk-return characteristics of that exposure directly, they provide a convenient form of accessing equities and/or bonds of companies that do have direct exposure to those characteristics. Using investment trusts for non-index allocations Ironically, the investment vehicle most suited for non-indexable investments is the oldest “Exchange Traded” collective investment there is: the Investment Company (also known as a “closed-end fund” or “investment trust”). The first UK exchange traded investment company was the Foreign & Colonial Investment Trust, established in 1868. Like ETFs, investment companies were originally established to bring the advantages of a pooled approach to the investor of “moderate means”. 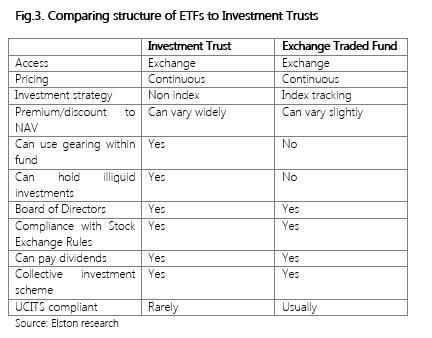 For traditional fund exposures, e.g. UK Equities, Global Equities, our preference is for ETFs over actively managed Investment Trusts owing to the performance persistency issue that is prevalent for active (non-index) funds. Furthermore, investment trusts have the added complexity of internal leverage and the external performance leverage created by the share price’s premium/discount to NAV – a problem that can become more intense during periods of market stress.
However, for accessing hard-to-reach asset classes, Investment Trusts are superior to open-ended funds, as they are less vulnerable to ad hoc subscriptions and withdrawals. The Association of Investment Company’s sector categorisations gives an idea of the non-indexable asset classes available using investment trusts: these include Hedge Funds, Venture Capital Trusts, Forestry & Timber, Renewable Energy, Insurance & Reinsurance Strategies, Private Equity, Direct Property, Infrastructure, and Leasing. A blended approach Investors wanting to construct portfolios accessing both indexable investments and non-indexable investments could consider constructing a portfolio with a core of lower cost ETFs for indexable investments and a satellite of higher cost specialist investment trusts providing access to their preferred non-indexable investments. For investors, who like non-index investment strategies, this hybrid approach may offer the best of both world. Summary The areas of the investment opportunity set that will remain non-indexable, are (in our view) those that are hard to replicate as illiquid in nature (hard to access markets or parts of markets); and those that require or reward subjective management and skill. Owing to the more illiquid nature of underlying non-indexable assets, these can be best accessed via a closed-ended investment trust that does not have the pressure of being an open-ended fund. ETFs provide a convenient, diversified and cost-efficient way of accessing liquid alternative asset classes that are indexable and provide a proxy or exposure for that particular asset class. Examples include property securities, infrastructure equities & bonds, listed private equity, commodities and gold.  [5 minute read, open as pdf] Sign up for our upcoming CPD webinar on Real Assets for diversification
What are “Real Assets”? Real Assets can be defined as “physical assets that have an intrinsic worth due to their substance and property”[1]. Real assets can be taken to include precious metals, commodities, real estate, infrastructure, land, equipment and natural resources. Because of the “inflation-protection” objective of investing in real assets (the rent increases in property, the tariff increases in infrastructure), real asset funds also include exposure to inflation-linked government bonds as a financial proxy for a real asset. Why own Real Assets? There are a number of rationales for investing in Real Assets. The primary ones are to:
Accessing Real Assets Institutional investors can access Real Assets directly and indirectly. They can acquired direct property and participate in the equity or debt financing of infrastructure projects. Directly. For example, the Pensions Infrastructure Platform, established in 2021 has enabled direct investment by pension schemes into UK ferry operators, motorways and hospital construction projects. This provides funding for government-backed project and real asset income and returns for institutional investors. Institutional investors can also access Real Assets indirectly using specialist funds as well as mainstream listed funds such as property securities funds and commodities funds. Retail investors can access Real Assets mostly indirectly through funds. There is a wide range of property funds, infrastructure funds, commodity funds and natural resources funds to choose from. But investors have to decide on an appropriate fund structure.
The rise of real asset funds The first UK diversified real asset fund was launched in 2014, with competitor launches in 2018. There is now approximately £750m invested across the three largest real asset funds available to financial advisers and their clients, with fund OCFs ranging from 0.97% to 1.46%. Following the gating of an Equity fund (Woodford), a bond fund (GAM) and several property funds for liquidity reasons, there has – rightly – been increased focus by the regulator and fund providers (Authorised Corporate Directors or “ACDs”) on the liquidity profile of underlying assets. As a result, given their increased scale, real asset fund managers are increasingly turning to mainstream funds and indeed liquid ETFs to gain access to specific asset classes. Indeed, on our analysis, one real assets funds has the bulk of its assets invested in mainstream funds and ETFs that are available to advisers directly. Now there’s no shame in that – part of the rationale for using a Real Assets fund is to select and combine funds and manage the overall risk of the fund. But what it does mean is that discretionary managers and advisers have the option of creating diversified real asset exposure, using the same or similar underlying holdings, for a fraction of the cost to clients. Creating a liquid real asset index portfolio We have created the Elston Liquid Real Asset index portfolio of ETFs in order to:
We have built the index portfolio using the following building blocks
As regards asset allocation, we are targeting a look-through ~50/50 balance between equity-like securities and bond-like securities to ensure that the strategy provides beta reduction as well as diversification when included in a portfolio. For the index portfolio simulation, we have used an equal weighted approach. Fig.1. Performance of the Liquid Real Asset Index Portfolio (.ELRA) 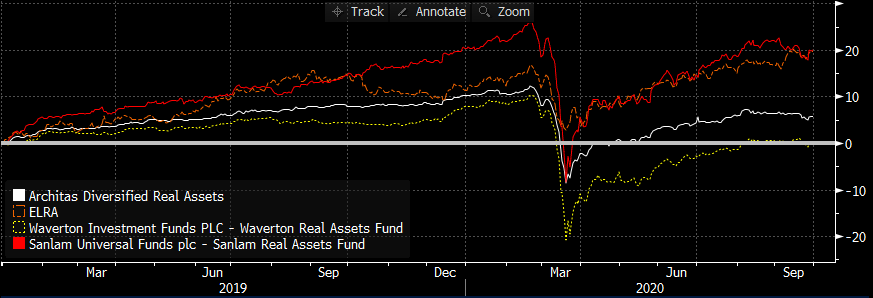 Source: Elston research, Bloomberg data. Total returns from end December 2018 to end September 2020 for selected real asset funds. Since December 2018, the Sanlam Real Assets fund has returned 19.99%, the Elston Real Asset Index Portfolio has returned +19.76%. This compares to +5.86% for the Architas Diversified Real Asset fund and +0.16% for the Waverton Real Assets Fund. What about Beta Our Real Asset Index Portfolio has a Beta of 0.75 to the Elston 60/40 GBP index so represents a greater risk reduction than Waverton (0.86) and Sanlam (0.84), which are all higher beta than Architas (0.53). Fig.2. Real Asset strategies’ beta to a 60/40 GBP Index 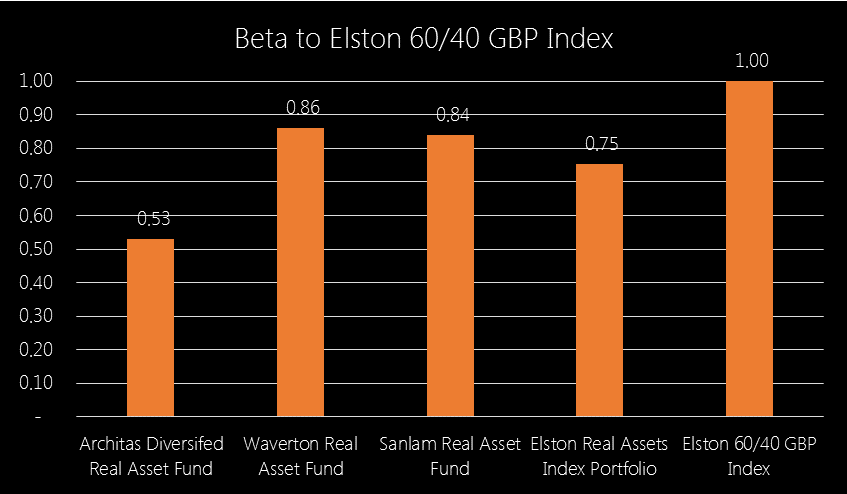 Source: Elston research, Bloomberg data. Weekly data relative to Elston 60/40 GBP Index, GBP terms Dec-18 to Sep-20. Finally, by accessing the real asset ETFs directly, there is no cost for the overall fund structure, hence the implementation cost for an index portfolio of ETFs is substantially lower. Fig.3. Cost comparison of Real Asset funds vs index portfolio of ETFs 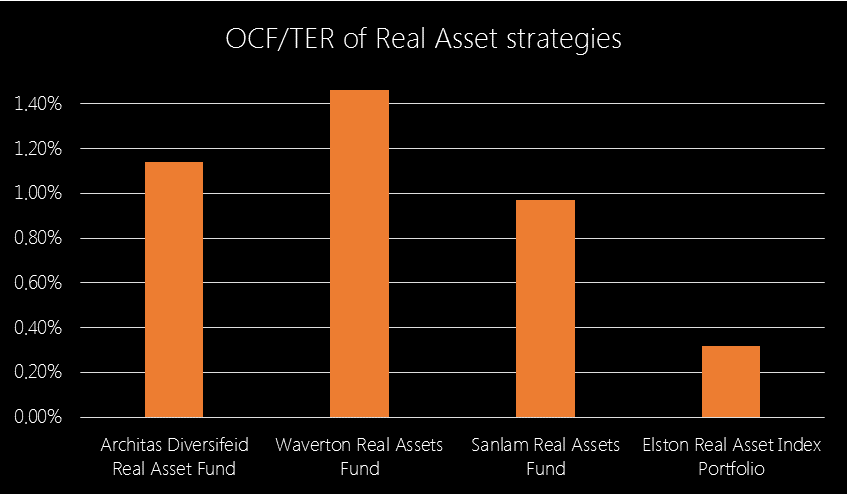 Source: Elston research, Bloomberg data
Fund or ETF Portfolio? The advantage of a funds-based approach is convenience (single-line holding), as well as having a a manager allocate dynamically between the different real asset exposures within the fund. The advantage of an index portfolio is simplicity, transparency and cost. Creating a managed ETF portfolio strategy that dynamically allocates to the different real asset classes over the market cycle is achievable and can be implemented on demand. Summary The purpose of this analysis was to note that:
[1] Source: https://www.investopedia.com/terms/r/realasset.asp  There’s no such thing as passive. Index investors make active decisions around asset allocation, index selection and index methodology. In this series of articles, I look at some of the key topics explored in my book “How to Invest With Exchange Traded Funds” that also underpin the portfolio design work Elston does for discretionary managers and financial advisers. If indices represent exposures, what is index investing and what are the ETFs that track them? Does using an index approach to investing mean you are a ‘passive investor’? I am not comfortable with the terms “active” and “passive”. A dynamically managed approach to asset allocation using index-tracking ETFs is not “passive”. The selection of an equal weighted index exposure over a cap weighted index is also an active decision. The design of an index methodology, requires active parameter choices. Hence our preference for the terms “index funds” and “non-index funds”. Indices represent asset classes. ETFs track indices. Index investing is the use of ETFs to construct and manage an investment portfolio. The evolution of indices The earliest equity index in the US is the Dow Jones Industrial Average (DJIA) which was created by Wall street Journal editor Charles Dow. The index launched on 26 May 1896, and is named after Dow and statistician Edward Jones and consists of 30 large publicly owned U.S. companies. It is a price-weighted index (meaning the prices of each security are totalled and divided by the number of each security to derive the index level). The earliest equity index in the UK is the FT30 Index (previously the FN Ordinary Index) was created by the Financial Times (previously the Financial News). The index launched on 1st July 1935 and consists of 30 large publicly owned UK companies. It is an equal-weighted index (meaning each of the 30 companies has an equal weight in the index). The most common equity indices now are the S&P500 (launched in 1957) for the US equity market and the FTSE100 (launched in 1984) for the UK Equity market. These are both market capitalisation-weighted indices (meaning the weight of each company within the index is proportionate to its market capitalisation (the share price multiplied by the number of shares outstanding)). According to the Index Industry Association, there are now approximately 3.28m indices, compared to only 43,192 public companies . This is primarily because of demand for highly customised versions of various indices used for benchmarking equities, bonds, commodities and derivatives. By comparison there are some 7,178 index-tracking ETPs globally. The reason why the number of indices is high is not because they are all trying to do something new, but because they are all doing something slightly different. For example, the S&P500 Index, the S&P500 (hedged to GBP) Index and the S&P 500 excluding Technology Index are all variants around the same core index. So the demand for indices is driven not only by investor demand for more specific and nuanced analysis of particular market exposures, but also for innovation from index providers. What makes a good index benchmark? For an index to be a robust benchmark, it has to meet certain criteria. Indices provided a combined price level (and return level) for a basket of securities for use as a reference, benchmark or investment strategy. Whilst a reference point is helpful, the use of indices as benchmarks enables informed comparison of fund or portfolio strategies. An index can be used as a benchmark so long as it has the following qualities (known as the “SAMURAI” test based on the mnemonic based on key benchmark characteristics in the CFA curriculum). It must be:
Alternative weighting schemes Whereas traditional equity indices took a price-weighted, equal-weighted or market capitalisation weighted approach, there are a growing number of indices that have alternative weighting schemes: given the underlying securities are the same, these variation of weighting scheme also contributes to the high number of indices relative to underlying securities. The advent of growing data and computing power means that indices have become more granular to reflect investors desire for more nuanced exposures and alternative weighting methodologies . 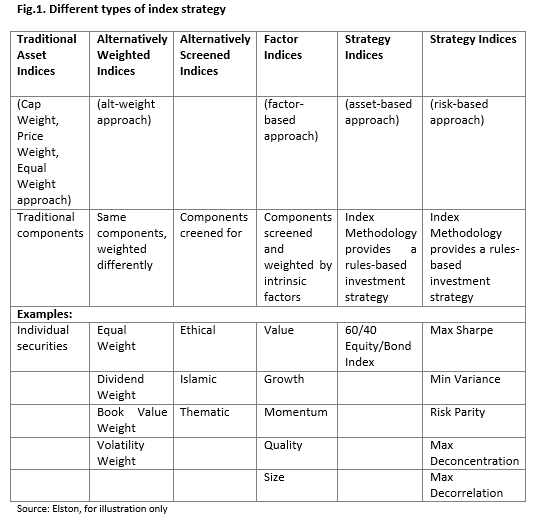 Whether indices are driven by investor needs for isolated asset class exposures or by other preferences, there is a growing choice of building blocks for portfolio constructors.
Index investing Whilst indices have traditionally been used for performance measurement, if the Efficient Markets Hypothesis holds true, it makes sense to use an index as an investment strategy. A fund that matches the weightings of the securities within an index is an index-tracking fund. The use of single or multiple funds that track indices to construct and manage a portfolio is called “index investing”. We define index investing as 1) using indices (whether traditional cap-weighted or alternatively weighted) to represent the various exposures used within a strategic or tactical asset allocation framework, and 2) using index-tracking ETFs to achieve access to that exposure and/or asset allocation. The advantages of index investing with ETFs are:
As index investors we have a choice of tools at our disposal. The primary choice is to whether to use Index Funds or ETPs to get access to a specific index exposure. Index funds and ETPs Exchange Traded Products (ETPs) is the overarching term for investment products that are traded on an exchange and index-tracking. There are three main sub-sets:
Individual investors are most likely to come across physical Exchange Traded Funds and some Exchange Traded Commodities such as gold. Professional investors are most likely to use any or all types of ETPs. Both individual and professional investors alike are using ETPs for the same fundamental purposes: as a precise quantifiable building block with which to construct and manage a portfolio. Index investors have the choice of using index funds or ETFs. Index funds are bought or sold from the fund issuer, not on an exchange. ETFs are bought or sold on an exchange. For individual investors index funds may not be available at the same price point as for institutional investors. Furthermore, the range of index funds available to individual investors is much less diverse than ETFs. Trading index funds takes time (approximately 4-5 days to sell and settle, 4-5 days to purchase, so 8-10 days to switch), whereas ETFs can be bought on a same-day basis, and cash from sales settles 2 days after trading reducing unfunded round-trip times to 4 days for switches. If stock brokers allow it, they may allow purchases of one transaction to take place based on the sales proceeds of another transaction so long as they both settle on the same day. The ability to trade should not be seen as an incentive to trade, rather it enables the timely reaction to material changes in the market or economy. For professional investors, some index funds are cheaper than ETFs. Where asset allocation is stable and long-term, index funds may offer better value compared to ETFs. Where asset allocation is dynamic and there are substantial liquidity or time-sensitive implementation requirements, ETFs may offer better functionality than index funds. Professional investors can also evaluate the use of ETFs in place of index futures . For significant trade sizes, a complete cost-benefit analysis is required. The benefit of the ETF approach being that futures roll can be managed within an ETF, benefitting from economies of scale. For large investors, detailed comparison is required in order to evaluate the relative merits of each. The benefits of using ETFs There are considerable benefits of using ETFs when constructing and managing portfolios. Some of these benefits are summarised below:
Summary There’s no such thing as “passive investing”. There is such a thing as “index investing” and it means adopting a systematic (rules-based), diversified and transparent approach to access target asset class, screened, factor or strategy exposures in a straightforward, or very nuanced way. It is the systematisation of the investment process that enables competitive pricing, relative to active, “non-index” funds. This is a trend which has a long way to run before any “equilibrium” between index and active investing is reached. Most investors, automatically enrolled into a workplace pension scheme are index investors without knowing it. The “instutionalisation of retail” means that a similar investment approach is permeating into other channels such as discretionary managers, financial advisers, and self-directed investors. © Elston Consulting 2020 all rights reserved  [5 minute read, open as pdf] Sign up for our upcoming CPD webinar on diversifying income risk Summary
Dividend concentration risk is not new, just more visible A number of blue chip companies announced dividend reductions or suspensions in response to financial pressure wrought by the Coronavirus outbreak. This brought into light the dependency, and sometimes over-dependency, on a handful of income-paying companies for equity income investors. For UK investors in the FTSE 100, the payment of dividends from British blue chip companies provides much of its appeal. However a look under the bonnet shows a material amount of dividend concentration risk (the over-reliance on a handful of securities to deliver a dividend income). On these measures, 53% of the FTSE 100’s dividend yield comes from just 8 companies; whilst 22% of its dividend yield comes from energy companies. The top 20 dividend contributors provide 76% of the dividend yield. We measure dividend concentration risk by looking at the product of a company’s weight in the index and its dividend yield, to see its Contribution to Yield of the overall index. Fig.1. FTSE 100 Contribution to Yield, ranked 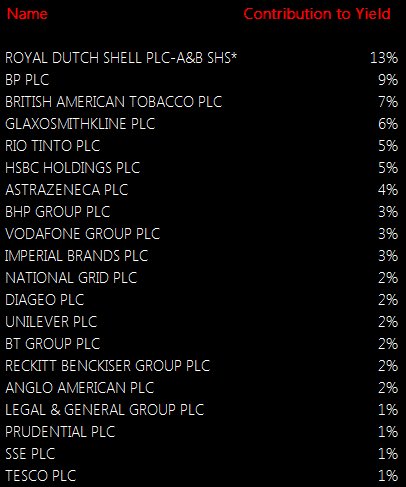 Source: Elston research, Bloomberg data, as at June 2020 Quality of Income More important than the quantity of the dividend yield, is its quality. As income investors found out this year, there’s a risk to having a large allocation to a dividend payer if it cuts or cancels its dividend. Equally, there’s a risk to having a large allocation to a dividend payer, whose yield is only high as a reflection of its poor value. Screening for high dividend yield alone can lead investors into “value-traps” where the income generated looks high, but the total return (income plus capital growth) generated is low. Contrast the performance of these UK Equity Income indices, for example. Fig.2. UK Equity Income indices contrasted 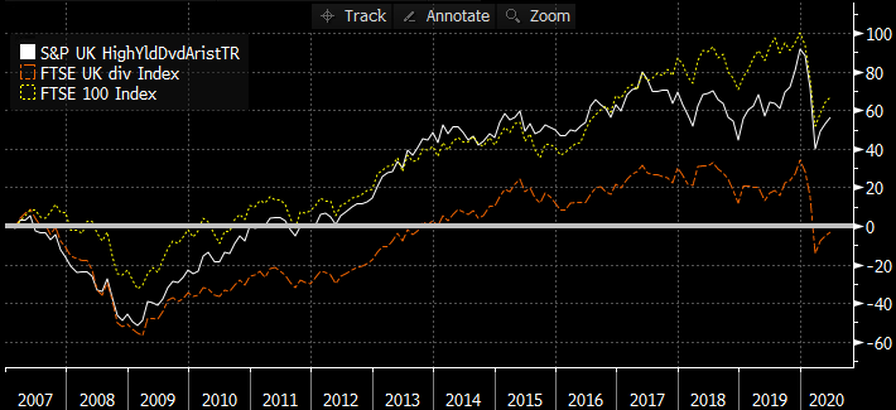 Source: Elston research, Bloomberg data. Total returns from end December 2006 to end June 2020 for selected UK Equity Indices. Headline Yield as per Bloomberg data as at 30th June 2020 for related ETFs. The headline yield for the FTSE UK Dividend+, FTSE 100 and S&P UK Dividend Aristocrat Indices was 8.10%, 4.44%, and 4.07% respectively as at end June 2020. However, the annualised long-run total return (income plus capital growth) 1.03%, 4.29% and 4.82% respectively. Looking at yield alone is not enough. The dependability of the dividends, and the quality of the dividend paying company are key to overall performance. Mitigating dividend concentration risk: quality yield, with low concentration The first part of the solution is to focus on high quality dividend-paying companies. One of the best indicators of dividend quality is a company’s dividend policy and track record. A dependable dividend payer is one that has paid the same or increased dividend year in, year out, whatever the weather. The second part of the solution is to consider concentration risk and make sure that companies’ weights are not skewed in an attempt to chase yield. This is evident by contrasting the different index methodologies for these equity income indices. The FTSE 100 does not explicitly consider yield (and is not designed to). The FTSE UK Dividend+ index ranks companies by their dividend yield alone. The S&P UK Dividend Aristocrats only includes companies that have consistently paid a dividend over several years, whilst ensuring there is no over-dependency on a handful of stocks. A look at the top five holdings of each index shows the results of these respective methodologies. Fig.3. Top 5 holdings of selected UK equity indices 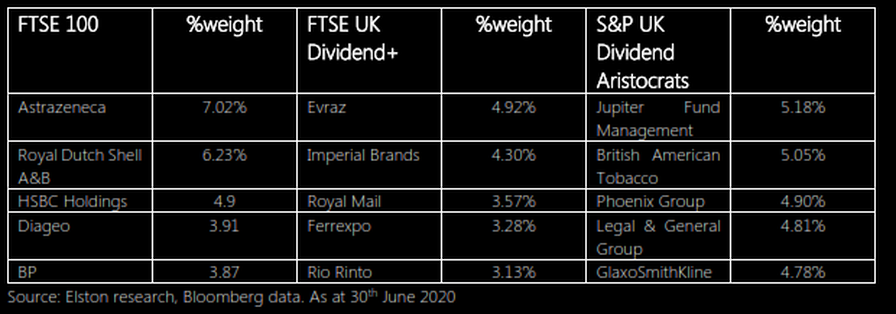 Put simply, the screening methodology adopted will materially impact the stocks selected for inclusion in an equity income index strategy. What about active managers? A study by Interactive Investor looked at the top five most commonly held stocks in UK Equity Income funds and investment trusts. For funds, the most popular holdings were GlaxoSmithKline, Imperial Brands, BP, Phoenix Group & AstraZeneca. For investment trusts, the most popular holdings are British American Tobacco, GlaxoSmithKline, RELX, AstraZeneca and Royal Dutch Sell. Unsurprisingly, each of the holdings above is also a constituent of the S&P Dividend Aristocrats index, hence ETFs that track this index simply provide a lower cost way of accessing the same type of company (dependable dividend payers with steady or increasing dividends), but using a systematic approach that enables a lower management fee. Understanding what makes dividend income dependable for an asset class such as UK equities, is only part of the picture of mitigating income risk. Income diversification is enabled by adopting a multi-asset approach. The advantage of a multi-asset approach The advantage of a multi-asset approach is two-fold. Firstly the ability to diversify equity income by geography for a more globalised approach, to benefit from economic and demographic trends outside the UK. Secondly the ability to diversify income by asset class, to moderate the level of overall portfolio risk. For investors who never need to dip into capital, have a very high capacity for loss, and can comfortably suffer the slings and arrows of the equity market, equity income works well – so long as the quality of dividends is addressed, as above. But for anyone else, where there is a need for income, but a preference for a more balanced asset allocation, a multi-asset income approach may make more sense. The rationale for a multi-asset approach is therefore to capture as much income as possible without taking as much risk as an all-equity approach. Value at Risk vs Income Reward There is always a relationship between risk and reward. For income investors, it’s no different. To be rewarded with more income, you need to take more risk with your capital. This means including equities over bonds, and, within the bonds universe, considering both credit quality (the additional yield from corporate and high yield bonds over gilts), and investment term (typically, the longer the term, the greater the yield). This overall level f risk being taken can be measured using a Value at Risk metric (a “worst case” measure of downside risk). If you want something with very low value-at-risk, shorter duration gilts can provide that capital protection, but yields are very low. Even nominally “safe” gilts, with low yields, nonetheless have potential downside risk owing to their interest rate sensitivity (“duration”). UK Equities offer a high yield, but commensurately also carry a much higher downside risk. The relationship between yield and Value-at-Risk (a measure of potential downside risk) is presented below. Fig.4. Income Yield vs Value at Risk of selected asset classes/indices 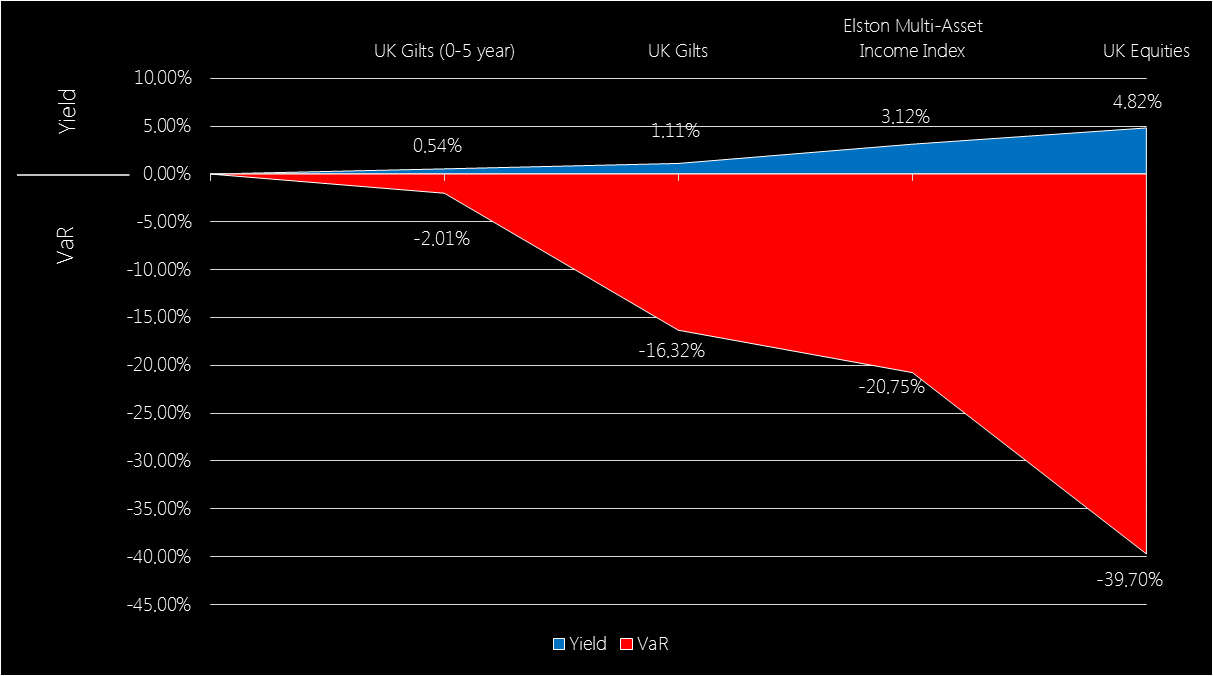 Source: Elston research, Bloomberg data, as at 30th June 2020. Note: an investment with a Value at Risk (“VaR”) of -10% (1 year, 95% Confidence) means there is, to 95% confidence (a 1 in 20 chance), a risk of losing 10% of the value of your investment over any given year. Asset class data reflects representative ETFs.
Our Multi-Asset Income index has, unsurprisingly, a risk level between that of gilts and equities, and captures approximately 65% of the yield, but with only 52% of the Value-at-Risk. Summary How you get your income – whether from equities, bonds or a mix – is critical to the amount of risk an investor is willing and able to take, and is a function of asset allocation. Understanding the asset allocation of an income funds is key to understanding its risks (for example, Volatility, Value at Risk and Max Drawdown). The dependability of dividend income you receive - whether from value traps or quality companies; whether concentrated or diversified – is a function of security selection. This can be either manager-based (subjective), or index-based (objective). For investors requiring a dependable yield, a closer look at how income is generated – through asset allocation and dividend dependability – is key.  Investors should prefer the certainty of index funds which track the index less passive fees, than the hope and disappointment of active funds which, in aggregate, track the index less active fees.
In this series of articles, I look at some of the key topics explored in my book “How to Invest With Exchange Traded Funds” that also underpin the portfolio design work Elston does for discretionary managers and financial advisers. Clarifying terms We believe that typically an index fund or ETF can perfectly well replace an active fund for a given asset class exposure. As with all disruptive technologies, many column inches have been dedicated to the “active vs passive” debate. However, with poorly defined terms, much of this is off-point. If active investing is referring to active (we prefer “dynamic”) asset allocation: we fully concur. There need be no debate on this topic. Making informed choices on asset allocation – either using a systematic or non-systematic decision-making process – is an essential part of portfolio management. If, however, active investing refers to fund manager or security selection, this is more contentious, and this should be the primary topic of debate. Theoretical context: the Efficient Market Hypothesis The theoretical context for this active vs passive debates is centred on the notion of market efficiency. The efficient market hypothesis is the theory that all asset prices reflect all the available past and present information that might impact that price. This means that the consistent generation of excess returns at a security level is impossible. Put differently, it implies that securities always trade at their fair value making it impossible to consistently outperform the overall market based on security selection. This is consistent with the financial theory that asset prices move randomly and thus cannot be predicted . Putting the theory into practice means that where markets are informationally efficient (for example developed markets like the US and UK equity markets), consistent outperformance is not achievable, and hence a passive investment strategy make sense (buying and holding a portfolio of all the securities in a benchmark for that asset class exposure). Where markets are informationally inefficient (for example frontier markets such as Bangladesh, Sri Lanka and Vietnam ) there is opportunity for an active investment strategy to outperform a passive investment strategy net of fees. Our view is that liquid indexable markets are efficient and therefore in most cases it makes sense to access these markets using index-tracking funds and ETFs, in order to obtain the aggregate return for each market, less passive fees. This is because, owing to the poor arithmetic of active management, the aggregate return for all active managers is the index less active fees. The poor arithmetic of active management Bill Sharpe, the Nobel prize winner, and creator of the eponymous Sharpe Ratio, authored a paper “The Arithmetic of Active Management” that is mindblowing in its simplicity, and is well worth a read. We all know the criticism of passive investing by active managers is that index fund [for a given asset class] delivers the performance of the index less passive fees so is “guaranteed” to underperform. That’s true, but it misses a major point. The premise of Sharpe’s paper is that the performance, in aggregate, of all active managers [for a given asset class] is the index less active fees. Wait. Read that again. Yes, that’s right. The performance of all active managers is, in aggregate (for a given asset class) the index less active fees. Sounds like a worse deal than an index fund? It’s because it is. How is this? Exploring the arithmetic of active Take the UK equity market as an example. There are approximately 600 companies in the FTSE All Share Index. Now imagine there are only two managers of two active UK equity funds, Dr. Star and Dr. Dog. Dr. Star consistently buys, with perfect foresight, the top 300 performing shares of the FTSE All Share Index each year, year in year out, consistently over time. This is because he avoids the bottom 300 worst performing shares. His performance is stellar. That means there are 300 shares that Dr. Star does not own, or has sold to another investor, namely to Dr. Dog. Dr. Dog therefore consistently buys, with perfect error, the worst 300 performing shares of the FTSE All Share Index each year, year in year out, consistently over time. His performance is terrible. However, in aggregate, the combined performance of Dr. Star and Dr. Dog is the same as the performance of the index of all 600 stocks, less Dr. Star’s justifiable fees, and Dr. Dog’s unjustifiable fees. The performance of both active managers is, in aggregate, the index less active fees. It’s a zero sum game. In the real world the challenge of persistency – persistently outperforming the index to be Dr.Star – means that over time it is very hard, in efficient markets to persistently outperform the index. So investors have a choice. They can either pay a game of hope and fear, hoping to consistently find Dr. Star as their manager. Or they can be less exciting, rational investor who focus on asset allocation and implement it using index fund to buy the whole market for a given asset exposure keep fees down. Given this poor “arithmetic” of active management, why would you ever chose an active fund (in aggregate, the index less active fees) over a passive fund (in aggregate the index less passive fees)? Quite. Monitoring performance consistency The inability of non-index active funds to consistently outperform their respective index is evidenced both in efficient market theory, and in practice. Consistent with the Efficient Market Hypothesis, studies have shown that actively managed funds generally underperform their respective indices over the long-run and one of the main determinant of performance persistency is fund expenses . Put differently, lower fee funds offer better value for money than higher fee funds for the same given exposure. This is a key focus area from the UK regulator as outlined in the Asset Management Market Study. In practice, the majority of GBP-denominated funds available to UK investors have underperformed a related index over longer time horizons. Whilst the percentage of funds that have beaten an index over any single year may fluctuate from year to year, no active fund category evaluated has a majority of outperforming active funds when measured over a 10-year period. This tendency is consistent with findings on US and European based funds, based on the regularly published “SPIVA Study”. The poor value of active managers who “closet index” “Closet indexing” is a term first formalised by academics Cremers and Petajisto in 2009 . It refers to funds whose objectives and fees are characteristic of an active fund, but whose holdings and performance is characteristic of a passive fund. Their study and metrics around “active share” and “closet indexing” caused a stir in the financial pages on both sides of the Atlantic as active fund managers started to watch the persistent rise of ETFs and other index-tracking products. The issue around closet index funds is not simply about fees. It’s as much about transparency and customer expectations. Understanding Active Share Active Share is a useful indicator developed by Cremers and Petajisto as to what extent an active (non-index) fund is indeed “active”. This is because whilst standard metrics such as Tracking Error look at the variability of performance difference, active share looks at to what extent the weight of the holdings within a fund are different to the weight of the holdings within the corresponding index. The higher the Active Share, the more likely the fund is “True Active”. The lower the Active Share, the more likely the fund is a “Closet Index”. How can you define “closet indexing”? There has been some speculation as to what methodology the Financial Conduct Authority (FCA) used to deem funds a “closet index”. In this respect, the European Securities and Markets Authority (ESMA), the pan-European regulator’s 2016 paper may be informative. Their study applied a screen to focus on funds with 1) assets under management of over €50m, 2) an inception date prior to January 2005, 3) Fees of 0.65% or more, and 4) were not marketed as index funds. Having created this screen, ESMA ran three metrics to test for a fund’s proximity to an index: active share, tracking error and R-Squared. On this basis, a fund with low active share, low tracking error and high R-Squared means it is very similar to index-tracking fund. Based on ESMA’s criteria, we estimate that between €400bn and €1,200bn of funds available across the EU could be defined as “closet index” funds. That’s a lot of wasted fees. Defining “true active” We believe there is an essential role to play for “true active”. By this we mean high conviction fund strategies either at an asset allocation level. True active (asset allocation level): at an asset allocation level, hedge funds which have the ability to invest across assets and have the ability to vary within wide ranges their risk exposure (by going both long and short and/or deploying leverage) would be defined as “true active”. Target Absolute Return (TAR) funds could also be defined as true active given the nature of their investment process. Analysing their performance or setting criteria for performance evaluation is outside the scope of this book. However given the lacklustre performance both of Hedge Funds in aggregate (as represented by the HFRX index) and of Target Absolute Return funds (as represented by the IA sector performance relative to a simple 60/40 investment strategy), emphasises the need for focus on manager selection, performance consistency and value for money. True active (fund level): we would define true active fund managers as those which manage long-only investments, either in hard-to-access asset classes or those which manage investments in readily accessible asset classes but in a successfully idiosyncratic way. It is the last group of “active managers” that face the most scrutiny as their investment opportunity set is identical to that of the index funds that they aim to beat. True active managers in traditional long-only asset classes must necessarily take an idiosyncratic non-index based approach. In order to do so, they need to adopt one or more of the following characteristics, in our view:
Their success, or otherwise, will depend on the quality of their skill and judgement, the quality of their internal research resource, and their ability to absorb and process information to exploit any information inefficiencies in the market. True active managers who can consistently deliver on objectives after fees will have no difficulty explaining their skill and no difficulty in attracting clients. By blending an ETF portfolio with a selection of true active funds, investors can reduce fees on standard asset class exposures to free up fee budget for genuinely differentiated managers. Summary In conclusion, “active” and “passive” are lazy terms. There is no such thing as passive. There is static and dynamic asset allocation, there is systematic and non-systematic tactical allocation, there is index-investing and non-index investing, there are traditional index weighting and alternative index weighting schemes. The use of any or all of these disciplines requires active choices by investors or managers.  What kind of investor are you: a stock selector, a manager selector or an index investor?
In this series of articles, I look at some of the key topics explored in my book “How to Invest With Exchange Traded Funds” that also underpin the portfolio design work Elston does for discretionary managers and financial advisers. In previous articles, we looked at things to consider when designing a multi-asset portfolio. Let’s say, for illustration, an investor decides on a balanced portfolio invested 60% in equities and 40% in bonds. The “classic” 60/40 portfolio. You now have a number of options of how to populate the equity allocation within that portfolio. We look at each option in turn. Equity exposure using direct equities: “the stock selectors” This is the original approach, and, for some, the best. We call this group “Stock Selectors”: investors who prefer to research and select individual equities and construct, monitor and manage their own portfolios. To achieve diversification across a number of equities, a minimum of 30 stocks is typically required (at one event I went to for retail investors I was slightly nervous when it transpired that most people attending held fewer than 10 stocks in their portfolio). Across these 30 or more stocks, investors should give due regards to country and sector allocations. Some golden rules of stock picking would include:
The advantage of investing in direct equities is the ability to design and manage your own style, process and trading rules. Also by investing direct equities there are no management fees creating performance drag. But when buying and selling shares, there are of course transactional, and other frictional costs, such as share dealing costs and Stamp Duty. The most alluring advantage of this approach is the potential for index-beating and manager-beating returns. But whilst the potential is of course there, as with active managers, persistency is the problem. The more developed markets are “efficient” which means that news and information about a company is generally already priced in. So to identify an inefficiency you need an information advantage or an analytical advantage to spot something that most other investors haven’t. Ultimately you are participant in a zero-sum game, but the advantage is that if you can put the time, hours and energy in, it’s an insightful and fascinating journey. The disadvantage of direct equity is that if it requires at least 30 stocks to have a diversified portfolio, then it requires time, effort and confidence to select and then manage those positions. The other disadvantage is the lack of diversification compared to a fund-based approach (whether active or passive). This means that direct investors are taking “stock specific risks” (risks that are specific to a single company’s shares), rather than broader market risk. In normal markets, that can seem ok, but when you have occasional outsize moves owing to company-specific factors, you have to be ready to take the pain and make the decision to stick with it or to cut and run. What does the evidence say? The evidence suggests that, in aggregate, retail investors do a poor job at beating the market. The Dalbar study in the US, published since 1994, compares the performance of investors who select their own stocks relative to a straightforward “buy-and-hold” investment in an index funds or ETF that tracks the S&P500, the benchmark that consists of the 500 largest traded US companies. The results consistently show that, in aggregate, retail investors fare a lot worse than an index investor. Reasons for this could be for a number of reasons, including, but not limited to:
But selecting the “right” 30 or more stocks is labour-intensive, and time-consuming. So if you enjoy this and are confident doing this yourself, then there’s nothing stopping you. Indeed, you may be one of the few who can, or think you can, consistently outperform the index year in, year out. But it’s worth remembering that the majority of investors don’t manage to. For most people, a direct equity/direct bond portfolio is overly complex to create, labour intensive to manage and insufficiently diversified to be able to sleep well at night. Furthermore owning bonds directly is near impossible owing to the high lot sizes. So why bother? Investors who want to leave stock picking to someone else have two options to be “fund” investors selecting active funds. Or “index” investors selecting passive funds. Equity exposure using active funds: the “manager selectors” A fund based approach means holding a single investment in fund which in turn holds a large number of underlying equities, or bonds, or both. Investor who want to leave it to an expert to actively pick winners and avoid losers can pick an actively managed fund. We call this group “Manager Selectors”. But then you have to pick the “right” actively managed fund, which also takes time and effort to research and select a number of equity funds from active managers, or seek out “star” managers who aim to consistently outperform a designated benchmark for their respective asset class. And whilst we all get reminded that past performance is not an indicator of future performance, there isn’t much else to go by. In this respect access to impartial independent research and high quality,unbiased fund lists is an invaluable time-saving resource. The advantage of this approach that with a single fund you can access a broadly diversified selection of stocks picked by a professional. The disadvantage of this approach is that management fees are a drag on returns and yet few funds persistently outperform their respective benchmark over the long-run raising the question as to whether they are worth their fees. This is evidenced in a quarterly updated study known as the SPIVA Study, published by S&P Dow Jones Indices, which compares the persistency of active fund performance relative to asset class benchmarks. For efficient markets, such as US & UK equities, the results are usually quite sobering reading for those who are prefer active funds. Indeed many so-called active funds have been outed as “closet index-tracking funds” charging active-style fees, for passive-like returns. So of course there are “star” managers who are in vogue for a while or even for some time. But it’s more important to make sure a portfolio is properly allocated, and diversified across managers, as investors exposed to Woodford found out. In my view, an all active fund portfolio is overly expensive for what it provides. Whilst the debate around stock picking will run and run (and won’t be won or lost in this article), consider at least the bond exposures within a portfolio. An “active” UK Government Bond fund has the same or similar holdings to a “passive” index-tracking UK Government Bond fund but charges 0.60% instead of 0.20%, with near identical performance (except greater fee drag). Have you read about a star all-gilts manager in the press? Nor have I. So why pay the additional fee? What about hedge funds? Hedge funds come under the “true active” category because overall allocation exposure can vary greatly, and there is the ability to position a fund to benefit from falls or rises in securities or whole markets, and the ability to borrow money to invest more than the fund’s original value. But most “true active” hedge funds are not available to retail investors who are more limited to traditional “long-only” retail funds for each asset class. Equity exposure using index funds: the “index investor” Investors who don’ want the time, hassle or cost of picking active managers, or believe that markets are “efficient” often use passive index-tracking funds. We call this group “Index Investors” (full disclosure: I am a member of this group!). These are investors who want to focus primarily on getting the right asset allocation to achieve their objectives, and implement and actively manage that asset allocation but using low cost index funds and/or index-tracking ETFs. The advantage of this approach is transparency around the asset mix, broad diversification and lower cost relative to active managers. The disadvantage of this approach is that it sounds, well, boring. Ignoring the news on companies’ share prices are up or down and which single-asset funds are stars and which are dogs would mean 80% of personal finance news and commentary becomes irrelevant! On this basis, my preference is to be a 100% index investor – the asset allocation strategy may differ for the different objectives between my parents, myself and my kids. But the building blocks that make up the equity, bond and even alternative exposures within those strategies can all index-based. A blended approach Whilst my preference is to be an index investor, I don’t disagree, however, that it’s interesting, enjoyable and potentially rewarding for some retail investors and/or their advisers to spend time choosing managers and picking stocks, where they have high conviction and/or superior insight. Traditionally the bulk of retail investors were in active funds. This is extreme. More and more are becoming 100% index investors: this is also extreme. There’s plenty of ground for a common sense blended approach in the middle. For cost, diversification and liquidity reasons, I would want the core of any portfolio to be in index funds or ETFs. I would want the bulk of my equity exposure to be in index funds, with moderate active fund exposure to selected less efficient markets (for example) small caps, and up to 10% in a handful of direct equity holdings that you follow, know and like. What would a blended approach look like for a 60/40 equity/bond portfolio? 60% equity of which Min 70% index funds/ETFs Max 20% active funds Max 10% direct equity “picks”/ideas 40% bonds of which 100% index funds Summary For most investors, investing is something that needs to get done, like opening a bank account. If you are in this group then using a ready-made model portfolio or low-cost multi-asset fund, like a Target Date Fund, may make sense. For some investors, investing is more like a hobby – something that you are happy to spend time and effort doing. If you are in this group, you have to decide if you are a Stock Selector, Manager Selector or Index Investor, or a blend of all three, and research and build your portfolio accordingly. 
Focus on index methodology Methodology is the genetic code of an index. The rules that govern how an index is constructed determines what’s in it, at what weights, and therefore how it will perform in relation to the performance of all its components. A handful of (mainly older) indices are price-weighted indices (such as the DJIA (in the US, since 1896), FT30 (in the UK, since 1935), and Nikkei 225 (in Japan, since 1950). This means the weight of each stock in the index is determined by its price relative to the summed prices of all the constituents of the index. The bulk of the most familiar, and most tracked, indices are capitalisation-weighted indices. This means the weight of each stock in the index is determined by its (often free-float-adjusted) market capitalisation relative to the aggregated market capitalisation of all the constituents of the index. This leads to one of an oft-cited critique of mainstream indices that they become “pro-cyclical”: namely, they allocate an increasing weight to the best performing stocks, and a decreasing weight to the worst performing stocks. This is true, but is coloured by your view as to which comes first, the stock performance chicken, or the index performance egg. Looking at concentration risk What is certainly true is that changes in company capitalisation can create significant stock concentrations in mainstream indices. For example, the top 5 holdings in the S&P 500 (Apple, Microsoft, Amazon, Alphabet and Facebook) currently represent 21.6% of that index. The top 30 stocks represent 44.6%, and the top 100 stocks represent 69.9%. The remaining 400 stocks are a long tail of relatively smaller companies whose individual change in value will not materially impact the overall index performance. Fig.1. S&P500 Concentration 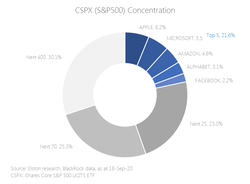 Size-bias is a choice not an obligation Index concentration, and related “size-bias”, the relative over-weighting of the largest companies, is however a choice, not an obligation for index investors. The existence of equal-weight indices enable a less concentrated exposure to the same components of an index. Whilst this solves the stock concentration risk, it creates a “Fear of Missing Out risk” when those large stocks are doing well. So, if choosing to use an equal-weighted index to reduce dependency on a concentrated index, communication is key. Reducing stock-specific risk may be welcome with end clients in theory, but clear messaging is required to explain that investment performance will not be comparable to the performance of funds (whether active or passive) using traditional capitalisation weighted benchmarks. End investors may feel they miss out when sentiment in the largest names is strong. But will be relieved when the reverse applies. On the basis that many investors are asymmetrically loss-averse, the more evenly distributed stock risk of an equal-weighted index could be something to consider. But only once any potential “Fear of Missing Out” has been discussed and addressed. Fig.2. S&P 500 vs S&P 500 Equal Weight, YTD Performance (USD terms); Fig.3. & FTSE 100 vs FTSE 100 Equal Weight, YTD Performance (GBP terms) 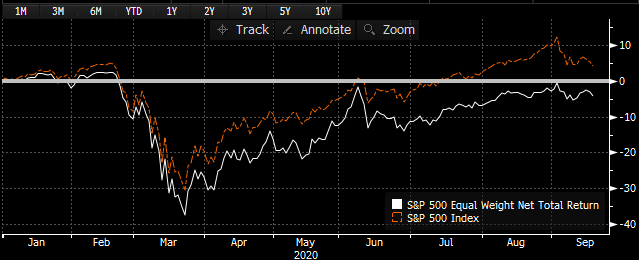 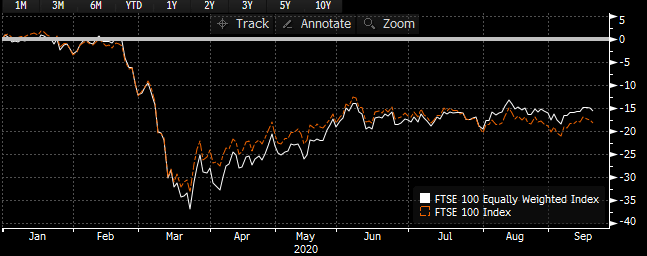 Source: Elston Research, Bloomberg data, as at 18-Sep-20
Index selection is an active choice There’s no such thing as passive. Index investing is about adopting a systematic, rules-based approach to stock selection. There is an active choice to be made around methodology and index selection. If you don’t want to always hold the largest stocks, then don’t use a cap-weighted index. If you want to hold stocks based on other criteria – their earnings, their dividends, their style, or just equally weighted – there are plenty of other indices to choose from. It’s up to the index investor to make that active choice.  While there are no shortage of limitations and no “right” answers, portfolio theory nonetheless remains, rightly, the bedrock of traditional multi-asset portfolio design.
In this series of articles, I look at some of the key topics explored in my book “How to Invest With Exchange Traded Funds” that also underpin the portfolio design work Elston does for discretionary managers and financial advisers. Portfolio theory in a nutshell Portfolio theory, in a nutshell, is a framework as to how to construct an “optimised” portfolio using a range of asset classes, such as Equities, Bonds, Alternatives (neither equities nor bonds) and Cash. An “optimised” portfolio has the highest unit of potential return per unit of risk (volatility) taken. The aim of a multi-asset portfolio is to maximise expected portfolio returns for a given level of portfolio risk, on the basis that risk and reward are the flipside of the same coin. The introduction of “Alternative” assets, that are not correlated with equities or bonds (so that one “zigs” when the other “zags”), helps diversify portfolios, like a stabilizer. Done properly, this can help reduce portfolio volatility to less than the sum of its parts. Whilst the framework of Modern Portfolio Theory was coined by Nobel laureate Harry Markowitz in 1952, the key assumptions for portfolios theory – namely which asset classes, their returns, risk and correlations are, by their nature, just estimates. So using portfolio theory as a guide to designing portfolios is only as good as the quality of the inputs assumptions selected by the user. And those assumptions are ever-changing. Furthermore, the constraints imposed when designing or optimising a portfolio will determine the end shape of the portfolio for any given optimisation. And those constraints are subjective to the designer. So portfolio design is part art, part science, and part common sense. Whilst there are no shortage of limitations and no “right” answers, portfolio theory nonetheless remains, rightly, the bedrock of traditional multi-asset portfolio design. What differentiates multi-asset portfolios? A portfolio’s asset allocation is the key determinant of portfolio outcomes and the main driver of portfolio risk and return. Ensuring the asset allocation is aligned to an appropriate risk-return objective is therefore essential. Getting and keeping the asset allocation on track for the given objectives and constraints is how portfolio managers – whether of model portfolios or of multi-asset funds – can add most value for their clients. There are no “secrets” to asset allocation in portfolio management. It is perhaps one of the most well-studied and researched fields of finance. Stripping all the theory down to its bare bones, there are, in my view, three key decisions when designing multi-asset portfolios:
Strategic allocation is expected to answer the key questions of what are a portfolio’s objectives, and what are its constraints. The mix of assets is defined such as to maximise the probability of achieving those objectives, subject to any specified constraints. Objectives can be, for example:
Strategic allocations should be reviewed possibly each year and certainly not less than every 5 years. This is because assumptions change over time, all the time. Static vs Dynamic One of the key considerations when it comes to managing an allocation is to whether to adopt a static or dynamic approach. A strategy with a “static” allocation, means the portfolios is rebalanced periodically back to the original strategic weights. The frequency of rebalancing can depend on the degree of “drift” that is allowed, but constrained by the frictional costs involved in implementing the rebalancing. A strategy with a “dynamic” approach, means the asset allocation of the portfolios changes over time, and adapts to changing market or economic conditions. Dynamic or Tactical allocation, can be either with return-enhancing objective or a risk-reducing objective or both, or optimised to some other portfolio risk or return objective such as income yield. For very long-term investors, such as endowment funds, a broadly static allocation approach will do just fine. Where very long-term time horizons are involved, the cost of trading may not be worthwhile. As time horizons shorten, the importance of a dynamic approach becomes increasingly important. Put simply, if you were investing for 50 years, tactical tweaks around the strategic allocation, won’t make as big a difference as if you were investing for just 5 years. This is because risk (as defined by volatility) is different for different time frames, and is higher for shorter time periods, and lower for longer time periods. In a way this is also just common sense. If you are saving up funds to buy a house, you will invest those funds differently if you are planning to buy a house in 3 years or 30 years. Time matters so much as it impacts objectives and constraints, as well as risk and return. Access Preferences Managers need to make implementation decisions as regards how they access particular asset classes or exposures – with direct securities, higher cost active/non-index funds, or lower cost passive/index funds and ETFs. Fund level due diligence as regards underlying holdings, concentrations, round-trip dealing costs and internal and external fund liquidity profiles are key in this respect. The choice between direct equities, higher cost active funds or lower cost index funds is a key one and is the subject of a later article. Types of multi-asset strategy There is a broad range of multi-asset strategies available to investors, whose relevance depends on the investor’s needs and preferences. To self-directed investors, these multi-asset portfolios are made easier to access and monitor through multi-asset funds, many of which are themselves constructed wholly or partly with index funds and/or ETFs. We categorise multi-asset funds into the following groups (using our own naming conventions based on design: these do not exist as official “multi-asset sectors”, unfortunately): Relative Risk Relative risk strategies target a percentage allocation to equities so the risk and return of the strategy is in consistent relative proportion the (ever-changing) risk and return of the equity markets. This is the most common approach to multi-asset strategies. Put differently, asset weights drive portfolio risk. Examples include Vanguard LifeStrategy, HSBC Global Strategy and other traditional multi-asset funds. Target Risk Target risk strategies target a specific volatility level or range. This means the percentage allocation to equities is constantly changing to preserve a target volatility band. Put differently, portfolio risk objectives drive asset weights. Examples of this approach include BlackRock MyMap funds. Target Return Target return strategies target a specific return level in excess of a benchmark rate e.g. LIBOR, and take the required risk to get there. This is good in theory for return targeting, but results are not guaranteed. Examples of this approach include funds in the Target Absolute Return sector, such as ASI Global Absolute Return. Target Date Target Date Funds adapt an asset allocation over time from higher risk to lower, expecting regular withdrawals after the target date. This type of strategy works as “ready-made” age-based fund whose risk profile changes over time. Examples of target date funds include Vanguard Target Retirement Funds, and the Architas BirthStar Target Date Funds (managed by AllianceBernstein)*. Target Income Target income funds target an absolute level of income or a target distribution yield. Examples of this type of fund include JPMorgan Multi-Asset Income. Target Term Funds These exist in the US, but not the UK, and are a type of fund that work like a bond: you invest a capital amount at the beginning, receive a regular distribution, and then receive a capital payment at the end of the target term. For self-directed investors, choosing the approach that aligns best to your needs and requirements, and then selecting a fund within that sub-sector that has potential to deliver on those objectives – at good value for money – is the key decision for building a robust investment strategy. The (lack of) secrets The secret is, there are no secrets. Good portfolio design is about informed common senses. It means focusing on what will deliver on portfolio objectives and making sure those objectives are clearly identifiable by investors. Designing and building your own multi-asset portfolio is interesting and rewarding. Equally there are a range of ready-made options to chose from. The most important question is to consider to what extent a strategy is consistent with your own needs and requirements. * Note: funds referenced do not represent an endorsement or personal recommendation. Disclosure: until 2015, Elston was involved in the design and development of this fund range, but now receives no commercial benefit from these funds.  In this series of articles, I look at some of the key topics explored in my book “How to Invest With Exchange Traded Funds” that also underpin the portfolio design work Elston does for discretionary managers and financial advisers.
Aligning investment strategy with objectives Investing can be defined as putting capital at risk of gain or loss to earn a return in excess of what can be received from a risk-free asset such as cash or a government bond over the medium-to long-term. There can be any number of motives for investing: it could be to fund a future retirement via a SIPP, or to fund future university fees via a JISA. Online tools and calculators can help estimate how much is required to invest today to fund goals in the future. Investors can target a particular return, but learn to understand that the higher the required return, the higher the required level of portfolio risk. Risk and return are the “ying and yang” of investment. You can’t get one without the other. Total return can be broken down into income yield (dividends from equities and interest from bonds) and capital growth. In the UK, income and gains are taxed at different rates. If investing within a tax-efficient account, like a SIPP or an ISA, then income and gains are tax-free. If investing outside a tax-efficient account, investors must also then consider in their objectives how they want to receive total return – with a bias towards income or with a bias towards growth. Given the majority of DIY investors are able to make use of tax-efficient accounts, there is less need to consider income or growth, with many investors opting to focus on Total Returns and to use funds that offer “Accumulating” units that reinvest income, and reflect a fund’s total return. How then to build a portfolio to deliver an appropriate level of risk-return? What matters most when investing? For the purposes of these articles, I assume that readers need no reminder of the basic checklist of investing: to start early, to maximise allowances, keep topping up regularly, and to keep costs down. Then comes the key decision – what to invest in. The main driver of portfolio risk and return is not which stocks or equity funds are within a portfolio, but what the proportion is between higher risk-return assets such as equities, and lower risk-return assets such as shorter duration bonds. Put simply, whether to invest 20%, 60% or 100% of a portfolio in equities, will have a greater impact on overall portfolio returns, than the selection of shares or funds within that equity allocation. For example, when making spaghetti Bolognese, the ratio between spaghetti and Bolognese impacts the “outcome” of the overall meal, more than how finely chopped the onions are within the Bolognese recipe. While this may seem obvious, it gets lost in all the noise and news that focuses on hot stocks, star managers and performance rankings. For those that want to back up common sense with academic theory, the academic articles most referenced that explore this topic are Brinson Hood & Beebower (1986), Ibboton & Kaplan (2000), and Ibbotson, Xiong, Idzorek & Cheng (2010), all referenced and summarised in my book. Building a multi-asset portfolio to an optimised asset allocation to align to a particular risk-return objectives sounds like hard work and it is. That’s why multi-asset funds exist. The rise of multi-asset funds As investing becomes more accessible to more people, there is less interest in the detail of how investments work and more interest in portfolios that get people from A to B, for a given level of risk-return. After all, there are fewer people who are interested in the detail of how engines work than there are who are interested in how a car looks, how it drives and what they need it for. There is nothing new about multi-asset funds, indeed one could argue that the earliest investment trust Foreign & Colonial Investment Trust, founded in 1868, invested in both equities and bonds "to give the investor of moderate means the same advantages as the large capitalists in diminishing the risk by spreading the investment over a number of stocks”. In the unit trust world, managed balanced funds have been around for decades. I would define a multi-asset fund as a strategy that invests across a diversified range of asset classes to achieve a particular asset allocation and/or risk-return objective. They offer a ready-made “portfolio within a fund” thereby enabling a managed portfolio service for the investor from a minimum regular investment of £25 per month. . In this respect, multi-asset funds help democratise investing, and make the hardest part of the investor’s checklist – how to construct and manage a diversified portfolio. The different types of multi-asset fund available is a topic in itself. The ability for investors to select a multi-asset fund for a given level or risk-return characteristics for a given time frame is one of the most straightforward ways to implement a strategy once that has been aligned to a given set of objectives. Multi-Asset Fund or ETF Portfolio? The main advantage of a ready-made multi-asset fund is convenience. Asset allocation, and portfolio construction decisions are made by the fund provider. The main advantages of an ETF Portfolio are timeliness, cost and flexible. ETF Portfolios are timely. You can adjust positions the same day without 4-5 day dealing cycles associated with funds – an important feature in volatile times. ETF portfolios are good value. You can construct a multi-asset ETF portfolio for a lower cost than even the cheapest multi-asset fund. ETF Portfolio are flexible – you can tilt a core strategy to reflect your views on a particular region (e.g. US or Emerging Markets), sector (e.g. healthcare or technology), theme (e.g. sustainability or demographics), or factor (e.g. momentum or value), to reflect your views based on your research. Conclusion Setting the right objectives to meet a target financial outcome, such as funding future retirement, university fees, or creating a rainy day fund is the primary consideration when making an investment plan. Getting the asset allocation right – choosing a risk profile – in a way best suited to deliver that plan is the second most important decision. Finding a straight forward to deliver that risk-return profile, by building your own ETF portfolio or using a ready-made multi-asset index fund, is the final most important step. All the while, it makes sense to stick to the investing checklist: to start early, keep topping up, and keep costs down. In this series of articles, we look at some of the key topics explored in my book “How to Invest With Exchange Traded Funds” that also underpin the portfolio design work we do for discretionary managers and financial advisers.
From space pens to pencils There’s a famous story, probably an urban myth, about NASA spending millions of dollars of research to develop a space pen whose ink could still flow in a zero gravity environment. When the Russians were asked whether they planned to respond to the challenge to enable their cosmonauts be able to write in space, they answered “We just use a pencil.” Sometimes sensible and straightforward answers to problems prove more durable than more elaborate and costly alternatives. The same could be said of investments. The quest for high-cost star-managers in the hope of alchemy, is under pressure from low-cost index funds that get the job done, by giving low cost, transparent, and liquid exposure to a particular asset class. How an active stock picker became a passive enthusiast I spent my early years in the City working for active managers. My job was to pick stocks based on proprietary models of those companies’ operating and financial models. I was fortunate enough to work in a very successful hedge fund, whose style was “true active”: it could be highly concentrated on high conviction stocks, it could be long or short a stock or a market, it could (but didn’t) use leverage. If you enjoy stockpicking, as I did, working for a relatively unconstrained mandate was at times highly rewarding, at times highly stressful and always interesting. Investors, typically large institutions, who wanted access to this strategy, had to have deep pockets to wear the very high minimum investment, and the fund was not always open for new investors. It certainly wasn’t available to the man on the street. Knowledge gap entrenches disadvantage When I started my own family and started investing a Child Trust Fund I became all too aware of the massive disconnect and difference between the investment opportunities open to hundreds of institutional investors and those available to millions of ordinary individual retail investors. I was staggered and rather depressed to see how few people in the UK harness the power of the markets to increase their long-term financial resilience. Of the 11m ISA accounts held by 30m working adult, only 2m are Stocks and Shares ISAs. The investing public is a narrow audience. The vast majority is put off from learning to or starting to invest by complexity, jargon and unfamiliarity. Casual conversations with people from all walks of life showed that whilst they may fall prey to some scheme that promised unrealistic returns, they were less inclined to put a “boring” checklist in place to contribute to their own ISA or Junior ISA, perhaps unaware that this could be done for less than the cost of a coffee habit at £25 per month. The lack of knowledge on investing was nothing to do with gender, age or education. It was almost universal. People either knew about investments or they didn’t. And that knowledge was usually hereditary. And it entrenches disadvantage. Retail investments need a shake up Looking at the retail fund industry, it was clear that there wasn’t much that was truly “active” about it. Most long-only retail managers hugged benchmarks for chunky fees that befitted their brand or status (now known as “closet indexing”). Until recently, the bulk of personal finance pages and investment journalism was more about a quest for a handful of “star managers”, in whatever asset class, who were ascribed the status of an alchemist, that investors would then herd towards. It seemed like the retail fund industry was focused on solving the wrong problem: on how to find the next star manager, rather than how to have a sensible, robust diversified portfolio. By contrast, in the US, there has always been a higher culture of equity investing (New York cabbies talk more about stocks than about sport, in my experience). So I was fascinated to read about the behavioural science that underpinned the roll out of automatic enrolment in the USA in 2005 where investors who were not engaged with their pensions plan were defaulted into a Target Date Fund – a multi-asset index fund whose mix of assets changes over time, according to their expected retirement date. I also read about the mushrooming of so-called “ETF Strategists”, investment research firms that put together ultra-low cost managed portfolios for US financial advisers built entirely with Exchange Traded Funds. Winds of change Conscious of these emerging trends, it seemed that mass market investing in the UK was about to enter a period of structural change: namely with the ban of fund commissions (Retail Distribution Review), and the launch of automatic enrolment, as well as other planned “behavioural finance” interventions to improve savings rates and financial capability. So in 2012, I set up my own research firm to see what, if any, of that experience in the US might apply in the UK. We work with asset managers to develop low-cost multi-asset investment strategies for the mass market, constructed with index-tracking funds and ETFs. It is bringing the rather dry science of institutional investing into the brand-rich and personality-heavy world of personal investing. Why index investing? I try and avoid the terms active and passive and will explain why. For most people, a multi-asset approach using index funds makes sense. This can be called “index investing”. Surprisingly, one of it’s biggest supporters is Warren Buffett. “Consistently buy a low cost…index fund. I think it’s the thing that makes the most sense practically all of the time…Keep buying through thick and thin, and especially through thin.” (Warren Buffet, Letter to shareholders, 2017) In this series of articles, I share some of the experience I have had in developing investment strategies and products for asset managers built with index funds and ETFs. I look at the concepts underpinning multi-asset investing, focus on the importance of getting the asset allocation right for a given objective, summarise my view on the active vs passive debate (and attempt to clarify some terms), as well as some practical tips on building and managing your own portfolio. Each of the articles can be explored more deeply in a book I wrote with my former colleague and co-author Shweta Agarwal on How to Invest with Exchange Traded Funds: a practical guide for the modern investor 
We look at the three largest ETPs that track the gold price and which are “physically-backed” (meaning they own the underlying asset), and track the same spot price index, the LBMA Gold Price Index. Each of these ETPs offers a London-listed share-class, and each also offers a GBP-denominated listing. This means that the share price is expressed in GBP-terms. This is convenient for client reporting and essential for some platforms. The returns, however, remain unhedged to GBP. Whilst SGLN and SGLP are Irish-domiciled funds, PHGP is Jersey domiciled. Each has UK tax reporting status. In terms of scale and cost, iShares Physical Gold ETC (Ticker: SGLN, launched in 2011) is the largest at £11.9bn with TER of 0.19%, followed by Invesco Physical Gold (Ticker: SGLP, launched in 2009) at £10.7bn with TER of 0.19%, followed by WisdomTree Physical Gold (Ticker: PHGP, launched in 2007) at £7.1bn With increasing choice available, the key differentiation amongst physically-backed ETPs is cost. Fig.1. YTD performance of largest London-listed Gold ETPs 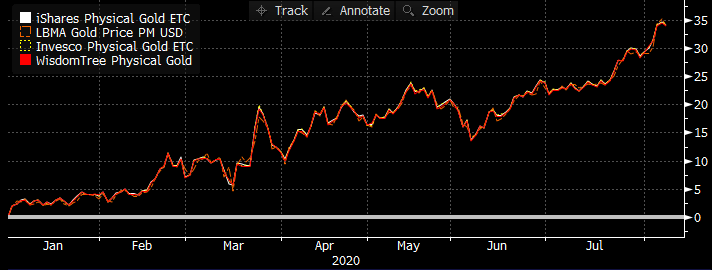 Source: Bloomberg, as at 7th August 2020, GBP terms
NOTICES Commercial Interest: Elston Consulting Limited creates research portfolios and administers indices that may or may not be referenced in this article. If referenced, this is clearly designated as such and is to raise awareness and provide purely factual information as regards these portfolios and/or indices. Image Credit: Shutterstock 
Liquid Alternatives: Assets We define Liquid Alternative Asset ETFs as tradable ETFs that hold liquid securities that provide access to a particular “alternative” (non-equity, non-bond) asset class exposure. More specifically, we define this as Listed Property Securities, Infrastructure Securities, Commodities, Gold and Listed Private Equity. Looking at selected ETF proxies for each of these asset classes, the correlations for these Liquid Alternative Assets, relative to Global Equity are summarised below. Fig.1. Liquid Alternative Assets: Correlation Matrix 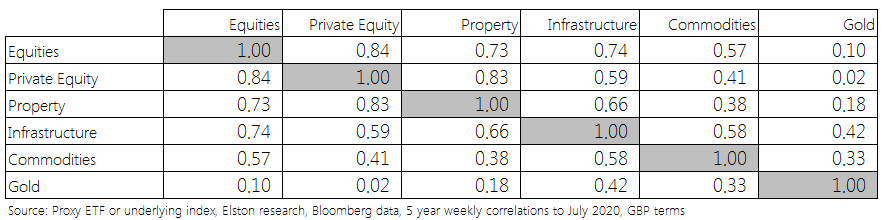 Incorporating these exposures within a multi-asset strategy provides can provide diversification benefits, both from an asset-based perspective and a risk-based perspective. Looking at 5 year annualised performance, only Gold has outperformed Global Equities. Listed Private Equity has been comparable. Meanwhile Infrastructure has outperformed property, whilst Commodities have been lack-lustre. Fig.2. Liquid Alternative Assets Returns vs Global Equities 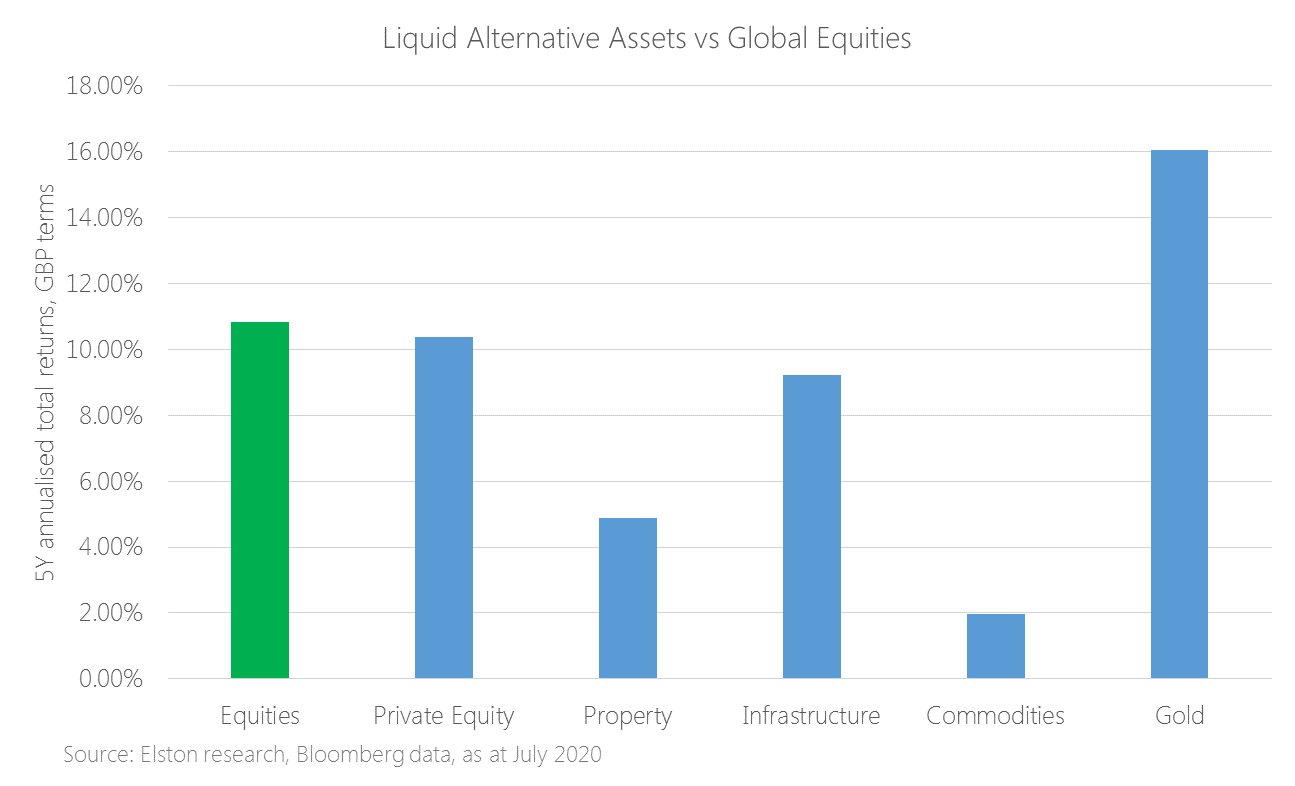 Looking at performance YTD, gold has returned +31.06% in GBP terms, outperforming Global Equities by 32.54ppt. Infrastructure has also slightly outperformed equities owing to its inflation protective qualities. Fig.3. YTD performance of Liquid Alternative Assets (GBP terms) 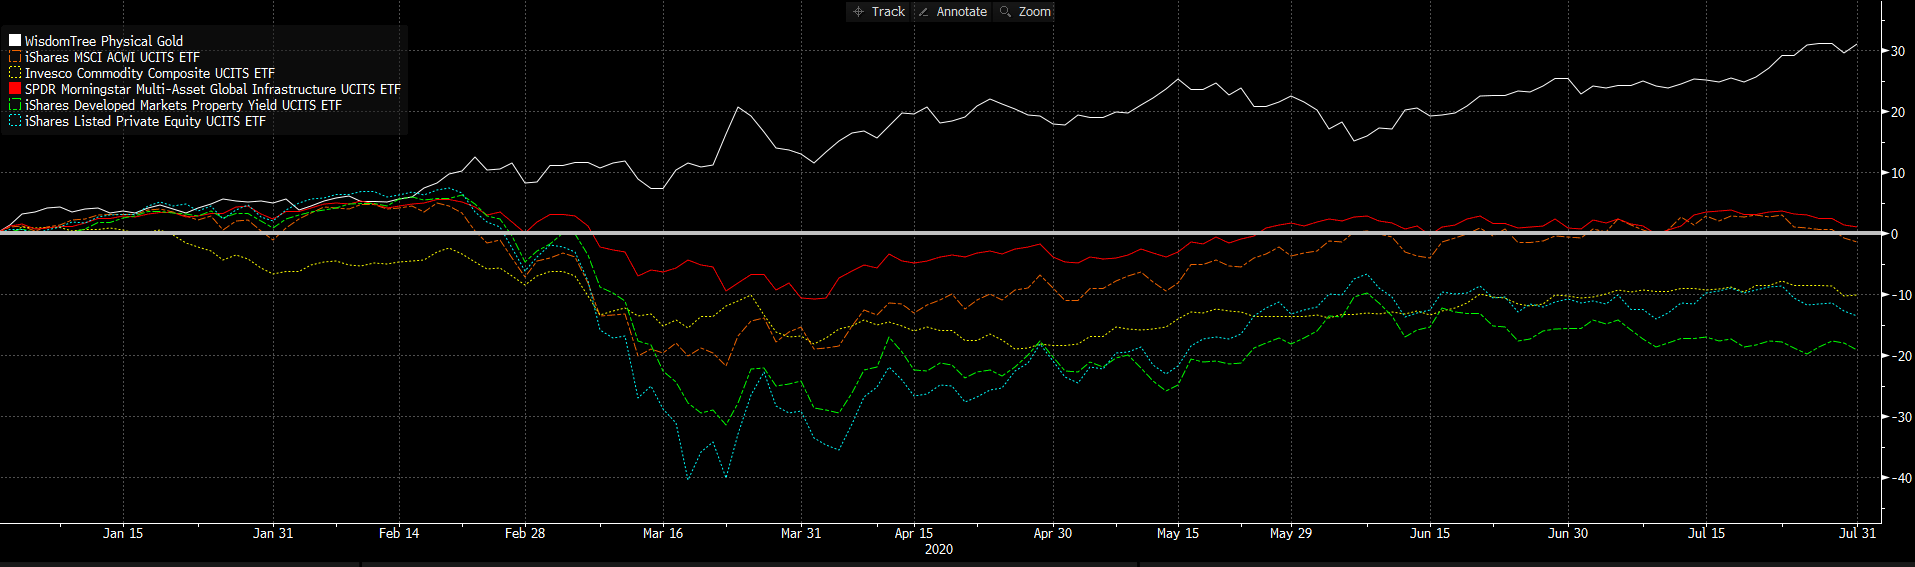 Source: Elston research, Bloomberg data Liquid Alternatives: Strategies We define Liquid Alternative Strategy ETFs as tradable ETFs that provide alternative asset allocation strategies. By providing differentiated risk-return characteristics, these ETFs should provide diversification and/or reflect a particular directional bias. Fig.4. Examples of European-listed Liquid Alternative Strategies 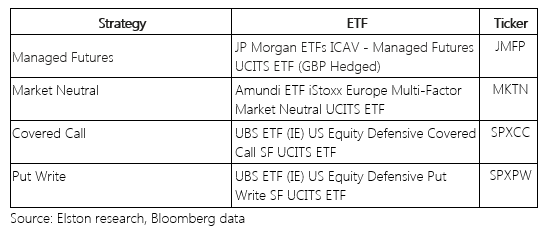 Each of these strategies provide a low degree of correlation with Global Equities and therefore have diversification benefits. Fig.5. Liquid Alternative Strategies: Correlation Matrix 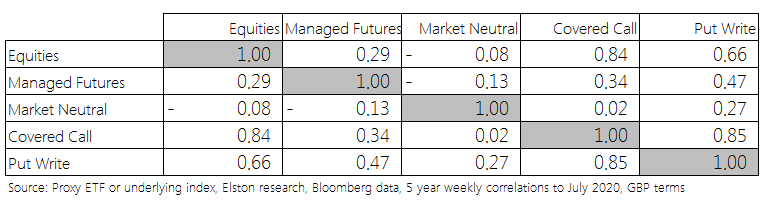 In 2020, the Market Neutral strategy has proven most defensive. Fig.6. Liquid Alternative Strategies: YTD performance 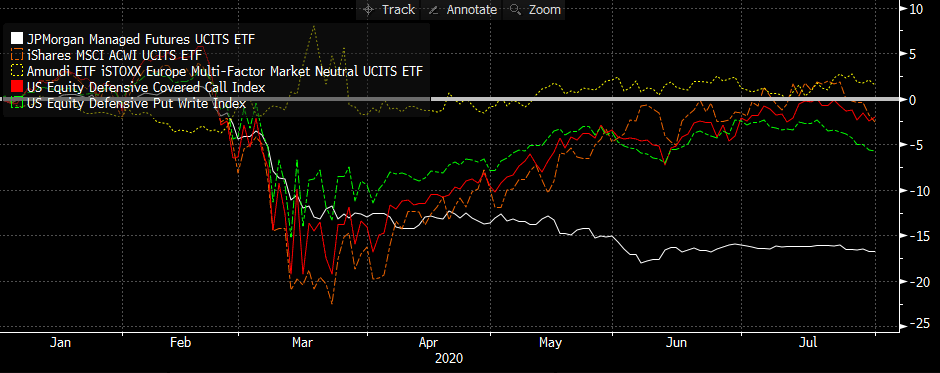 Source: Bloomberg data, GBP terms, as at July 2020 Conclusion ETFs offer a timely, convenient, transparent, liquid and low-cost way of allocating or deallocating to a particular exposure. Blending Liquid Alternative ETFs – both at an asset class level and a strategy level - provides managers with a broader toolkit with which to construct portfolios. NOTICES
Commercial Interest: Elston Consulting Limited creates research portfolios and administers indices that may or may not be referenced in this article. If referenced, this is clearly designated as such and is to raise awareness and provide purely factual information as regards these portfolios and/or indices. Image Credit: Shutterstock 
Why use options overlays? Managers of larger investment portfolios sometimes use options overlays to create an alternative payoff profile relative to a straightforward “long-only” equity holding of a share or index. This is done to reflect a particular investment view. Examples of options overlay strategies include Covered Calls and Put Writes. These strategies to protect investments when markets move sideways and there is higher potential for downside risk. This typically comes at the expense of explicit costs and foregone returns. What is a covered call strategy? A Covered Call strategy combines a holding in equities with sales of call options (an option to buy an equity at a given price within a specific time) on those equities. In other words, it can be seen as sacrificing unknown future gains on equities in exchange for a known income today. These aim is 1) to generate returns through income from those sales and 2) reduce downside risk. What is a written put strategy? A Put Write strategy combines a cash exposure with sales of put options (an option to sell an equity at a given price within a specific time) on those equities, with the aim of generating an income from option sales whilst providing a cushion during market downturns. What’s new? UBS has launched a range of four ETFs that offer a choice of two underlying exposures (S&P 500 or Euro Stoxx 50) combined with these two types of options overlay strategies to give investors access to these defensive strategies that perform better in sideways or downward markets. The ETFs available are: Fig.1. UBS UCITS ETFs incorporating options strategies 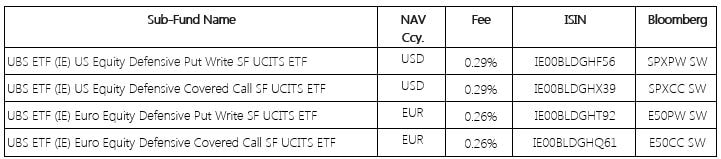 Source: Elston Research, Bloomberg data What does this launch mean for investors? The launch of these ETFs gives investors of any size the opportunity to access these options overlay strategies within a fund exposure, rather than outwith a fund exposure, meaning that they benefit from:
Not really. Covered call strategies are used to enhance the income of traditional OEICs in the “Enhanced Income” sector. Funds such as the Schroder Income Maximiser and Fidelity Enhanced Income use a covered call strategy within the fund to generate additional income at the expense for capital growth, as did Enhanced Income ETFs from BMO. But this is typically done for yield enhancement rather than as a pure defensive strategy. These UBS ETFs are not yield focus but are using that additional income to provide some cushioning. Why the ETF format? The advantage of the ETF format means that investors have the ability to allocate or deallocate to that strategy quickly and conveniently. As we saw in March, in period of heightened daily volatility, the 4-5 day dealing cycles (8-10 days for an unfunded switch) of traditional OEICs create significant and unintended market timing risk. The ETF format offers a more timely way of adding or removing a particular exposure. Who might use these? Discretionary managers and financial advisers using platforms that can access ETFs may find these strategies a useful addition to the toolkit as a Liquid Alternative strategy. Are these Liquid Alternative ETPs? Yes, we would classify them as such. But we differentiate between Liquid Alternative Asset Classes and Liquid Alternative Strategies. We would classify these ETFs as Liquid Alternative Strategies, alongside Managed Futures ETFs and Equity Market Neutral ETFs. What are the drawbacks? From a UK perspective, whilst the S&P500 product will be a useful proxy for overall market risk, it’s disappointing that there is these overlay strategies are not available for the UK’s FTSE 100 index as that would be of more appeal for UK investors, advisers and managers. Furthermore, financial advisers using traditional fund-based platforms will not be able to access these type of options overlay strategies, limiting potential usage. Performance Track record Whilst the ETFs are new, the underlying indices has been created with data back to July 2012. In the 8 years to end July 2020 in USD terms, the US Equity Defensive Covered Call Index returned +11.09%, compared to +13.71% for the S&P 500. The foregone returns being part of the cost of downside protection. By contrast, the maximum monthly drawdown (in March 2020) for the Covered Call index was -10.74%, compared to -12.51% for the S&P500, a -14% reduction in drawdown. Over the same time frame, the US Equity Defensive Put Write Index returned +3.81% compared to +2.88% for US Treasuries. By contrast, the maximum monthly drawdown (in March 2020) for the Put Write index was -8.14%. Fig.2. Performance vs selected comparators 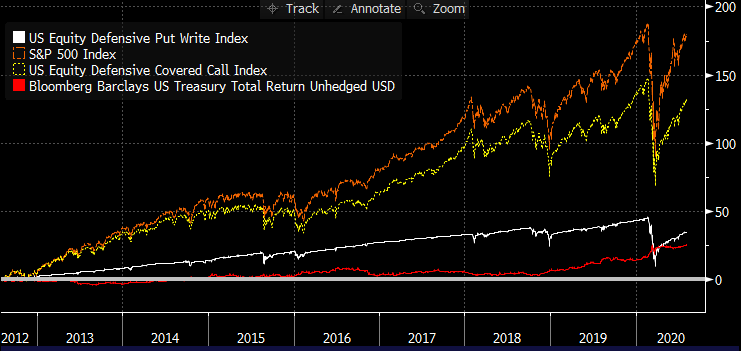 Source: Bloomberg data, 31st July 2012 to 31st July 2020, USD terms In the 1 year to July 2020, the annualised daily volatility of the Covered Call Index was 29.75% compared to 34.10% for the S&P500 (a 12.8% reduction) In more normal markets – in the 3 years to December 2019, the volatility of the Covered Call Index was 12.27% compared to 12.89% (a 4.8% reduction) Conclusion On our analysis, the Put Write index should work well in providing consistent returns in sideways markets in excess of cash/government bonds, but is not immune from severe market shocks. The Covered Call Index provides a defensive bias whilst maintaining the potential for returns from the underlying exposure. At a TER of 0.26%-0.29% the strategies are reasonably priced relative to either creating a bespoke options strategy or compared to the OCF of traditional OEICs with embedded options overlays. Nonetheless, a FTSE 100 exposure would be additionally welcome. NOTICES
Commercial Interest: Elston Consulting Limited creates research portfolios and administers indices that may or may not be referenced in this article. If referenced, this is clearly designated as such and is to raise awareness and provide purely factual information as regards these portfolios and/or indices. Image Credit: Shutterstock Liquid Alt ETPs: success for alternative asset class exposure, less so for alternative strategies9/7/2020

Following the severe market turbulence of 2020, it’s worth taking a fresh look at “Liquid Alts” within the ETF space. What are Liquid Alternative ETFs? We define Liquid Alternative ETFs as any ETF that is:
Rise in popularity post GFC The increased popularity in the US of “Liquid Alts” came after the Global Financial Crisis and related liquidity crunch. Following the crisis, there was a demand for portfolio diversifiers that were an alternative to bonds, but with a keen focus on liquidity profile of the underlying holdings. In the US, the tradability of the ETF format meant that a broad range of “Liquid Alt” ETFs were launched, providing access to asset classes such as gold, commodities, and property securities, as well as long/short and more sophisticated “active” or systematic investment strategies packaged up within an ETF. Liquid Alts became in vogue. What about Liquid Alts in the UK? First we need to distinguish between the “type” of Liquid Alts available. We distinguish between those Liquid Alts that give exposure to an alternative asset class; and those that give exposure to an alternative asset allocation strategy. In the UK, following the financial crisis, we saw the launch of ETFs that gave exposure to alternative asset classes – gold, commodities, property, listed private equity, and infrastructure, for example. In this respect, the growth – in depth and breadth – of Liquid Alts has been impressive, particularly in the commodities and property sectors. But when it comes to Liquid Alts to deliver an alternative strategy, the ETP format has not been popular: the preferred format remains daily-dealing funds. Diversifier strategies, for example absolute return funds such as GARS, systematic trading strategies, long/short funds and funds-of-structured-products, have all been typically manufactured as funds in the UK rather than exchange traded products. Reviewing the marketing in 2016, we were expecting the range of Liquid Alt strategies available to UK investors to broaden both in the mutual fund format and the ETP format. As regards mutual funds, that has proven to be the case. As regards ETPs, Liquid Alt strategies have failed to catch on. Only a handful of liquid alternative strategy ETPs were launched, and they have largely failed to gain any traction. Why is this? Whilst straightforward Liquid Alt asset class ETPs have been successful in the UK, Liquid Alt strategy ETPs have failed to gain traction in the UK for 4 reasons, in our view:
Evaluating success: complexity fails To summarise, in the UK, within the Liquid Alt ETF space, the more straightforward a product, the more traction it’s got. Importantly, the reverse applies. “Straightforward” liquid alt ETFs Straightforward liquid alt ETFs provide liquid exposure to a specific asset class, or proxy for an asset class. Fig.1. Liquid Alternative Asset Classes 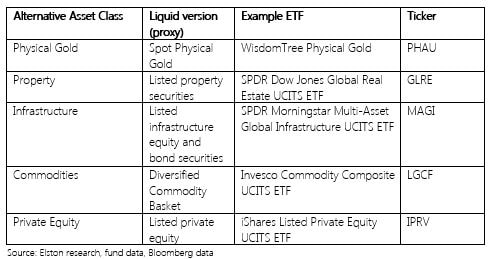 We find these “Liquid Alt” ETFs very useful building blocks to build in some diversifiers in a targeted and transparent way. “Complex” liquid alt ETFs The more complex liquid alt ETFs launched into the European market, have had far less success, and have ended up in the ETF graveyard.. Examples of complex strategies include: ETFs tracking a proxy of the HFRX Hedge Fund Index, an equity long/short ETF, and a market neutral ETF. Fig. 2. Liquid Alternative Strategies 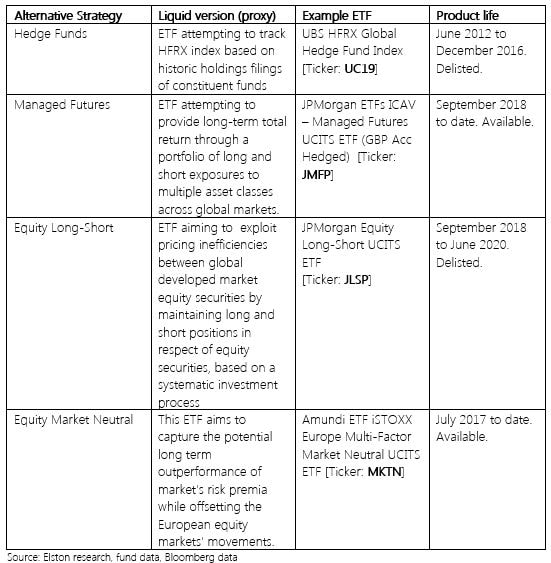 Liquidity lessons learned and relearned There were painful liquidity lessons learned in the 2008 GFC. Those liquidity lessons have been relearned for “less liquid alts” delivered by traditional fund formats, where investors were gated in direct property funds during Brexit in 2016 and Coronavirus this year. By comparison, investors who chose property securities ETFs as their “liquid” way of accessing that exposure experienced no such gating. Furthermore, the high profile gating of Woodford’s Equity Income fund and GAM absolute return bonds fund are further reminders as to why liquidity of the underlying asset, whether, within a fund or ETF, is so important. Where next? We see potential for increased competition in the single-asset class liquid alts, particularly infrastructure and listed private equity where there is little choice. Whilst we expect some ETF providers to continue to create liquid alt trading strategies, we are not convinced that ETPs are the best format for these diversifiers. Where we do expect innovation is in index-tracking funds that can be held on platform and provide a transparent, liquid and systematic approach to delivering true diversification strategies, as an alternative to opaque, higher cost absolute return funds. NOTICES Commercial Interest: Elston Consulting Limited creates research portfolios and administers indices that may or may not be referenced in this article. If referenced, this is clearly designated and is to raise awareness and provide purely factual information as regards these portfolios and/or indices. 
We are adding the Elston Maximum Deconcentration Portfolio to our suite of multi-asset risk-based strategies. The portfolio is now "live" with factsheets updated daily (portfolio ticker ESBMDC). What is "Deconcentration"? Put simply, in the context of multi-asset investing, if single asset investing is having all eggs in one basket; 60/40 investing is having all eggs in two baskets; then deconcentration is having one egg per basket. It is diversification at its simplest: giving an equal weight to each asset class within the portfolio. This portfolio construction approach is known as a "Deconcentration strategy" as it deconcentrates the portfolio from any single asset class. It is also known as a (1 over N) approach, where N is the number of holdings within the portfolio. What problem are we trying to solve? Most traditional multi-asset strategies, such as a 60/40 portfolio, have a capitalisation-weighted approach to asset allocation. Within a classic global equity benchmark, for example, the US dominates with a ~60% allocation. So within a vanilla 60/40 portfolio, US equities may have a 36% allocation (60% US exposure within 60% Global Equity allocation). Nothing wrong with that, but it's an overweight based on capitalisation. Likewise within the bond allocation rather than having a bias towards GBP issued bonds under a classic 60/40 approach. Again, nothing wrong with that, but it limits the diversification impact of international bonds. How does a max deconcentration portfolio work? One way of creating differentiated risk-returns is to ignore these size-and-domestic biases is to create a "naive" or simple diversification strategy, such as an equally-weighted multi-asset approach. We look at an opportunity set of 20 asset class exposures: regional equity markets, bonds by issuer type, maturity and currency, as well as alternatives such as gold, listed infrastructure, property securities. We then create an equal-weight allocation (1/20 = 5%) to each asset class. This portfolio thereby provides an alternative approach to multi-asset diversification with differentiated risk-return characteristics. Does it work? By default, the risk-return characteristics of a 1/N portfolio will be different to that of a traditional multi-asset portfolio, so a Max Deconcentration strategy will provide a differentiated risk-return characteristic for diversification purposes. However, there is also research to suggest that a "simple" 1/N portfolio can outperform more "sophisticated" mean-variance optimised portfolios. For more on this, see De Miguel, Garlappi and Uppal (2009) and related readings. Obviously the nuance of any 1/N portfolio will depend on its design parameters: the performance of our Max Deconcentration strategy will be included in future multi-asset strategy reviews relative to a 60/40 benchmark as well as other risk-based strategies such as Min Variance and Risk Parity. Keep updated To view peformance of this strategy, please refer to our strategy factsheets, published daily, or request portfolio access via Bloomberg. To replicate this strategy, subscribe to our Advanced Portfolios for weightings files and detialed performance analysis. |
ELSTON RESEARCHinsights inform solutions Categories
All
Archives
April 2024
|
 RSS Feed
Company |
Solutions |
|