Elston supports UK financial advisers CIP/CRP/MPS
  • WHO WE ARE
    • About
    • Our Journey
  • WHAT WE DO
    • Elston Portfolios >
      • Our Portfolios
      • Adaptive Portfolios
      • Retirement Portfolios
      • Sustainable Portfolios
      • Multi-Asset Income
      • All Weather Portfolio UK
      • Money Market Portfolio
    • Custom Portfolios >
      • Custom Portfolios
    • CGT Solutions >
      • Our CGT Solutions
      • GIA Portfolios
      • Onshore Bonds
      • Direct Gilts
    • Adviser Support >
      • Our Adviser Support
      • CIRP
      • Investment Committee Support
      • Regulatory Support
      • Analytics, Factsheets & Reporting
      • CPD
    • Fund Solutions >
      • Our Funds
      • Custom Funds
    • Index Solutions >
      • Our Indices
      • Sector Equal Weight
      • UK Equity Income
      • Liquid Real Assets
      • Gold and Precious Metals
      • Custom Indices
  • WHO WE HELP
    • Financial Advisers
    • Discretionary Managers
  • Insights
  • Contact

Asset Allocation Research for UK Advisers

Which was the best performing UK Equity Income index in 2017?

4/1/2018

 
  • In the search for yield, UK Equity Income is a key component of client portfolios.
  • There are a number of London-listed UK Equity Income ETFs to choose from, each tracking a different index methodology.
  • This report looks at the best performing UK Equity Income indices in absolute and risk-adjusted terms for GBP investors.


UK Equity Income Indices
Investors have a choice of UK Equity Income index strategies, each with different risk-return characteristics, weightings methodologies and factor tilts.
These difference influence the performance of each index strategy (all figures below are on a total return basis for GBP investors).

Best performing for 2017
The best performing strategies for UK Equity Income in 2017 were:

  1. +12.3% total return of the MSCI UK Select Quality Yield index (tracked by BMO MSCI UK Income Leaders ETF (LON:ZILK)) 
  2. +8.7% total return of the FTSE 350 ex Investment Trust Qual/Vol/Yield Factor 5% Capped Index (tracked by Lyxor FTSE UK Quality Low Vol Dividend (DR) UCITS ETF (LON:DOSH).
  3. +7.9% total return of the WisdomTree UK Equity Income Index (tracked by WisdomTree UK Equity Income UCITS ETF (LON:WUKD)

This compares to +12.3% for FTSE 100 (best tracked by HSBC FTSE 100 UCITS ETF (LON:HUKX)).

Best performing over last 3 years
The best performing strategies for UK Equity Income over the last 3 years were:

  1. +26.4% cumulative total return of the FTSE 350 ex Investment Trust Qual/Vol/Yield Factor 5% Capped Index (tracked by Lyxor FTSE UK Quality Low Vol Dividend (DR) UCITS ETF (LON:DOSH).
  2. +20.8% cumulative total return of the WisdomTree UK Equity Income Total Return Index (tracked by WisdomTree UK Equity Income UCITS ETF (LON:WUKD).
  3. +18.1% cumulative total return of the FTSE UK Dividend+ Index (tracked by iShares UK Dividend UCITS ETF (LON:IUKD).

This compares to +31.5% cumulative return for FTSE 100 (best tracked by HSBC FTSE 100 UCITS ETF (LON:HUKX)).

Fig. 1: Total Returns (Cumulative) by strategy/index (cumulative, GBP terms)
Picture
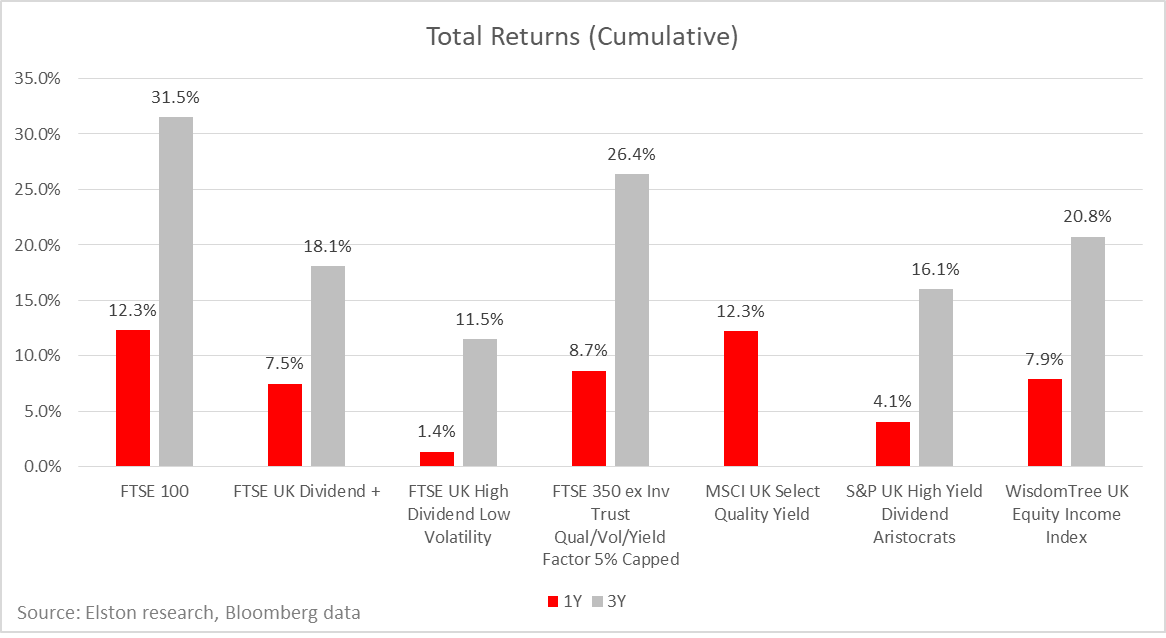
Best risk-adjusted returns
The best risk-adjusted returns in 2017 of available UK Equity Income indices was achieved by:

  1. MSCI UK Select Quality Yield index (tracked by BMO MSCI UK Income Leaders ETF), with a 1Y Sharpe ratio of 1.40
  2. FTSE 350 ex Inv Trust Qual/Vol/Yield Factor 5% Capped Index (tracked by Lyxor FTSE UK Quality Low Vol Dividend (DR) UCITS ETF) with a 1Y Sharpe ratio of 1.07
  3. WisdomTree UK Equity Income Total Return Index (tracked by WisdomTree UK Equity Income UCITS ETF) with a 1Y Sharpe ratio of 0.97.

To look at consistency of risk-adjusted returns, we have plotted 1Y Sharpe ratios vs 3Y Sharpe ratios for each UK Equity Income index strategy in Fig.2 below.

Fig.2.  1Y & 3Y Sharpe Ratios, selected UK Equity Income index strategies (GBP terms)
Picture
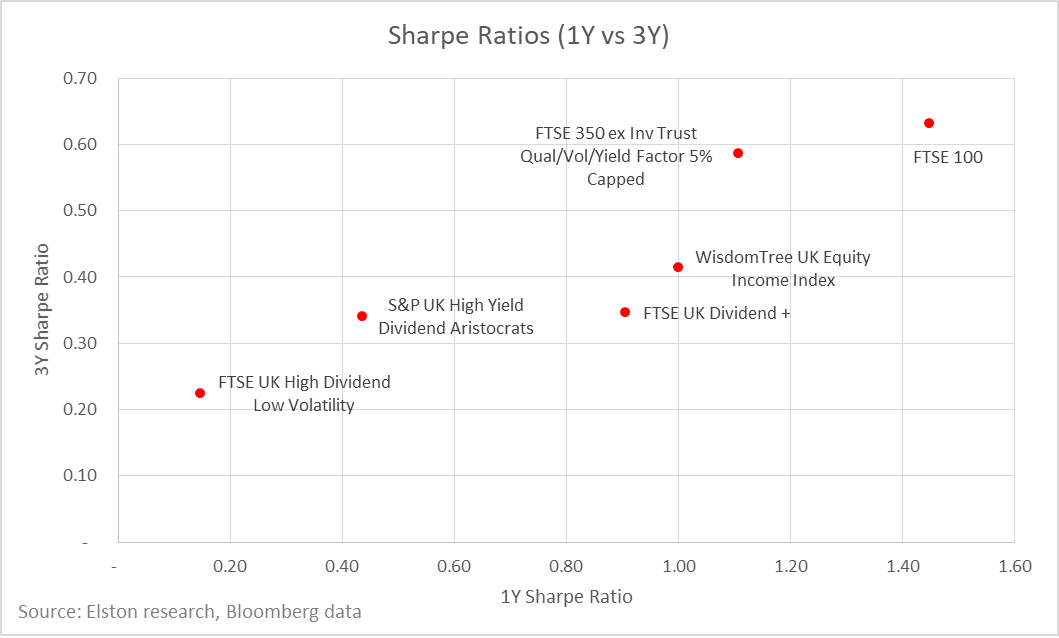
Conclusion
Different index construction methodologies has a material impact on performance outcomes – both in absolute terms and on a risk-adjusted basis.

A naïve interpretation is to consider performance in isolation, however our view is that index selection is more nuanced than that: it should relate to the objectives and constraints of individual client portfolios and the desired exposure  -  on asset-basis, risk-basis and factor-basis and the interaction between the selected strategy and the rest of a client portfolio.

Note: Scope of our comparison
For these reports, we have analysed the indices and ETFs detailed in Fig.3.

Fig. 3: UK Equity Income Indices & ETFs vs HSBC FTSE 100 UCITS ETF (LON:HUKX)
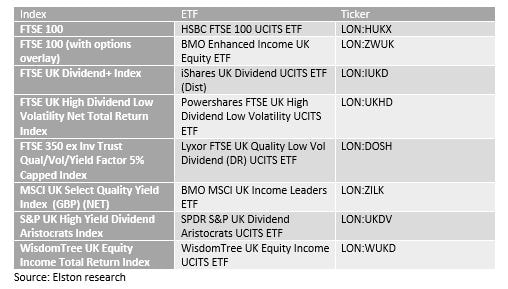
Picture
[ENDS]
NOTICES: I/we have no positions in any stocks mentioned, and no plans to initiate any positions within the next 72 hours.  I wrote this article myself, and it expresses my own opinions. I am not receiving compensation for it.
This article has been written for a US and UK audience.  Tickers are shown for corresponding and/or similar ETFs prefixed by the relevant exchange code, e.g. “NYSEARCA:” (NYSE Arca Exchange) for US readers; “LON:” (London Stock Exchange) for UK readers.  For research purposes/market commentary only, does not constitute an investment recommendation or advice, and should not be used or construed as an offer to sell, a solicitation of an offer to buy, or a recommendation for any product.  This blog reflects the views of the author and does not necessarily reflect the views of Elston Consulting, its clients or affiliates.  For information and disclaimers, please see www.elstonconsulting.co.uk
Photo credit: N/A; Chart credit: Elston Consulting; Table credit: Elston Consulting
All product names, logos, and brands are property of their respective owners. All company, product and service names used in this website are for identification purposes only. Use of these names, logos, and brands does not imply endorsement.
Chart data is as at 30-Dec-17

Comments are closed.

    ELSTON RESEARCH

    insights inform solutions

    Get our weekly newsletter

    Categories

    All
    All Weather Portfolio
    Alternative Assets
    Alternative Strategies
    Bonds
    Business Practice
    Capital Market Assumptions
    CPD
    Direct Gilts
    Equities
    Equity Income
    Equity Sectors
    ESG
    ETFs
    Evidence Based Investing
    Factor Investing
    Geopolitics
    Gold & Precious Metals
    Guide To Investing
    Index Investing
    Inflation
    Investment Trusts
    Macro
    MULTI ASSET
    Multi Asset Income
    Net Zero
    Outlook
    Permanent Portfolio
    Podcast
    Portfolio Construction
    Private Markets
    Real Assets
    Retirement Investing
    Risk Parity
    Thematic Investing
    Value Factor
    Video

    Archives

    June 2025
    May 2025
    April 2025
    March 2025
    February 2025
    January 2025
    December 2024
    November 2024
    October 2024
    September 2024
    August 2024
    July 2024
    June 2024
    May 2024
    April 2024
    March 2024
    February 2024
    January 2024
    December 2023
    November 2023
    October 2023
    September 2023
    August 2023
    July 2023
    June 2023
    May 2023
    April 2023
    March 2023
    February 2023
    January 2023
    December 2022
    November 2022
    October 2022
    September 2022
    August 2022
    July 2022
    June 2022
    May 2022
    April 2022
    March 2022
    February 2022
    January 2022
    December 2021
    November 2021
    October 2021
    September 2021
    August 2021
    July 2021
    June 2021
    May 2021
    April 2021
    March 2021
    February 2021
    January 2021
    December 2020
    November 2020
    October 2020
    September 2020
    August 2020
    July 2020
    June 2020
    May 2020
    April 2020
    March 2020
    February 2020
    January 2020
    December 2019
    November 2019
    September 2019
    June 2019
    April 2019
    March 2019
    February 2019
    January 2019
    December 2018
    November 2018
    October 2018
    September 2018
    August 2018
    July 2018
    June 2018
    May 2018
    April 2018
    March 2018
    February 2018
    January 2018
    December 2017
    November 2017
    October 2017
    July 2017
    May 2017
    March 2017
    February 2017
    January 2017
    November 2016
    October 2016
    September 2016
    July 2016
    June 2016
    May 2016
    February 2016
    January 2016
    August 2015
    June 2015
    January 2014
    June 2012

    RSS Feed

Company
Home
About
​Our Journey
​​​Contact
Terms of Use
​Our Solutions
​​Insights
​Our Portfolios
Custom Portfolios
​Retirement Portfolios
Our CGT Solutions
Our Funds
Custom Funds
Our Indices
Custom Indices
​Adviser Support
CIRP
Investment Committee Support
Regulatory Support
Analytics, Factsheets & Reporting
CPD


By client type:
For Advisers
For Discretionary Managers


© COPYRIGHT 2012-25. ALL RIGHTS RESERVED.
 Elston Consulting Limited (Company Registration Number 07125478) is registered in
England & Wales, Registered address:  1 King William Street, London EC4N 7AF
  • WHO WE ARE
    • About
    • Our Journey
  • WHAT WE DO
    • Elston Portfolios >
      • Our Portfolios
      • Adaptive Portfolios
      • Retirement Portfolios
      • Sustainable Portfolios
      • Multi-Asset Income
      • All Weather Portfolio UK
      • Money Market Portfolio
    • Custom Portfolios >
      • Custom Portfolios
    • CGT Solutions >
      • Our CGT Solutions
      • GIA Portfolios
      • Onshore Bonds
      • Direct Gilts
    • Adviser Support >
      • Our Adviser Support
      • CIRP
      • Investment Committee Support
      • Regulatory Support
      • Analytics, Factsheets & Reporting
      • CPD
    • Fund Solutions >
      • Our Funds
      • Custom Funds
    • Index Solutions >
      • Our Indices
      • Sector Equal Weight
      • UK Equity Income
      • Liquid Real Assets
      • Gold and Precious Metals
      • Custom Indices
  • WHO WE HELP
    • Financial Advisers
    • Discretionary Managers
  • Insights
  • Contact