
 [5 min read, open as pdf]
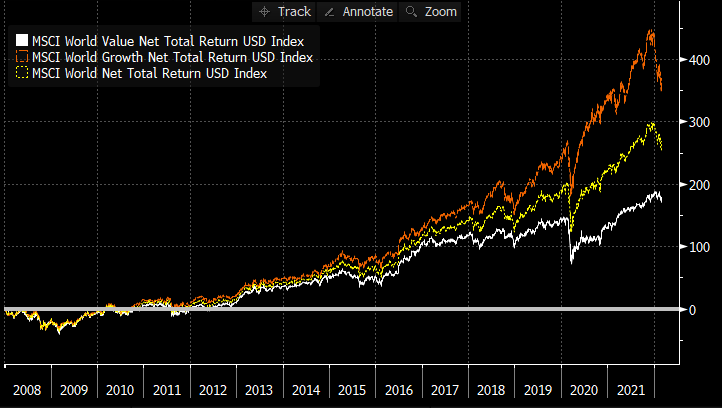
The “great rotation” to Value began towards the end of 2020 as inflation fears came into focus. It has been rewarded. Since Dec 2020, the MSCI World Value factor has delivered +21.43% returns to 25th February 2022 compared to +7.70% return for Growth factor and +14.78% for the parent MSCI World index (a traditional market-cap based index), all in GBP terms. If we look back further at relative performance since end 2007 to 25-Feb-22, we can see that Value’s underperformance relative to Growth is still material. Over that period, Growth returned +369% (11.54%pa), compared to +179% (7.52%pa) for Value, and +268% (9.63%pa) for traditional market-cap based world equities, in GBP terms. On this basis, the re-rating of Value, relative to Growth, has room to run in the face of a persistent inflationary regime. Read full article with charts Watch our CISI-accredited CPD on an Introduction to Factor Investing 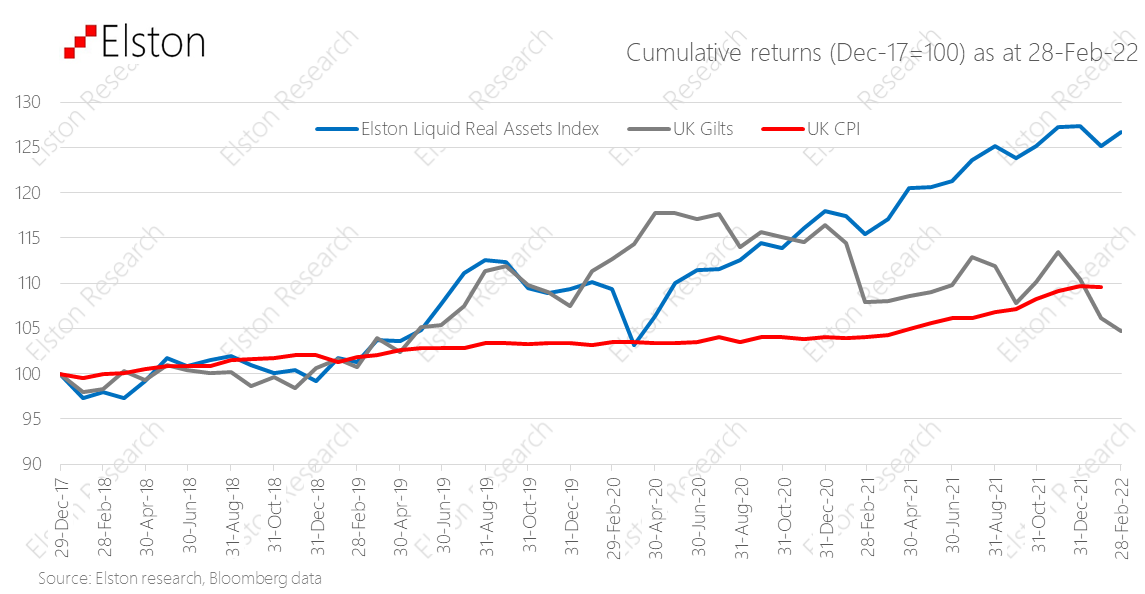 [1 min read, open as pdf]
We take a brief look at the performance update for our Liquid Real Assets Index. Exposure to Energy and broader commodities, as well as Gold & Precious Metals is supporting performance. The strategy is keeping pace with inflation, and outperforming gilts in the long-run and year-to-date, with similar level of volatility. Gilts are now underperforming inflation since index inception (Dec-17). Full updates are provided quarterly. 
Whereas there is no shortage of analysis on the risk and return of active and index-tracking funds alike, there is less detailed analysis on liquidity risk. Liquidity risk is a key aspect of Product Governance for advisers, and liquidity problems have been the underlying reasons for gatings (the suspension of client dealings) of high-profile funds in equity, bond and property asset-classes. We explore the importance of liquidity in fund selection, and considerations when contrasting formats, strategies and evaluation metrics. For retail investors, access and liquidity are essential. We strongly believe that when building portfolios for retail investors, there should be a strong preference towards highly liquid funds, so that – simply – investors can get their money back if they need it. This is why in portfolios we designed for wealth managers and advisers in 2016, we advocated to use property security ETFs, rather than property funds, which was subsequently vindicated by the Brexit-related gatings in 2016 and 2020. This is why we advocated – in 2019 – that investors were concerned about bond liquidity, they should stick to Bond ETFs. This was based on insights we learned from the yield spike in 2017 that saw liquidity in high-yield bonds dry up, and highlighted the same issues as property funds faced. This is why we advocated – in 2020 – that when constructing alternative asset class exposures within portfolios, advisers would be safest to stick with liquid versions of those alternative asset exposures. And finally, this is why, when it comes to looking at active equity funds, we study the liquidity profile (redemption horizon) so carefully. We want to help advisers we work with to “avoid” the next Woodford – not just from a performance perspective, but from a liquidity perspective too. As we move from an era of accommodative liquidity (quantitative easing) to a gradual reduction in liquidity (quantitative tightening), understanding the liquidity profile of funds and portfolios is key. This is more than a box tick for product governance. It is an essential protection of client best interests. Register you interest in receiving our liquidity analysis white-paper (for UK advisers only) Register for our CPD webinar on Liquidty Risk and Fund Selection 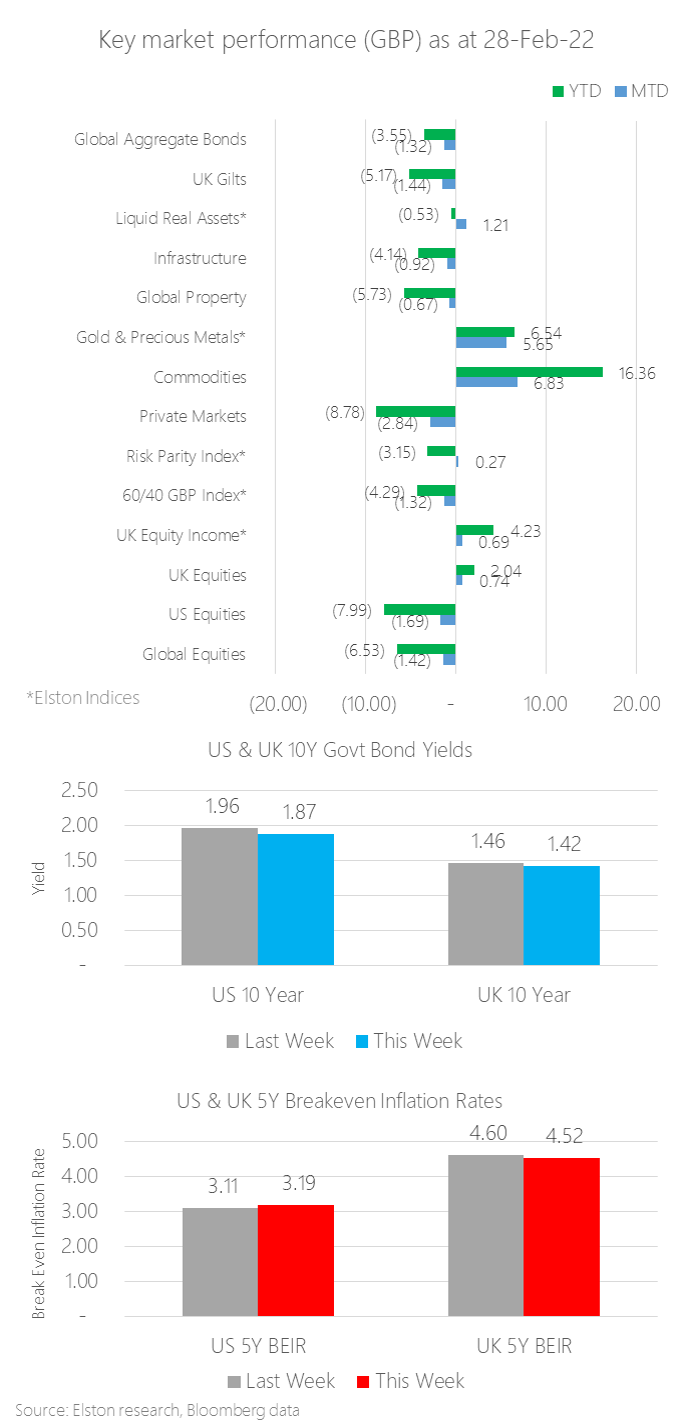 [3 min read, open as pdf]
Monthly update Commodities was the top performing asset class in February, returning +6.83% in GBP terms, on inflation fears and energy crisis- exacerbated by political risk resulting from Russia’s invasion of Ukraine. Fears of the first European land war since the 1990s also drove demand for Gold as a safe-haven asset and inflation hedge. Our Gold & Precious Metals index – a composite of predominantly gold, but also silver, platinum and palladium – increased +5.65% MTD in GBP terms. Within equities, UK equities continued to outperform US and global equities owing to the inherent value bias. Our Liquid Real Assets index returned +1.21% for the month, compared to Gilts -1.44%. Within the multi-asset space, our “Equal Risk” or Risk Parity Index returned +0.27%, compared to -1.32% for a traditional 60/40 portfolio. US & UK 10 year yields closed at 1.87% and 1.42% respectively US & UK 5 year market-implied Break Even Inflation Rates closed at 3.19% and 4.52% respectively. Our granular asset-level report is updated in our Quarterly Review and Outlook after each March, June, September and December quarter end. Market performance The month-end market performance snapshot is summarised in the chart below. For latest commentary, please refer to our Insights and weekly Friday Insights email. 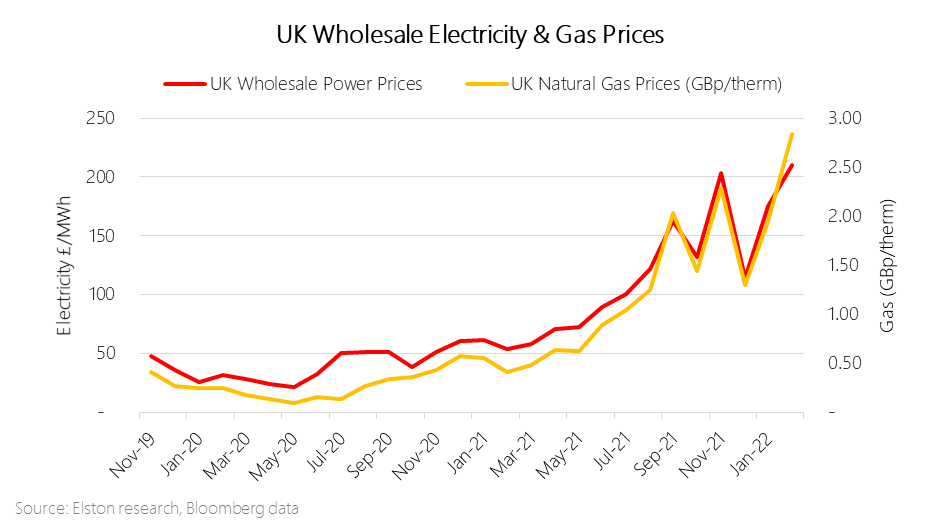 [5 min read, full article in pdf]
This war unleashes a European tragedy. In this insight, we outline what this far larger war means for Ukraine and Europe, how it could potentially stop, the impact on markets – with a focus on energy supply and associated risks to growth and inflation – and finally on portfolio positioning. 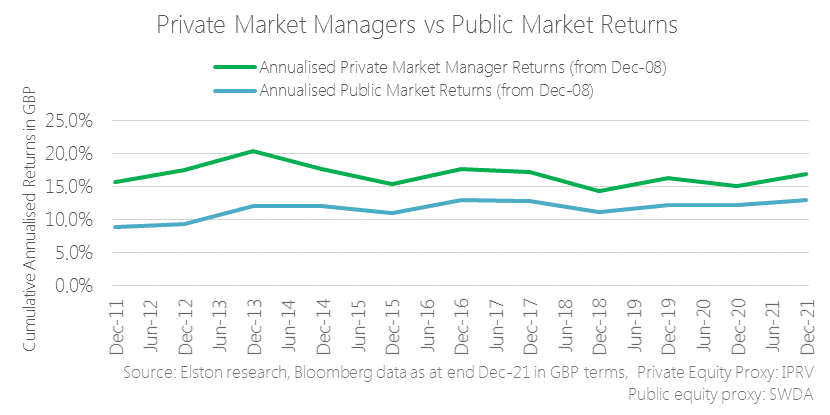 [3 min read, open as pdf]
Estimating the “illiquidity premium” of private markets versus public markets is complex and cannot be done using public data. As an alternative we focus on the returns premium of private market managers to public markets. By comparing the performance of listed private market managers (whose shares are publicly traded) to a mainstream public markets benchmark, we can get a picture of the liquid return premium of the sector as a whole, relative to public markets. Read the article in full as pdf Watch the CPD webinar on this topic 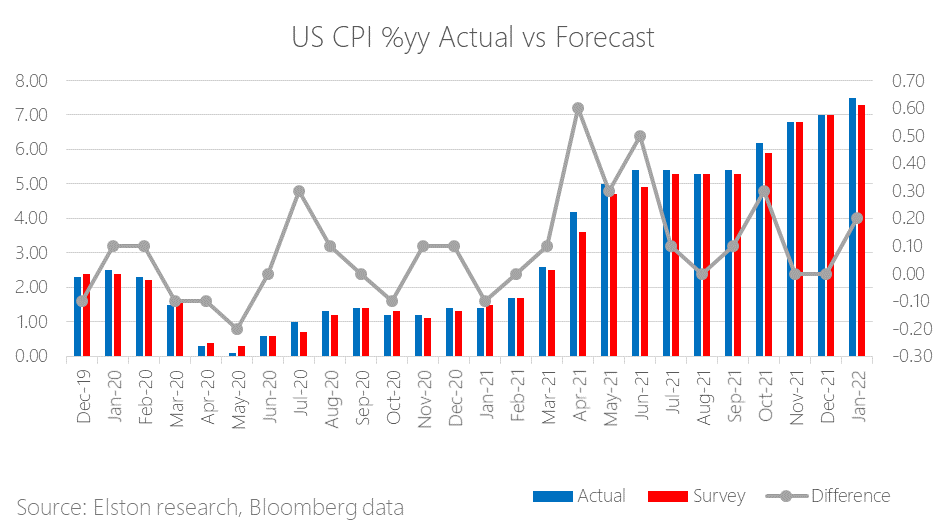 [3 min, open as pdf]
Latest US inflation figure The latest US inflation came in at 7.5%yy for January 2022, compared to 7.3%yy survey estimate. This is up from 7.0%yy last month, and is above expectations. Energy prices jumped by 27% compared to January 2021. Higher prices of accommodation and food also contributed to the highest US inflation rate in 40 years. Inflation pressure is continuing broadening as global supply failed to catch up with demand. [Read as full article]  [5 min read, open as pdf]
In our 2022 outlook, we explained why inflation will remain hotter for longer and will settle above pre-pandemic levels. Advisers should consider how to adapt portfolios for inflation across each asset class – equities, bonds and alternatives. Research demonstrates how different asset classes exhibit different degrees of inflation protection over different time-frames. Equities therefore provide a long-term inflation hedge.
In this article, we explore how to adapt portfolios for inflation within and across each asset class: Equities, Bonds and Alternatives. For full article, read as pdf 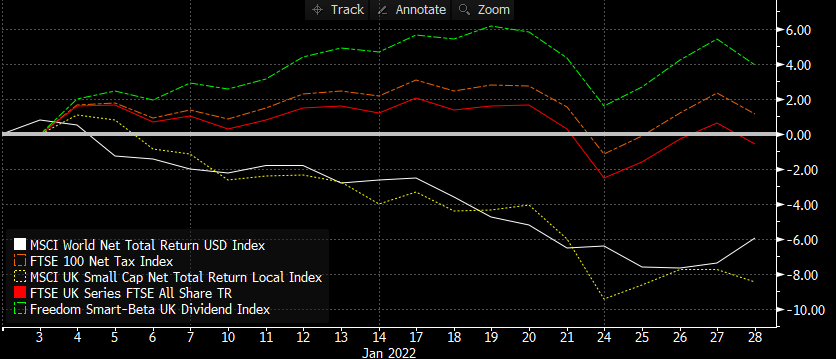 [7 min read, open as open as pdf]
Year to date performance The dispersion between styles and segments within equities is pronounced in the UK. Given recent market stress over the prospect of a rising interest rate environment, inflationary pressure, and geopolitical tensions, year-to-date performance underscores the relative resilience of equities with a Value/Income bias relative to other UK equity segments and world equities. Year to date, world equities are down -5.93%, the FTSE All Share is flat at -0.55%. UK Small Caps are down -8.49%, the FTSE 100 is +1.14% and UK Equity Income (Freedom Smart-Beta UK Dividend Index) is +3.97%. This is because returns are underpinned by dividend income as well as exposure to energy and financials which benefit respectively from a high oil price/rising rate environment. Read in full as pdf 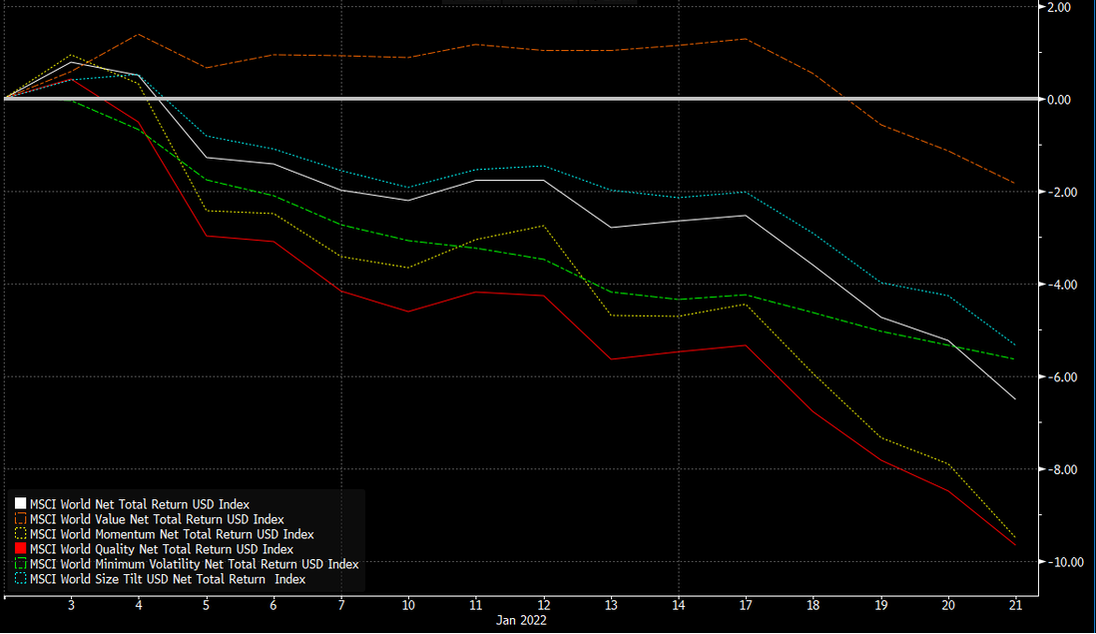 [7 min read, open as pdf]
What happened this week Equity market performance has taken a tumble, speculative assets have taken a fall. Why is this, and what has changed? We explore the three market risks and the fourth geopolitical risks - the probability of each has increased materially and simultaneously. Read full report as pdf 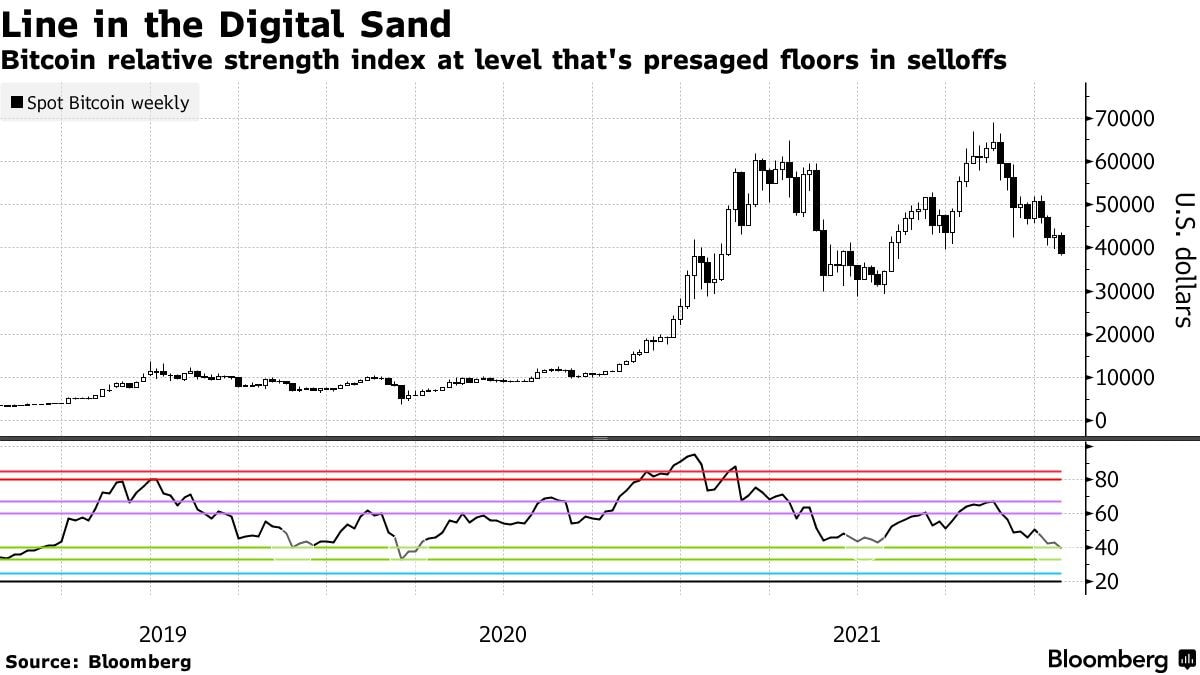 [5 min read, open as pdf]
A great technology, an inappropriate asset In discussions with financial advisers, our position has consistently been that whilst blockchain is undoubtedly a breakthrough technology, Bitcoin is not an appropriate asset for retail investors’ portfolios. Read the full report in pdf 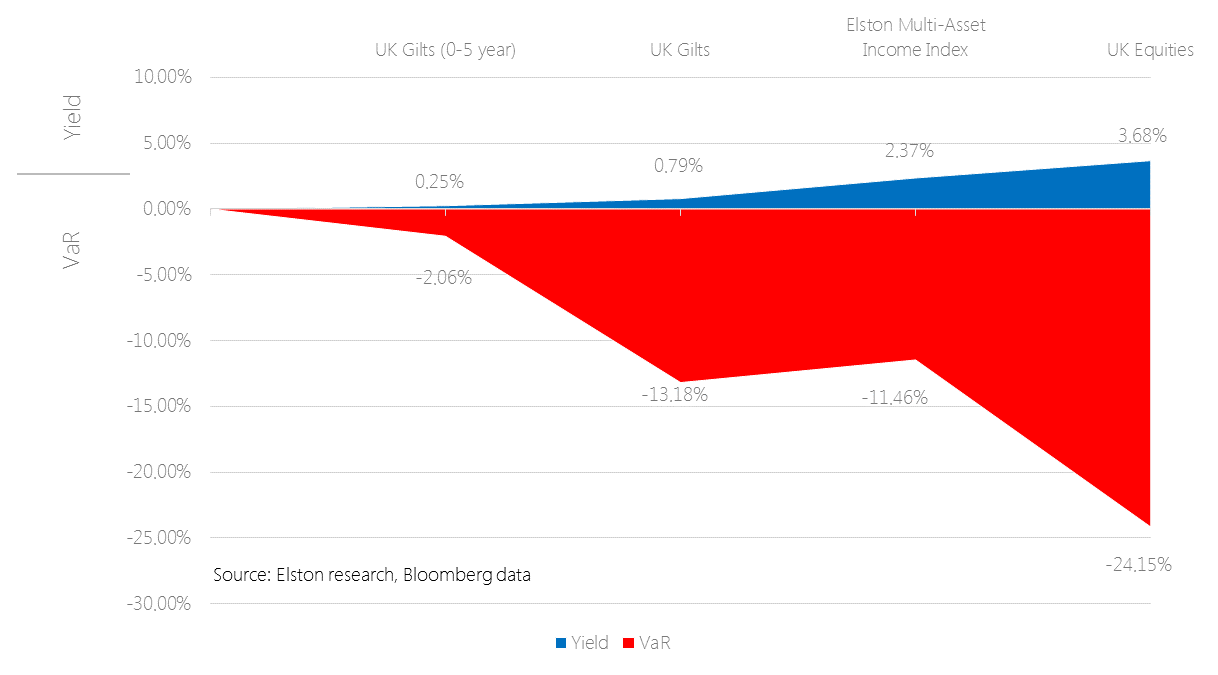 [3 min read, open as pdf]
Through the looking glass: a curiouser new paradigm Traditionally you bought bonds for income, and equity for risk. Ironically, now it’s the other way round. Read the full article Watch the CPD webinar: Diversifying income risk Find out more  [3 min read, open as pdf]
2021 in review Our 2021 market roundup summarises another strong year for markets in almost all asset classes except for Bonds which remain under pressure as interest rates are expected to rise and inflation ticks up. Listed private equity (shares in private equity managers) performed best at +43.08%yy in GBP terms. US was the best performing region at +30.06%. Real asset exposures, such as Water, Commodities and Timber continued to rally in face of rising inflation risk, returning +32.81%, +28.22% and +17.66% respectively. 2022 outlook We are continuing in this “curiouser, through-the-looking glass” world. Traditionally you bought bonds for income, and equity for risk. Now it’s the other way round. Only equities provide income yields that have the potential to keep ahead of inflation. Bonds carry increasing risk of loss in real terms as inflation and interest rates rise. Real yields, which are bond yields less the inflation rate, are negative making traditional Bonds which aren’t linked to inflation highly unattractive. Bonds that are linked to inflation are highly sensitive to rising interest rates (called duration risk), so are not attractive either. How to navigate markets in this context? The big three themes for the year ahead are, in our view:
See full report in pdf Attend our 2022 Outlook webinar 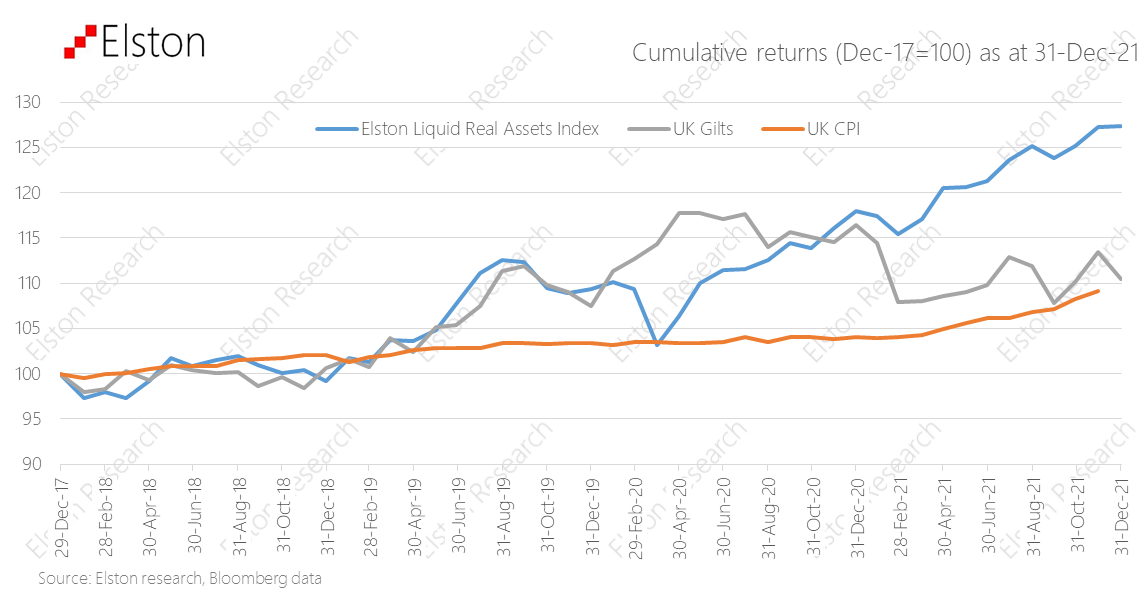 [3 min read, open pdf for full report with charts]
Inflation on the rise With inflation on the rise – and potentially interest rates too – nominal bonds are likely to remain under pressure. Whilst “real assets” – such as property, infrastructure and gold – have potential to preserve value in inflationary regimes, how can a switch from bonds to real assets be made without materially up-risking portfolios? This was the challenge we addressed in the design of our Liquid Real Assets index. Our Liquid Real Assets Index was developed to combine exposure to higher risk-return real asset exposures, with lower risk-return interest rate-sensitive assets, to deliver a real asset return exposure for inflation protection, in liquid format, with bond-like volatility to keep risk budgets in check. Given the rising inflationary pressures both in the US and in the UK, we take stock on the index performance year-to-date and are glad to say it’s “doing what it says on the tin. Find out more about the Elston Liquid Real Assets Index Watch the introductory webinar View the year-end index factsheet 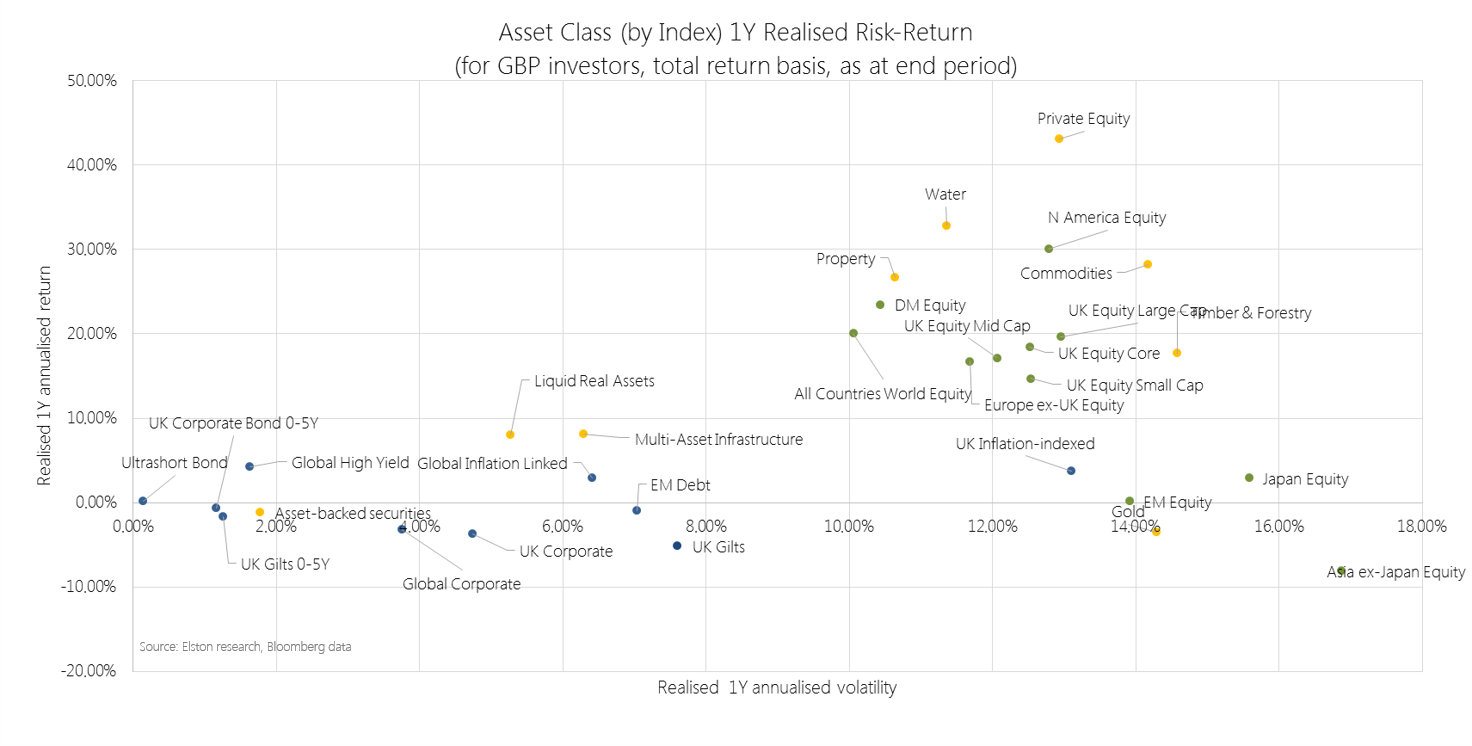 [3 min read, open as pdf]
Sustained recovery in risk assets 2021 saw a sustained recovery in risk assets, with the exception of Emerging Markets. Listed Private Equity was the top performing exposure returning +43.08% in GBP terms. Regionally, US equities remained the strongest performing market +30.06%. Real assets to the fore Real asset exposures, such as Water, Commodities and Timber continued to rally in face of rising inflation risk, returning +32.81%, +28.22% and +17.66% respectively. Our Liquid Real Assets Index (ticker ELSLRA Index) – which combines higher risk real assets and lower risk rate-sensitive assets to deliver volatility similar to bonds – returned +7.98%, whilst UK Gilts declined -5.16%. UK equity income strength Within UK equity market segments, UK Equity Income outperformed all other segments as inflation fears made income-generative, value-oriented shares relatively more attractive. UK Equity Income, represented by our Freedom Smart Beta UK Dividend Index (ticker ELSUKI Index), returned +20.77%, whilst UK Large Cap returned +19.68% and UK Core returned +18.44%. UK Small Cap was the weakest UK segment, returning +14.70% for the year. Read as pdf Register for our Quarterly Investment Outlook on 26 January 2022 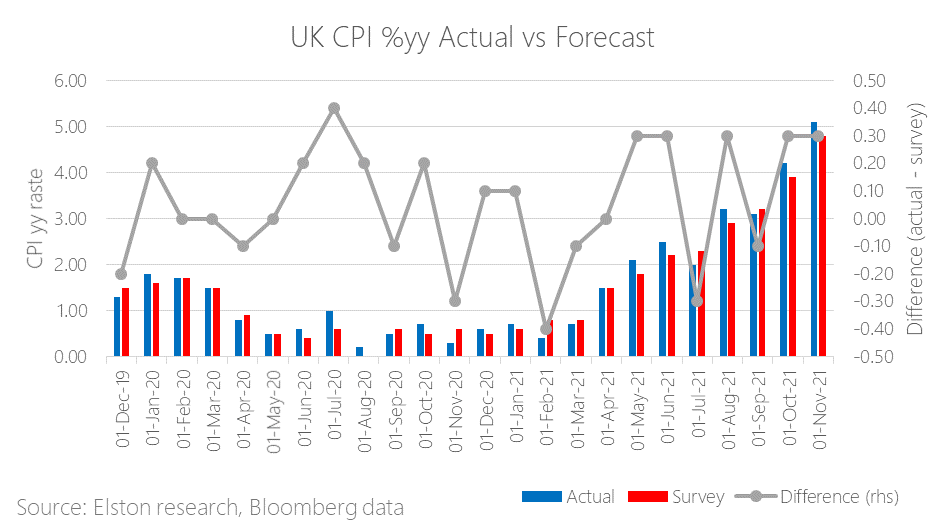 [7 min read, open as pdf]
Fed signals tightening Fed Chairman Jerome Powell signalled that inflation is now the biggest risk to growth, and getting the labour market back to pre-pandemic levels. The US will accelerate “tapering” or reduction of supportive asset purchases, and set out the potential for rate hikes in coming years (although no change in long-term target rate). And despite rate hikes usually spooking markets, markets rallied: why? Because the bigger concern was that the Fed was behind the curve and not getting on top of inflation. The risk of a so-called “policy error” had investors concerned. The fact that market-implied policy rates did not change before and after the policy announcement, suggests that this was a case of the Fed catching up with the market, than the market catching up with the Fed. UK inflation Meanwhile, UK inflation pressure continues, with November inflation data coming in at +5.1%yy, ahead of +4.8%yy forecast, the fastest rate in a decade. Transport, clothing and food were the main contributors. The risk is that inflation creeps into wage growth which would make it harder to bring inflation down to long-term target of 2.0%. This is the second month in a row of an upside surprise. The figure is also at the upper end of scenarios envisaged by the Bank of England at the November MPC meeting. Bank of England raises rates The Bank of England today announced a +0.15% increase in the Bank Rate from 0.10% to 0.25% citing “more persistent” inflation, and following the Fed’s lead in a greater level of tightening. Furthermore, the Bank of England minutes suggest that inflation could remain at elevated levels and “expect inflation to remain around 5% through the majority of the winter period, and to peak at around 6% in April 2022” Markets are pricing a 80% chance of a further +0.25% to 0.50% in February 2022. In October, BoE Governor, Andrew Bailey guided that rates would need to rise to address inflation. Where are breakeven rates? The UK 5 year breakeven rate is at 4.38%, following the announcement, compared to 4.66% at the end of last week. The US 5 year breakeven rate is at 2.73% today from 2.80% at the end of last week. Liquid Real Assets performance Our Liquid Real Assets Index combines exposure to higher risk-return real assets for inflation protection and lower risk-return rate-sensitive assets for interest rate hike protection for an overall volatility that is comparable to UK bonds. By incorporating allocations to exposures that are driving inflation, such as Commodities, or can pass-through inflation, such as Property and Infrastructure, the real assets index can provide a return premium in excess of inflation and in excess of nominal bonds. Summary Inflation is proving persistent, policy makers are catching up to keep it in check. Nominal bonds will remain under pressure, particularly longer-duration in a rising inflation, rising interest rate environment. We advocate pairing equity allocations with diversified real asset exposure that can respond to inflation and floating rate notes that can respond to interest rate hikes. Read full article with charts as pdf Register for our Quarterly Investment Outlook on 26 January 2022  [5 min read, open as pdf]
Interest rates expected to rise As the run up in inflation looks more persistent, than transitory, there is growing likelihood that Central Banks will raise interest rates in response. Following an extended “lower for longer” near-Zero Interest Rate Policy following the 2008 Global Financial Crisis and the 2020 COVID Crisis, the market futures-implied expectations for the Fed Funds rate, points to a “take off” in 2022 in response to rising inflation, following COVID-related policy support, to an expected 1.01% interest rate level in Dec-23[1], from 0.88% last quarter. Fig.1. Fed Funds Rate and implied expectations 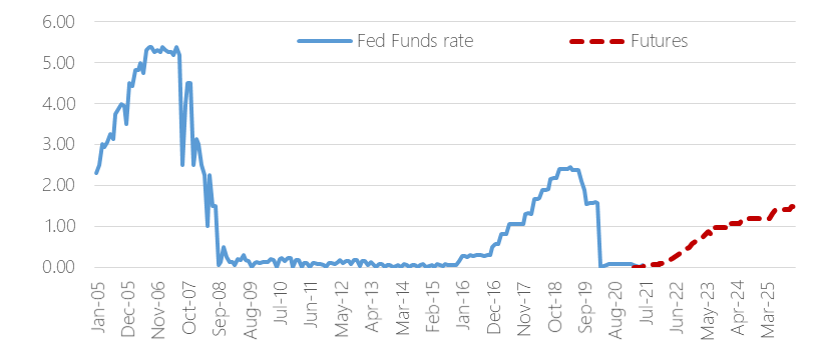 Source: Elston research, Bloomberg data
The potential for increased interest rate volatility, as rate hike expectations increase, means that investors that are seeking to dampen interest rate sensitivity (“duration”) are allocating to shorter-duration exposures, such as ultrashort-duration bonds, and also to Floating Rate Notes (FRNs). What is a Floating Rate Note? Floating Rate Notes receive interest payments that are directly linked to changes in near-term interest rates and can therefore provide a degree of protection against interest rate risk, when interest rates are rising. Issued for the most part by corporations, FRNs pay a periodic coupon – typically quarterly – that resets periodically in line with short-term interest rates. This could be expressed as a premium or “spread” over a currency’s short-term risk-free rate, such as (in the UK) the 3 month SONIA rate (Sterling Overnight Index Average, and prior to that GBP LIBOR) in the UK, or (in the US) the 3 month SOFR (Secured Overnight Funding Rate, and prior to that USD LIBOR). These indices overnight borrowing rates between financial institutions. The size of the premium or spread reflects the creditworthiness of the issuer: the higher the spread, the greater the rewarded risk for owning that security, and typically stays the same for the life of the bond and is based on the issuer’s credit risk as deemed by the market. How can FRNs benefit investors? Floating Rate Notes are a lower-risk way of putting cash to work and provide a useful direct hedge against interest rate fluctuations. When incorporated into a bond portfolio, they can help bring down duration given their reduced sensitivity to interest rate changes, as well as provide a return pattern that is directly and positively correlated with changes in interest rates. Compared to nominal bonds, such as Corporate Bonds and UK Gilts, FRNs’ yield can increase as/when interest rates increase. Relative to money market funds, FRNs may provide some additional yield pick-up, as well as very short <1 year duration. Key considerations when investing in FRNs Portfolio investors can access FRNs through funds and ETFs. Key considerations when investing in FRNs include, but are not limited to:
Summary The expected timing of interest rate “lift off” in the US and UK will change as markets adapt to evolving growth and inflation outlook during the post-COVID recovery, and in response to the risk of further disruption from new virus variants. However, as interest rate rises become more likely, and incorporating an allocation to Floating Rate Notes for protection against interest rate risk makes sense within the bond allocation. Watch the CPD Webinar: The Quest for Yield [1] Data as at last quarter end 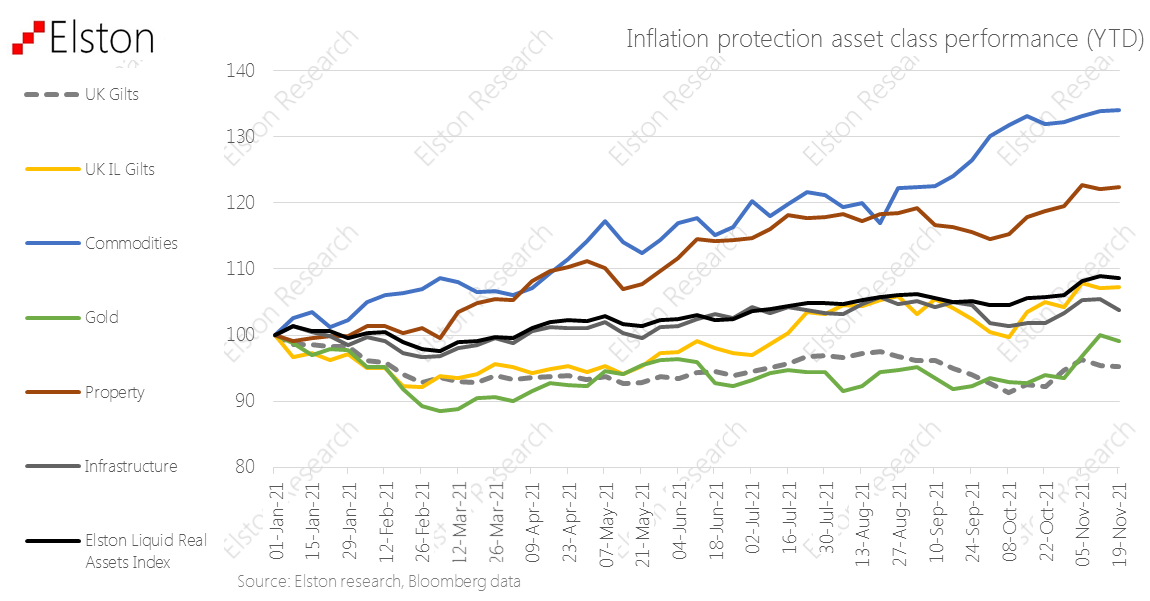
Inflation on the rise With inflation on the rise – and potentially interest rates too – nominal bonds are likely to remain under pressure. Whilst “real assets” – such as property, infrastructure and gold – have potential to preserve value in inflationary regimes, how can a switch from bonds to real assets be made without materially up-risking portfolios? This was the challenge we addressed in the design of our Liquid Real Assets index. Our Liquid Real Assets Index was developed to combine exposure to higher risk-return real asset exposures, with lower risk-return interest rate-sensitive assets, to deliver a real asset return exposure for inflation protection, in liquid format, with bond-like volatility to keep risk budgets in check. Given the rising inflationary pressures both in the US (where in Oct-21 it crossed 6%, the highest level in 30 years) and in the UK (where in Oct-21 it crossed 4%, the highest level in a decade), we take stock on the index performance year-to-date and are glad to say it’s “doing what it says on the tin. [Read full article] [Watch the webinar]  [3 min read, open as pdf]
Ahead of estimates UK CPI print for October came in at 4.2%yy vs 3.9% estimate and 3.1%yy in September. Inflation rates were higher than expected and the highest in a decade, putting more pressure on the Bank of England to raise interest rates and creating a palpable squeeze on cost of living for households through the winter. The increase was driven by energy prices and the impact of supply shortages across the economy.  Register for the webinar/View the replay Read the full article
What is the 60/40 portfolio? Trying to find the very first mention of a 60/40 portfolio is a challenge, but it links back to Markowitz Modern Portfolio Theory and was for many years seen as close to the optimal allocation between [US] equities and [US] bonds. Harry Markowitz himself when considering a “heuristic” rule of thumb talked of a 50/50 portfolio. But the notional 60/40 equity/bond portfolio has been a long-standing proxy for a balanced mandate, combining higher-risk-return growth assets with lower-risk-return income-generating assets. What’s in a 60/40? Obviously the nature of the equity and the nature of the bonds depend on the investor. US investors look at 60% US equities/40% US treasuries. Global investors might look at 60% Global Equities/40% Global Bonds. For UK investors – and our Elston 60/40 GBP Index – we look at 60% predominantly Global Equities and 40% predominantly UK bonds Why does it matter? In the same way as a Global Equities index is a useful benchmark for a “do-nothing” stock picker, the 60/40 portfolio is a useful benchmark for a “do-nothing” multi-asset investor. Multi-asset investors, with all their detailed decision making around asset allocation, risk management, hedging overlays and implementation options either do better than, or worse than this straightforward “do-nothing” approach of a regularly rebalanced 60/40 portfolio. Indeed – its simplicity is part of its appeal that enables investors to access a simple multi-asset strategy at low cost. The problem with bonds (the ‘40’) in an inflationary environment Over the years, the relationship between asset classes has changed so much that the validity of 60/40 as a strategy can legitimately be questioned. Read the full article or register for the webinar/View the replay |
ELSTON RESEARCHinsights inform solutions Categories
All
Archives
April 2024
|
 RSS Feed
Company |
Solutions |
|