
 [3 min read]
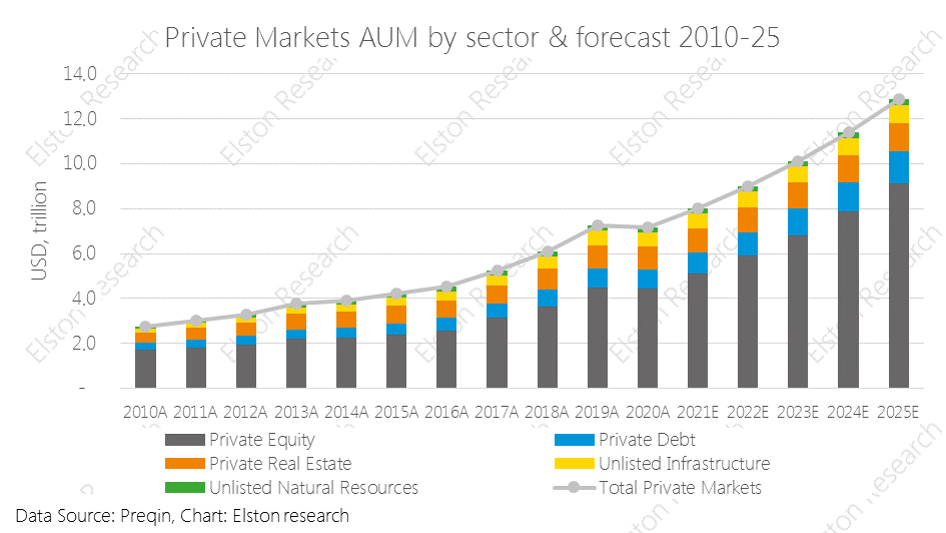
Private markets exposure is growing in terms of both assets and popularity and offers potential for “true active” returns. We explore why and how advisers get access to this trend. Why private markets are in demand Private markets – incorporating private equity, private debt (direct lending), private real estate, unlisted infrastructure, unlisted natural resources – are characterised by attributes traditionally at odds with retail investing. Opacity, illiquidity, lengthy lock-up periods to name a few, and for that reason have largely been the domain of the institutional investor. But the growth in volume of private market strategies has become hard to ignore, as have the increasingly eye-watering returns enjoyed by private market managers. Overall private market AUM has increased from US$2.7tr in 2010 to US$7.2tr in 2020 and is expected to grow to US$12.9tr by 2025[1], with the majority of this in private equity. How can advisers access private market trends for their clients? In our white paper, we explore:
Request our Access to Private Markets white paper Register for our Introduction to Private Markets webinar [1] Preqin estimates, 2021 
Last week, the US Senate passed a $1.2trillion infrastructure bill that now awaits a House vote as part of the "build back better" campaign, and another part of the "bazooka" post-COVID policy stimulus. Whilst there are plenty of infrastructure equity funds like INFR (iShares Global Infrastructure UCITS ETF) and WUTI (SPDR® MSCI World Utilities UCITS ETF) that benefit from infrastructure spend, for those not wanting to uprisk portfolio, we like GIN (SPDR® Morningstar Multi-Asset Global Infrastructure UCITS ETF) which invests in infrastructure equity and debt securities. Infrastructure & Utilities forms a core part of our Liquid Real Assets Index, for the inflation-protective qualities (tariff formulae typically pass through inflation). The "hybrid" nature of infrastructure - with both equity and bond like components is why we place it firmly in the Alternative Assets category. Helpfully this can be accessed in a highly iquid and (relatively) low-cost format, compared to higher cost, less transparent and potentially less liquid infrastructure funds. 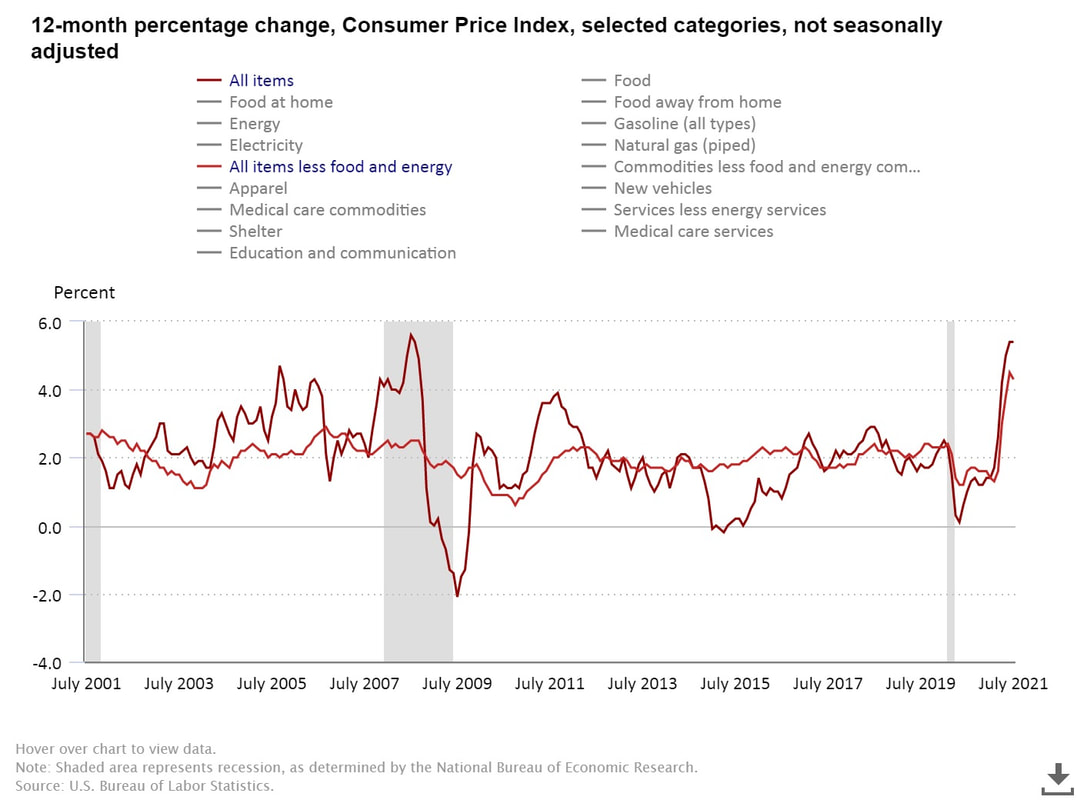
US inflation at highest level in 13 years running at +5.4%yy for second month, Core inflation (excl energy) +4.3%yy (Jul) from +4.5% (Jun). With a slight moderation in core inflation, economists are calling this as the inflation "peak". Whilst this may represent "peak inflation" year over year, overall inflation levels will remain elevated on restart and supply chain constraints As explored in our recent article on “catch-up” rates, we believe Fed policy will remain accommodative, with interest rates "lower for longer", as it lets inflation run "hotter for longer". This is positive for risk assets that offer inflation protection In inflationary regime we favour value-bias equities and real assets for diversification. 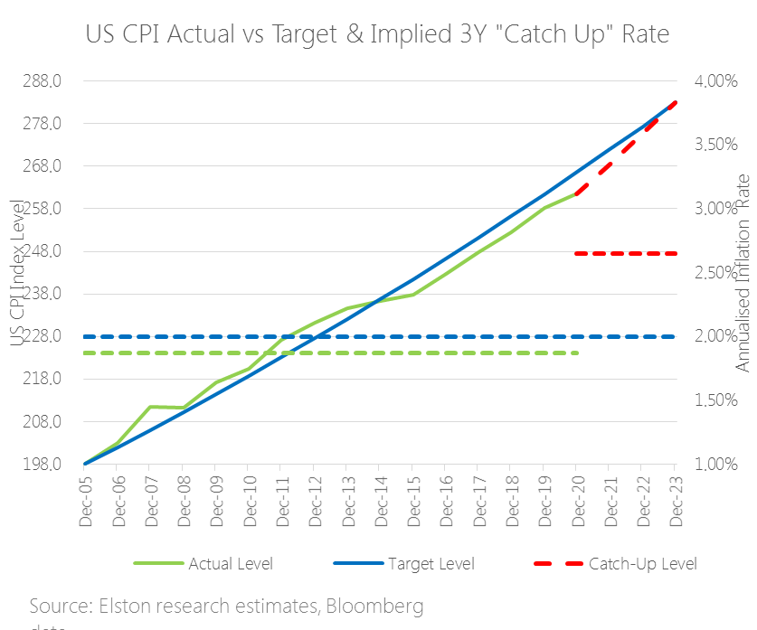 [3 min read, open as pdf]
The inflation theme is resonating in US earnings calls with company CEOs seeing this "temporary regime" lasting longer into 2022. In terms of prints, June CPI in the US was +5.4% and core CPI +4.5% - the highest print since November 1991. Markets have been caught between a push-pull between inflation data and interest rate policy response. Concerns that inflation is more persistent than transitory is driving flows to “risk on” assets. Related concerns that the Fed might start tightening policy earlier and sharper has been the “risk off” trade. Looking at inflation “catch-up” rates suggests that the Fed might let inflation run hotter for longer, pointing to a later lift off in rates from current low interest rates. This would be supportive for risk assets. What are “catch-up” rates? In 2020 ahead of the annual Jackson Hole conference the Fed indicated that it would take a more accommodative approach to inflation crossing the 2% target threshold. Why is this? Part of the answer is the concept of “catch up” rates. Essentially this means that a rate above 2% temporarily is ok if it means we are getting back to a 2% long-term trend-line. Effectively, letting inflation run hot and overshoot target in the short-term can make up for system slack/undershoots in prior years. What are the reference points? We don’t’ know the reference points (basis, trend-lines or catch-up period) the Fed will be using in its Policy decisions. So to illustrate this concept of “catch up rates”, we created an example with cumulative inflation (left hand scale) and average inflation rates (right hand scale). Our methodology We took December 2005 as a base, applied a cumulative 2% target inflation path (in blue), and then plotted cumulative path based on actual inflation rate (in green, averaging (dotted green line) 1.87%p.a. to June 2020 – i.e. below target rate). The red dashed line is the implied path back to trend-line assuming a “catch-up rate” of 2.65%p.a. (red-dotted line) that it would take for inflation to get back to the original trendline over 3 years. The catch up rate would be higher if using a shorter time-frame, and lower if using a longer-time frame. Conclusion Looking at implied three year “catch-up” rate helpso illustrate the concept and explains why Fed might let inflation run hotter for longer, pointing to a later lift off in rates. In inflationary regime we favour value-bias equities and real assets for diversification. Find out more in our quarterly review and outlook. 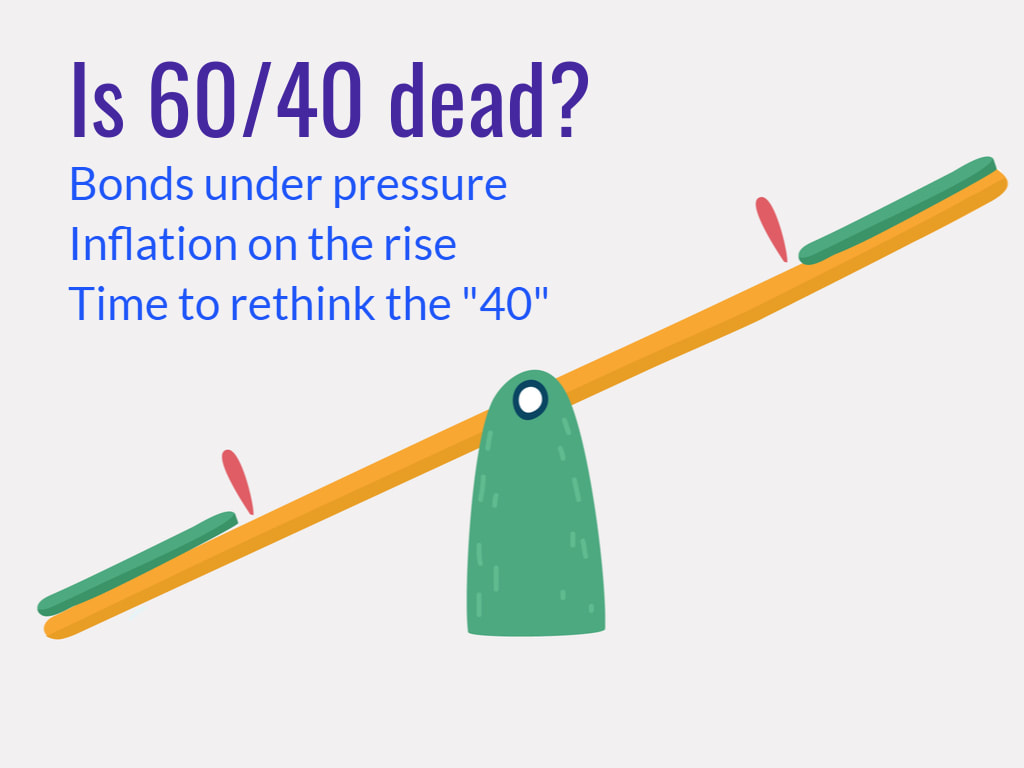 [ 5 min read, open as pdf]
Since an article published in 2019 pointed the historic lows in bond yields, many investment firms are starting to rethink the 60/40 portfolio. This came under even more scrutiny following the market turmoil of 2020. While some affirm that the 60/40 will outlive us all, others argue against this notion. We take a look at the main arguments for and against and key insights What is a 60/40 portfolio? A 60/40 equity/bond portfolio is a heuristic “rule of thumb” approach considered to be a proxy for the optimal allocation between equities and bonds. Conventionally equities were for growth and bonds were for ballast. The composition of a 60/40 portfolio might vary depending on the base currency and opportunity set of the investor/manager. Defining terms is therefore key. We summarise a range of potential definitions of terms: 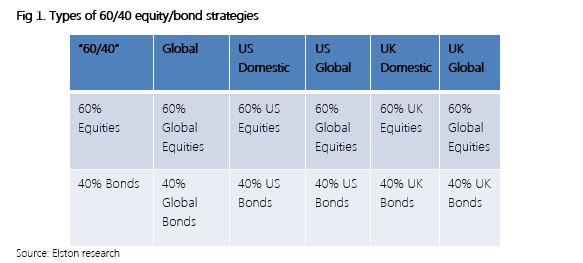 Furthermore, whilst 60/40 seems simple in terms of asset weighting scheme, it is important to understand the inherent risk characteristics that this simple allocation creates. For example, a UK Global 60/40 portfolio has 62% beta to Global Equities; equities contribute approximately 84% of total risk, and a 60/40 portfolio is approximately 98% correlated to Global Equities[1]. [1] Elston research, Bloomberg data. Risk Contribution based on Elston 60/40 GBP Index weighted average contribution to summed 1 Year Value At Risk 95% Confidence as at Dec-20. Beta Correlation to Global Equities based on 5 year correlation of Elston 60/40 GBP Index to global equity index as at Dec-20. 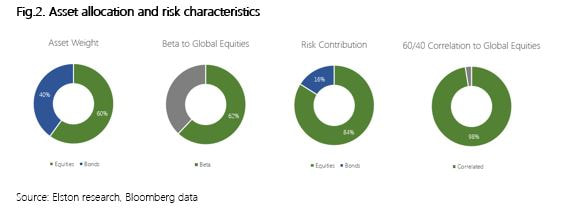 Why some think 60/40 will outlive us all. The relevance of 60/40 portfolio lies in its established historic, mathematical and academic backup. Whilst past performances do not guarantee future returns, it nonetheless provides us with experience and guidance. (Martin,2019) Research also suggests that straightforward heuristic or “rule-of-thumb” strategies work well because they aren’t likely to inspire greed or fear in investors. They become timeless. Thus, creating a ‘Mind-Gap’. (Martin,2019) In the US, the Vanguard Balanced Index Fund (Ticker: VBINX US) which combines US Total Market Index and 40% into US Aggregate bonds, plays a major role in showcasing the success of the 60/40 portfolio that has proved popular with US retail investors (Jaffe,2019). Similarly, in the UK the popularity of Vanguard LifeStrategy 60% (Ticker VGLS60A) showcases the merits of a straightforward 60/40 equity/bond approach. In 2020, for US investors VBINX provided greater (peak-to-trough) downside protection owing to lower beta (-19.5% vs -30.3% for US equity) and delivered total return of +16.26% volatility of 20.79%, compared to +18.37% for an ETF tracking the S&P 500 with volatility of 33.91%, both funds are net of fees. In this respect, the strategy captured 89% of market returns, with 61% of market risk. 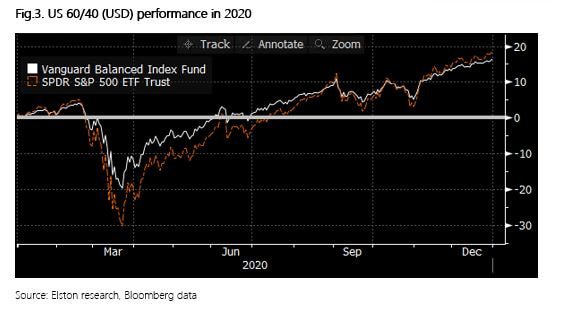 For GBP-based investors in 2020 the 60/40 approach had lower (peak-to-trough) drawdown levels (-15%, vs -21% for global equities) owing to lower beta. The 60% equity fund delivered total return of +7.84% with volatility of 15.12%, compared to +12.15% for an ETF tracking the FTSE All World Index with volatility of 24.29%. In this respect, the strategy captured 65% of market returns, with 62% of market risk. 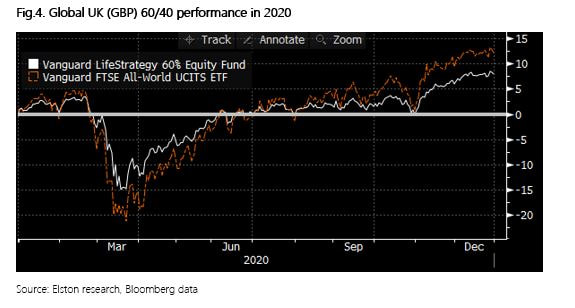 Why some think 60/40 has neared its end
Since its inception the 60/40 portfolio, derived 90% of the risk from stocks. In simple terms, 60% of the asset allocation of the portfolio was therefore the main driver of the portfolio. Returns (Robertson,2021). This hardly a surprise given that equities have a 84% contribution to portfolio ris, on our analysis, but the challenge made by some researchers is that if a 60/40 portfolio mainly reflects equity risk, what role does the 40% bond allocation provide, other than beta reduction? The bond allocation is under increasing scrutiny now is because global economic growth has slowed and traditionally safer asset classes like bonds have grown in popularity making bonds susceptible to sharp and sudden selloffs. (Matthews,2019) Strategists such as for Woodard and Harris, for Bank of America and Bob Rice for Tangent Capital have stated in their analysis that the core premise of the 60/40 portfolio has declined as equity has provided income, and bonds total return, rather than the other way round.. (Browne,2020) Another study shows that over the past 65 years bonds can no longer effectively hedge against inflation and risk reduction through diversification can be done more adequately by exploring alternatives such as private equity, venture capital etc. (Toschi, 2021). Left unconstrained, however, this can necessarily up-risk portfolios. With bond yields at an all-time low, nearing zero and the fact that they can no longer provide the protection in the up-and-coming markets many investors query the value provided by a bond allocation within a portfolio. (Robertson,2021) Key insights While point of views might differ about 60/40 as an investment strategy, one aspect that is accepted is that the future of asset allocation looks very different when compared to the recent past. Rising correlations, low yields have led strategists and investors to incorporate smarter ways of risk management, explore new bond markets like China, create modified opportunities for bonds to hedge volatility through risk parity strategies, as well as using real asset exposure such as real estate and infrastructure. (Toschi, 2021) Research conducted by The MAN Institute summarises that modifying from traditional to a more trend-following approach introduces the initial layer of active risk management. By adding an element of market timing investors further reduce the risk, when a market’s price declines. While bonds have declined in yield, they still hold importance in asset allocation for beta reduction. Further diversifying the portfolio with an allocation to real assets has potential to provide more yield and increased return than government bonds. Summary The 60/40 portfolio strategy has established itself over many decades, it has seen investors through four major wars, 14 recessions, 11 bear markets, and 113 rolling interest rate spikes. It has proved resilience as a strategy and utility as a benchmark. Our conclusion is that 60/40 is not dead: it is a useful multi-asset benchmark and remains a starting point for strategic asset allocation strategies. But the detail of the bond allocation needs a rethink. Incorporating alternative assets or strategies so long as any increased risk can be constrained to ensure comparable portfolio risk characteristics. Henry Cobbe & Aayushi Srivastava Elston Consulting Bibliography Browne, E., 2021. The 60/40 Portfolio Is Alive and Well. [online] Pacific Investment Management Company LLC. Available at: https://www.pimco.co.uk/en-gb/insights/blog/the-60-40-portfolio-is-alive-and-well Jaffe, C., 2019. No sale: Don’t buy in to ‘the end’ of 60/40 investing. [online] Seattle Times. Available at: https://www.seattletimes.com/business/no-sale-dont-buy-in-to-the-end-of-60-40-investing/ Martin, A., 2019. The 60/40 Portfolio Will Outlive Us All. [online] Advisorperspectives.com. Available at:https://www.advisorperspectives.com/articles/2019/11/11/the-60-40-portfolio-will-outlive-us-all#:~:text=As%20two%20recent%20commentaries%20demonstrate,40%20will%20outlive%20us%20all. Matthews, C., 2021. Bank of America declares ‘the end of the 60-40’ standard portfolio. [online] MarketWatch. Available at:https://www.marketwatch.com/story/bank-of-america-declares-the-end-of-the-60-40-standard-portfolio-2019-10-15 Robertson, G., 2021. 60/40 in 2020 Vision | Man Institute. [online] www.man.com/maninstitute. Available at:https://www.man.com/maninstitute/60-40-in-2020-vision Toschi, M., 2021. Why and how to re-think the 60:40 portfolio | J.P. Morgan Asset Management. [online] Am.jpmorgan.com. Available at: https://am.jpmorgan.com/be/en/asset-management/adv/insights/market-insights/on-the-minds-of-investors/rethinking-the-60-40-portfolio/  [3 min read, open as pdf] Inflation is on the rise Easy central bank money, pent up demand after lockdowns and supply-chain constraints mean inflation is on the rise. Will Central Banks be able to keep the lid on inflation? The risk is that it could persistently overshoot target levels. 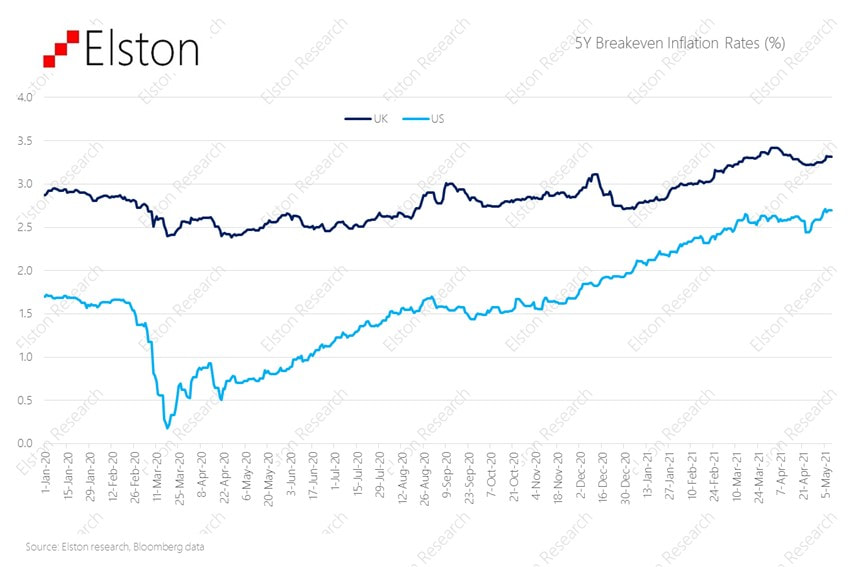 It matters more over time Inflation erodes the real value of money: its “purchasing power”. If inflation was on target (2%), £100,000 in 10 year’s time would be worth only £82,035 in today’s money. But on current expectations, it could be worth a lot less than that. 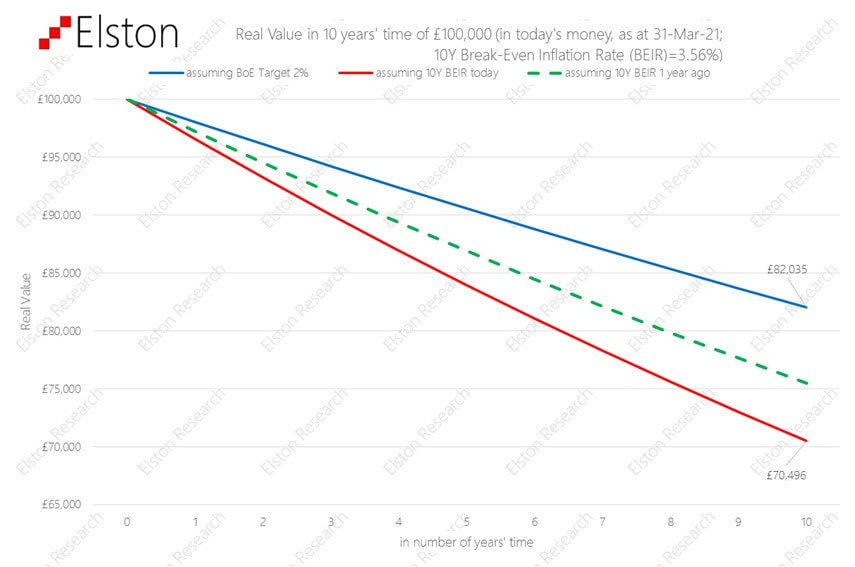 Real assets can help
A bank note is only as valuable as the value printed on it. This is called its “nominal value”. Remember the days when a £5 note went a long way? When inflation rises, money loses its real value. By contrast, real assets are things that have a real intrinsic value over time whose value is set by supply, demand and needs: like copper, timber, gold, oil, and wheat. Real assets can also mean things that produce an regular income which goes up with inflation, like infrastructure companies (pipelines, toll roads, national grid etc) and commercial property with inflation-linked rents. Rethinking portfolio construction Including “real assets” into the mix can help diversify a portfolio, and protect it from inflation. Obviously there are no guarantees it will do so perfectly, but it can be done as a measured approach to help mitigate the effects of inflation. The challenge is how to do this without taking on too much risk. Find out more about our Liquid Real Assets Index  [5min read, open as pdf]
We agree it’s time to rethink the 60/40 portfolio. It’s a useful benchmark, but a problematic strategy. What is the 60/40 portfolio, and why does it matter? What it represents? Trying to find the very first mention of a 60/40 portfolio is proving a challenge, but it links back to Markowitz Modern Portfolio Theory and was for many years seen as close to the optimal allocation between [US] equities and [US] bonds. Harry Markowitz himself when considering a “heuristic” rule of thumb talked of a 50/50 portfolio. But the notional 60/40 equity/bond portfolio has been a long-standing proxy for a balanced mandate, combining higher-risk return growth assets with lower-risk-return, income generating assets. What’s in a 60/40? Obviously the nature of the equity and the nature of the bonds depends on the investor. US investor look at 60% US equities/40% US treasuries. Global investors might look at 60% Global Equities/40% Global Bonds. For UK investors – and our Elston 60/40 GBP Index – we look at 60% predominantly Global Equities and 40% predominantly UK bonds Why does it matter? In the same way as a Global Equities index is a useful benchmark for a “do-nothing” stock picker, the 60/40 portfolio is a useful benchmark for a “do-nothing” multi-asset investor. Multi-asset investors, with all their detailed decision making around asset allocation, risk management, hedging overlays and implementation options either do better than, or worse than this straightforward “do-nothing” approach of a regularly rebalanced 60/40 portfolio. Indeed – its simplicity is part of its appeal that enables investors to access a simple multi-asset strategy at low cost. The problem with Bonds in a 60/40 framework In October 2019, Bank of America Merrill Lynch published a research paper “The End of 60/40” which argues that “the relationship between asset classes has changed so much that many investors now buy equities not for future growth but for current income, and buy bonds to participate in price rallies”. This has prompted a flurry of opinions on whether or not 60/40 is still a valid strategy The key challenges with a 60/40 portfolio approach is more on the bond side:
So is 60/40 really dead? In short, as a benchmark no. As a strategy – we would argue that for serious investors, it never was one. We therefore think it’s important to distinguish between 60/40 as an investment strategy and 60/40 as a benchmark. We think that a vanilla 60/40 equity/bond portfolio remains useful as a benchmark to represent the “do nothing” multi-asset approach. However, we would concur that a vanilla 60/40 equity/bond portfolio, as a strategy offered by some low cost providers does – at this time – face the significant challenges identified in the 2019 report, that have been vindicated in 2020 and 2021. For example, during the peak of the COVID market crisis in March 2020, correlations between equities and bonds spiked upwards meaning there was “no place to hide”. The growing inflation risk has put additional pressure on nominal bonds. Real yields are negative. Interest rates won’t go lower. But outside of some low-cost retail products, very few portfolio managers, would offer a vanilla equity/bond portfolio as a client strategy. The inclusion of alternatives have always had an important role to play as diversifiers. Rethinking the 40%: What are the alternatives? When it comes to rethinking the 60/40 portfolio, investors will have a certain level of risk budget. So if that risk budget is to be maintained, there is little change to the “60% equity” part of a 60/40 portfolio. What about the 40%? We see opportunity for rethinking the 40% bond allocation by: We nonetheless think it is important to:
1. Rethinking the bond portfolio Whilst more extreme advocates of the death of 60/40 would push for removing bonds entirely, we would not concur. Bonds have a role to play for portfolio resilience in terms of their portfolio function (liquidity, volatility dampener), so would instead focus on a more nuanced approach between yield & duration. We would concur that long-dated nominal bonds look problematic, so would suggest a more “barbell” approach between shorter-dated bonds (as volatility dampener), and targeted, diversified bond exposures: emerging markets, high yield, inflation-linked (for diversification and real yield pick-up). 2. Incorporating sensible alternative assets Allocating a portfolio of the bond portfolio to alternatives makes sense, but we also need to consider what kind of alternatives. Whilst some managers are making the case for hedge funds or private markets as an alternative to bonds, we think there are sensible cost-efficient and liquid alternatives that can be considered for inclusion that either have bond-like characteristics (regular stable income streams), or provide inflation protection (real assets). For regular diversified income and inflation protection, we would consider: asset-backed securities, infrastructure, utilities and property. The challenge, however, is how to incorporate these asset classes without materially up-risking the overall portfolio. For inflation protection, we would consider real assets: property, diversified, commodities, gold and inflation-protected bonds. Properly incorporated these can fulfil a portfolio function that bonds traditionally provided (liquidity, income, ballast and diversification). 3. Consider risk-based diversification as an alternative strategy One of the key reasons for including bonds in a multi-asset portfolio is for diversification purposes from equities on the basis that one zigs when the other zags. In the short-term, and particularly at times of market stress, correlations between asset classes can increase, this reduces the diversification effect if bonds zag when equities zag. We would argue risk-based diversification strategies have a role to play to here, on the basis that rather than relying on long-run theoretical correlation, they systematically focus on short-run actual correlation between asset classes and adapt their asset allocation accordingly. Traditional portfolios means choosing asset weights which then drive portfolio risk and correlation metrics. Risk-based diversification strategies do this in reverse: they use short-run portfolio risk and correlation metrics to drive asset weights. If the ambition is to diversify and decorrelate, using a strategy that has this as its objective makes more sense. Summary So 60/40 is not dead. It will remain a useful benchmark for mult-asset investors. As an investment strategy, vanilla 60/40 equity/bond products will continue to attract assets for their inherent simplicity. But we do believe a careful rethink of the “40” is required.  [5 min read, open as pdf]
Commodity indices, and the ETPs that track them provide a convenient way of accessing a broad commodity basket exposure with a single trade. What’s inside the basket? Commodity indices represent baskets of commodities constructed using futures prices. The Bloomberg Commodity Index which was launched in 1998 as the Dow Jones-AIG Commodity Index has a weighting scheme is based on target weights for each commodity exposure. These weights are subject to the index methodology rules that incorporate both liquidity (relative amount of trading activity of a particular commodity) and production data (actual production data in USD terms of a particular commodity) to reflect economic significance. The index subdivides commodities into “Groups”, such as: Energy (WTI Crude Oil, Natural Gas etc), Grains (Corn, Soybeans etc), Industrial Metals (Copper, Aluminium etc), Precious Metals (Gold, Silver), Softs (Sugar, Coffee, Cotton) and Livestock (Live Cattle, Lean Hogs). The index rules include diversification requirements such that no commodity group constitutes more than 33% weight in the index; no single commodity (together with its derivatives) may constitute over 25% weight); and no single commodity may constitute over 15% weight. The target weights for 2021 at Group and Commodity level is presented below: 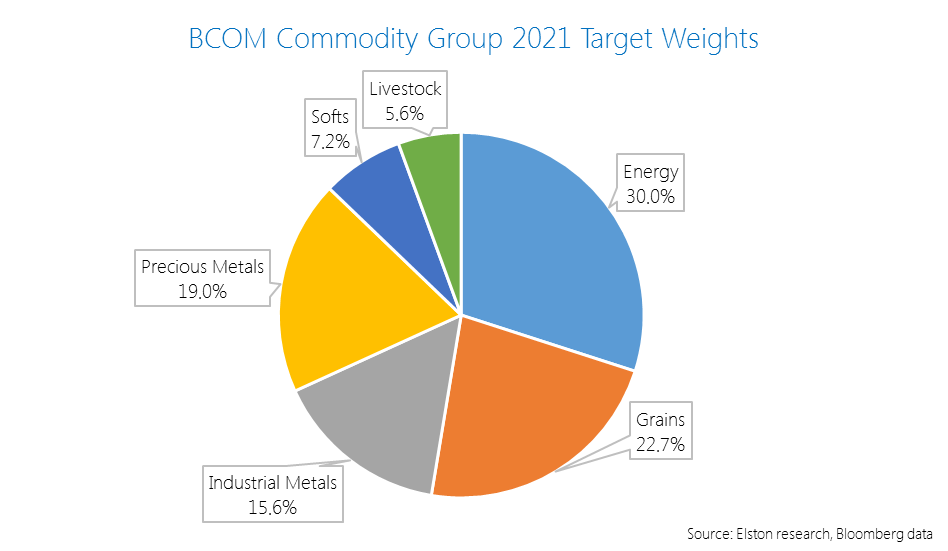 Owing to changes in production and or liquidity, annual target weights can vary. For example the material change in weight in the 2021 target weights vs the 2020 target weights was a +1.6ppt increase in Precious Metals (to 19.0%) and a -1.9pp decrease in Industrial Metals to 15.6%. Traditional vs “Smart” weighting schemes One of the drawbacks of the traditional production- and liquidity-based weighting scheme is that they are constructed with short-dated futures contracts. This creates a risk when futures contracts are rolled because for commodities where the forward curve is upward sloping (“contango”), the futures price of a commodity is higher than the spot price. Each time a futures contract is rolled, investors are forced to “buy high and sell low”. This is known as “negative roll yield”. A “smart” weighting scheme looks at the commodity basket from a constant maturity perspective, rather than focusing solely on short-dated futures contracts. This approach aims to mitigate the impact of negative roll yield as well as potential for reduced volatility, relative to traditional indices. This Constant Maturity Commodity Index methodology was pioneered by UBS in 2007 and underpins the UBS Bloomberg BCOM Constant Maturity Commodity Index and products that track it. Illustration of futures rolling for markets in contango 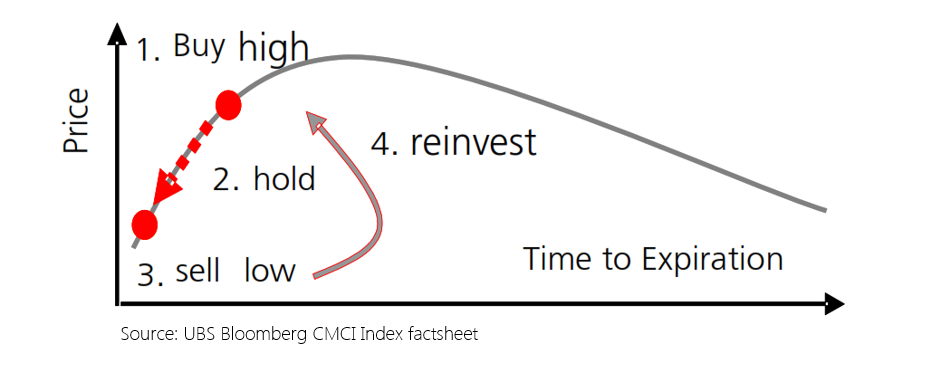 An Equal Weighted approach Whilst the traditional index construction considers economic significance in terms of production and liquidity, investors may seek alternative forms of diversified commodities exposure, such as Equal Weighted approach. There are two ways of achieving this, equal weighting each commodity, or equal weighting each commodity group. The Refinitiv Equal Weight Commodity Index equally weights each if 17 individual commodity components, such that each commodity has a 5.88% (1/17th) weight in the index. This results in an 18% allocation to the Energy Group, 47% allocation to the Agriculture group, 12% allocation to the Livestock group and 23% allocation to Precious & Industrial Metals. An alternative approach is to equally weight each commodity group. This is the approach we take in the Elston Equal Weight Commodity Portfolio, which has a 25% allocation to Energy, a 25% allocation to Precious Metals, a 25% Allocation to Industrial Metals and a 25% Allocation to Agricultural commodities. This is on the basis that commodities components within each group will behave more similarly than commodity components across groups. These two contrasting approaches are summarised below: 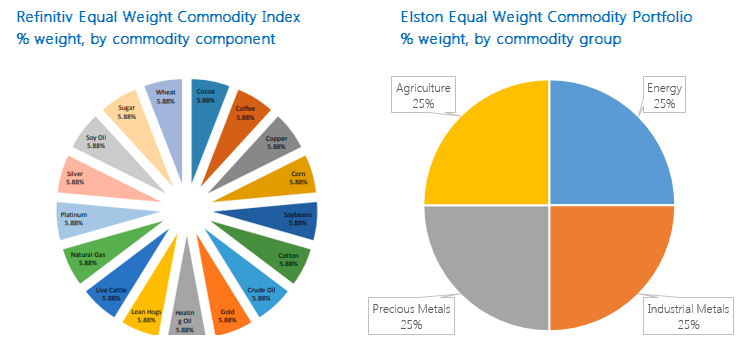 Performance In 2020, the Equal Weight component strategy performed best +6.28%. The Constant Maturity strategy delivered +0.69%. The Equal Weight Group strategy was flat at -0.05% and the traditional index was -5.88%, all expressed in GBP terms. 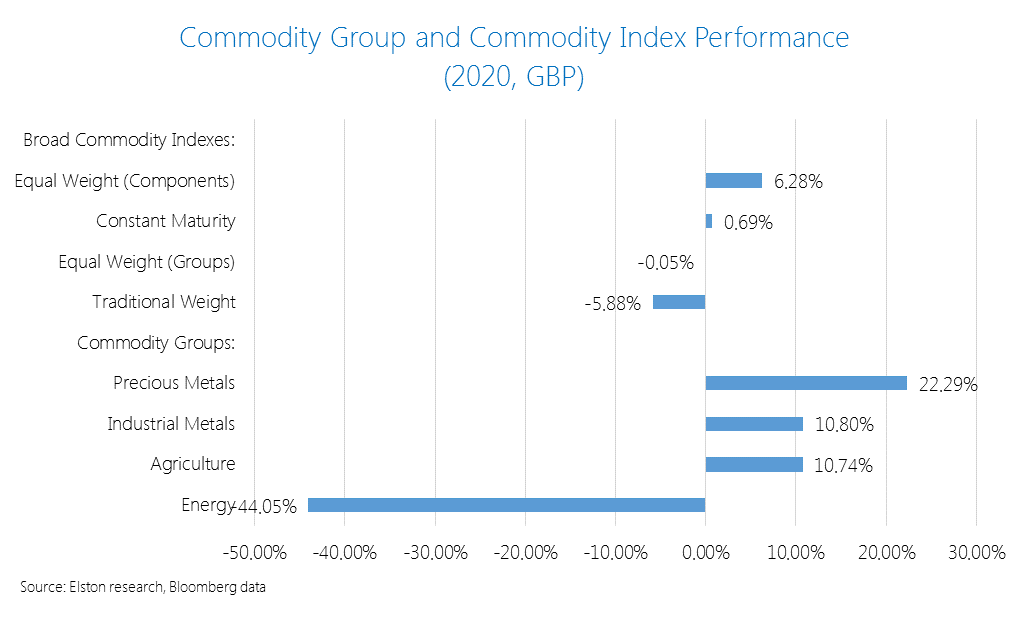 Informed product selection This summarises four different ways of accessing a diversified commodity exposure: traditional weight, constant maturity weighting, equal component weighting and equal group weighting. Understanding the respective strengths and weaknesses of each approach is an important factor for product selection.  [3 min read, open as pdf]
Focus on inflation In our recent Focus on Inflation webinar we cited the study by Briere & Signori (2011) looking at the long run correlations between asset returns and inflation over time. We highlighted the “layered” effect of different inflation protection strategies (1973-1990) with cash (assuming interest rate rises), and commodities providing best near-term protection, inflation linked bonds and real estate providing medium-term protection, and equities providing long-term protections. Nominal bonds were impacted most negatively by inflation. 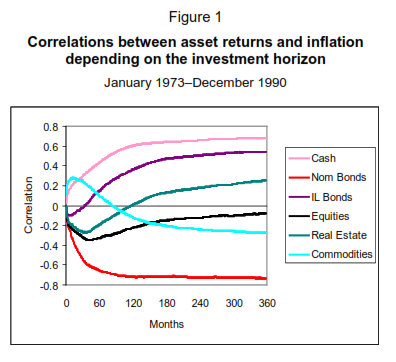 Source: Briere & Signori (2011), BIS Research Papers Given the growing fears of inflation breaking out, we plotted the YTD returns of those “inflation-hedge” asset classes, in GBP terms for UK investors, with reference to the US and UK 5 Year Breakeven Inflation Rates (BEIR). Figure 2: Inflation-hedge asset class performance (GBP, YTD) vs US & UK 5Y BEIR 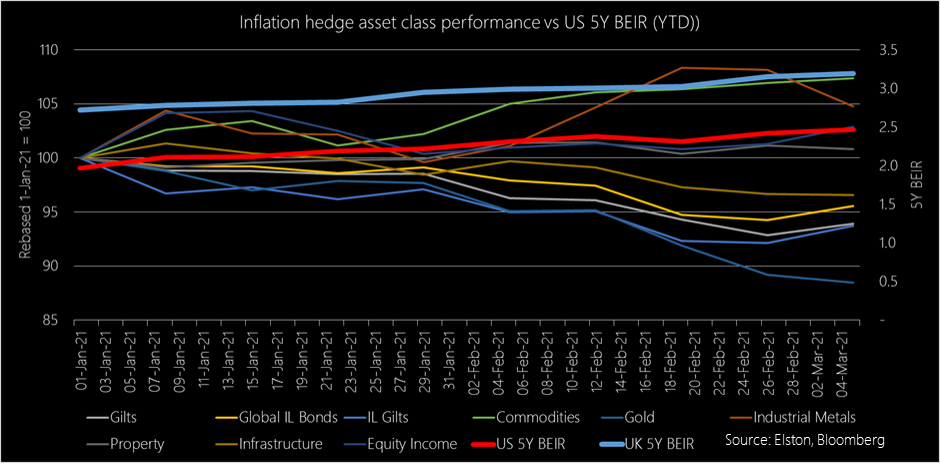 Source: Elston research, Bloomberg data, as at 5th March 2021
Winners and Losers so far We looked at the YTD performance in GBP of the following broad “inflation hedge” asset classes, each represented by a selected ETF: Gilts, Inflation Linked Gilts, Commodities, Gold, Industrial Metals, Global Property, Multi-Asset Infrastructure and Equity Income. Looking at price performance year to date in GBP terms:
So Inflation-Linked Gilts don’t provide inflation protection? Not in the short run, no. UK inflation linked gilts have an effective duration of 22 years, so are highly interest rate sensitive. Fears that inflation pick up could lead to a rise in interest rates therefore reduces the capital value of those bond (offset by greater level of income payments, if held to maturity). So whilst they provide medium- to long-term inflation protection, they are poor protection against a near-term inflation shock. Conclusion In conclusion, we observe:
 Which asset classes are not indexable; what proxies do they have that can be indexed; and why it can make sense to blend ETFs and Investment Trusts for creating an allocation to alternative asset classes In this series of articles, I look at some of the key topics explored in my book “How to Invest With Exchange Traded Funds” that also underpin the portfolio design work Elston does for discretionary managers and financial advisers. Non-indexable asset classes Whilst Equities, Bonds and Cash are readily indexable, there are also exposures that will remain non-indexable because they are:
It is however possible to represent some of these alternative class exposures using liquid index proxies. Index providers and ETF issuers have worked on creating a growing number of indices for specific exposures in the Liquid Alternative Asset space. Some examples are set out below:
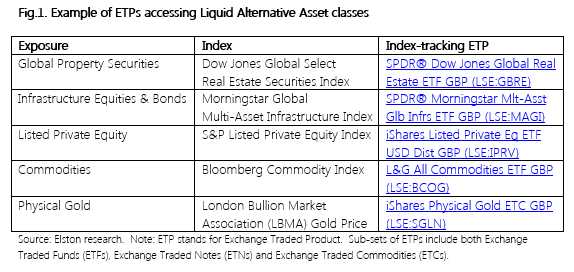 Alternative asset index proxies Whilst these liquid proxies for those asset classes are helpful from a diversification perspective, it is important to note that they necessarily do not share all the same investment features, and therefore do not carry the same risks and rewards as the less liquid version of the asset classes they represent. 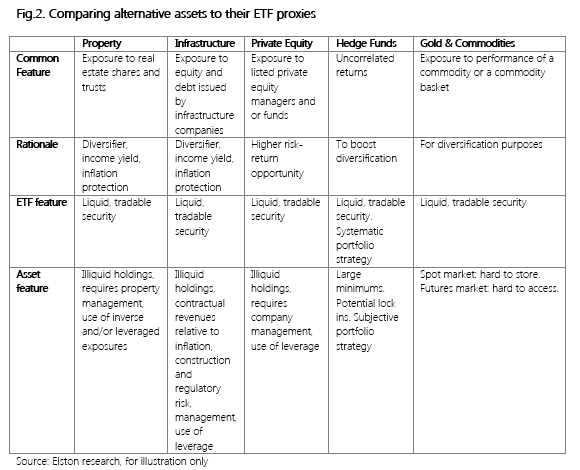 While ETFs for alternatives assets will not replicate holding the risk-return characteristics of that exposure directly, they provide a convenient form of accessing equities and/or bonds of companies that do have direct exposure to those characteristics. Using investment trusts for non-index allocations Ironically, the investment vehicle most suited for non-indexable investments is the oldest “Exchange Traded” collective investment there is: the Investment Company (also known as a “closed-end fund” or “investment trust”). The first UK exchange traded investment company was the Foreign & Colonial Investment Trust, established in 1868. Like ETFs, investment companies were originally established to bring the advantages of a pooled approach to the investor of “moderate means”. 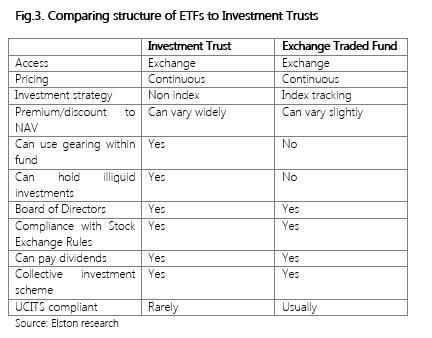 For traditional fund exposures, e.g. UK Equities, Global Equities, our preference is for ETFs over actively managed Investment Trusts owing to the performance persistency issue that is prevalent for active (non-index) funds. Furthermore, investment trusts have the added complexity of internal leverage and the external performance leverage created by the share price’s premium/discount to NAV – a problem that can become more intense during periods of market stress.
However, for accessing hard-to-reach asset classes, Investment Trusts are superior to open-ended funds, as they are less vulnerable to ad hoc subscriptions and withdrawals. The Association of Investment Company’s sector categorisations gives an idea of the non-indexable asset classes available using investment trusts: these include Hedge Funds, Venture Capital Trusts, Forestry & Timber, Renewable Energy, Insurance & Reinsurance Strategies, Private Equity, Direct Property, Infrastructure, and Leasing. A blended approach Investors wanting to construct portfolios accessing both indexable investments and non-indexable investments could consider constructing a portfolio with a core of lower cost ETFs for indexable investments and a satellite of higher cost specialist investment trusts providing access to their preferred non-indexable investments. For investors, who like non-index investment strategies, this hybrid approach may offer the best of both world. Summary The areas of the investment opportunity set that will remain non-indexable, are (in our view) those that are hard to replicate as illiquid in nature (hard to access markets or parts of markets); and those that require or reward subjective management and skill. Owing to the more illiquid nature of underlying non-indexable assets, these can be best accessed via a closed-ended investment trust that does not have the pressure of being an open-ended fund. ETFs provide a convenient, diversified and cost-efficient way of accessing liquid alternative asset classes that are indexable and provide a proxy or exposure for that particular asset class. Examples include property securities, infrastructure equities & bonds, listed private equity, commodities and gold.  [5 minute read, open as pdf] Sign up for our upcoming CPD webinar on Real Assets for diversification
What are “Real Assets”? Real Assets can be defined as “physical assets that have an intrinsic worth due to their substance and property”[1]. Real assets can be taken to include precious metals, commodities, real estate, infrastructure, land, equipment and natural resources. Because of the “inflation-protection” objective of investing in real assets (the rent increases in property, the tariff increases in infrastructure), real asset funds also include exposure to inflation-linked government bonds as a financial proxy for a real asset. Why own Real Assets? There are a number of rationales for investing in Real Assets. The primary ones are to:
Accessing Real Assets Institutional investors can access Real Assets directly and indirectly. They can acquired direct property and participate in the equity or debt financing of infrastructure projects. Directly. For example, the Pensions Infrastructure Platform, established in 2021 has enabled direct investment by pension schemes into UK ferry operators, motorways and hospital construction projects. This provides funding for government-backed project and real asset income and returns for institutional investors. Institutional investors can also access Real Assets indirectly using specialist funds as well as mainstream listed funds such as property securities funds and commodities funds. Retail investors can access Real Assets mostly indirectly through funds. There is a wide range of property funds, infrastructure funds, commodity funds and natural resources funds to choose from. But investors have to decide on an appropriate fund structure.
The rise of real asset funds The first UK diversified real asset fund was launched in 2014, with competitor launches in 2018. There is now approximately £750m invested across the three largest real asset funds available to financial advisers and their clients, with fund OCFs ranging from 0.97% to 1.46%. Following the gating of an Equity fund (Woodford), a bond fund (GAM) and several property funds for liquidity reasons, there has – rightly – been increased focus by the regulator and fund providers (Authorised Corporate Directors or “ACDs”) on the liquidity profile of underlying assets. As a result, given their increased scale, real asset fund managers are increasingly turning to mainstream funds and indeed liquid ETFs to gain access to specific asset classes. Indeed, on our analysis, one real assets funds has the bulk of its assets invested in mainstream funds and ETFs that are available to advisers directly. Now there’s no shame in that – part of the rationale for using a Real Assets fund is to select and combine funds and manage the overall risk of the fund. But what it does mean is that discretionary managers and advisers have the option of creating diversified real asset exposure, using the same or similar underlying holdings, for a fraction of the cost to clients. Creating a liquid real asset index portfolio We have created the Elston Liquid Real Asset index portfolio of ETFs in order to:
We have built the index portfolio using the following building blocks
As regards asset allocation, we are targeting a look-through ~50/50 balance between equity-like securities and bond-like securities to ensure that the strategy provides beta reduction as well as diversification when included in a portfolio. For the index portfolio simulation, we have used an equal weighted approach. Fig.1. Performance of the Liquid Real Asset Index Portfolio (.ELRA) 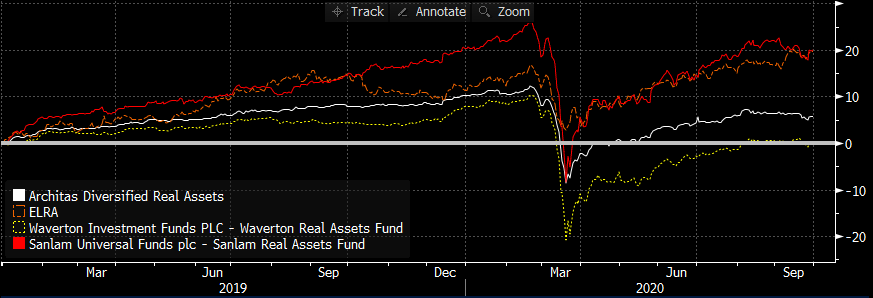 Source: Elston research, Bloomberg data. Total returns from end December 2018 to end September 2020 for selected real asset funds. Since December 2018, the Sanlam Real Assets fund has returned 19.99%, the Elston Real Asset Index Portfolio has returned +19.76%. This compares to +5.86% for the Architas Diversified Real Asset fund and +0.16% for the Waverton Real Assets Fund. What about Beta Our Real Asset Index Portfolio has a Beta of 0.75 to the Elston 60/40 GBP index so represents a greater risk reduction than Waverton (0.86) and Sanlam (0.84), which are all higher beta than Architas (0.53). Fig.2. Real Asset strategies’ beta to a 60/40 GBP Index 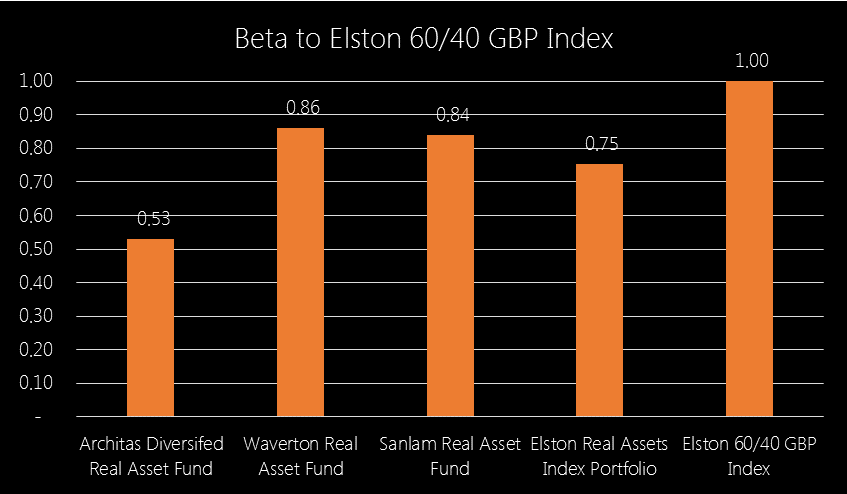 Source: Elston research, Bloomberg data. Weekly data relative to Elston 60/40 GBP Index, GBP terms Dec-18 to Sep-20. Finally, by accessing the real asset ETFs directly, there is no cost for the overall fund structure, hence the implementation cost for an index portfolio of ETFs is substantially lower. Fig.3. Cost comparison of Real Asset funds vs index portfolio of ETFs 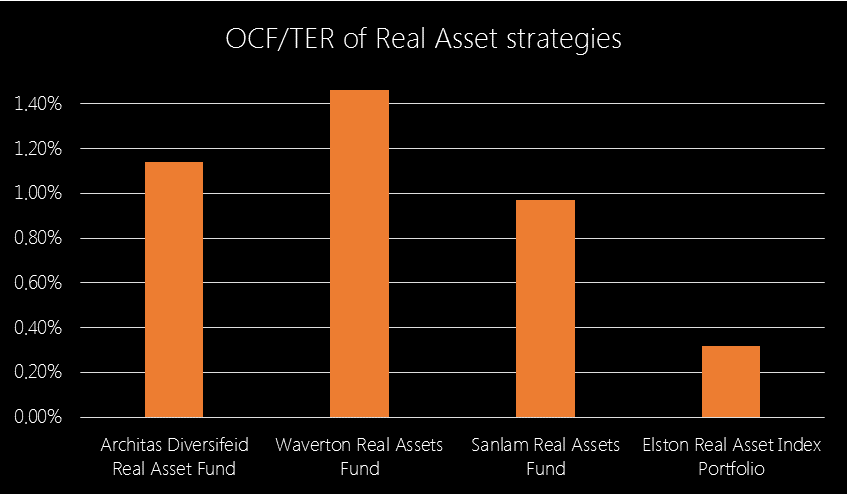 Source: Elston research, Bloomberg data
Fund or ETF Portfolio? The advantage of a funds-based approach is convenience (single-line holding), as well as having a a manager allocate dynamically between the different real asset exposures within the fund. The advantage of an index portfolio is simplicity, transparency and cost. Creating a managed ETF portfolio strategy that dynamically allocates to the different real asset classes over the market cycle is achievable and can be implemented on demand. Summary The purpose of this analysis was to note that:
[1] Source: https://www.investopedia.com/terms/r/realasset.asp 
We look at the three largest ETPs that track the gold price and which are “physically-backed” (meaning they own the underlying asset), and track the same spot price index, the LBMA Gold Price Index. Each of these ETPs offers a London-listed share-class, and each also offers a GBP-denominated listing. This means that the share price is expressed in GBP-terms. This is convenient for client reporting and essential for some platforms. The returns, however, remain unhedged to GBP. Whilst SGLN and SGLP are Irish-domiciled funds, PHGP is Jersey domiciled. Each has UK tax reporting status. In terms of scale and cost, iShares Physical Gold ETC (Ticker: SGLN, launched in 2011) is the largest at £11.9bn with TER of 0.19%, followed by Invesco Physical Gold (Ticker: SGLP, launched in 2009) at £10.7bn with TER of 0.19%, followed by WisdomTree Physical Gold (Ticker: PHGP, launched in 2007) at £7.1bn With increasing choice available, the key differentiation amongst physically-backed ETPs is cost. Fig.1. YTD performance of largest London-listed Gold ETPs 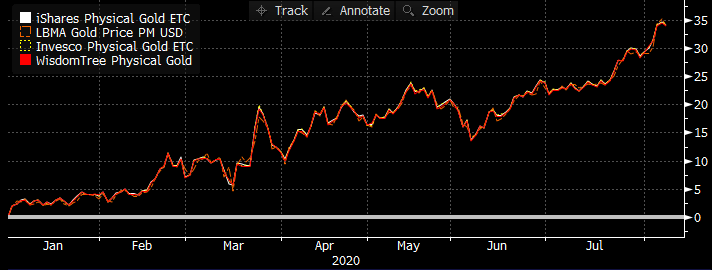 Source: Bloomberg, as at 7th August 2020, GBP terms
NOTICES Commercial Interest: Elston Consulting Limited creates research portfolios and administers indices that may or may not be referenced in this article. If referenced, this is clearly designated as such and is to raise awareness and provide purely factual information as regards these portfolios and/or indices. Image Credit: Shutterstock 
Liquid Alternatives: Assets We define Liquid Alternative Asset ETFs as tradable ETFs that hold liquid securities that provide access to a particular “alternative” (non-equity, non-bond) asset class exposure. More specifically, we define this as Listed Property Securities, Infrastructure Securities, Commodities, Gold and Listed Private Equity. Looking at selected ETF proxies for each of these asset classes, the correlations for these Liquid Alternative Assets, relative to Global Equity are summarised below. Fig.1. Liquid Alternative Assets: Correlation Matrix 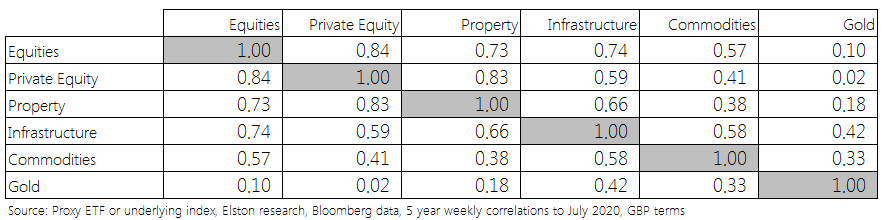 Incorporating these exposures within a multi-asset strategy provides can provide diversification benefits, both from an asset-based perspective and a risk-based perspective. Looking at 5 year annualised performance, only Gold has outperformed Global Equities. Listed Private Equity has been comparable. Meanwhile Infrastructure has outperformed property, whilst Commodities have been lack-lustre. Fig.2. Liquid Alternative Assets Returns vs Global Equities 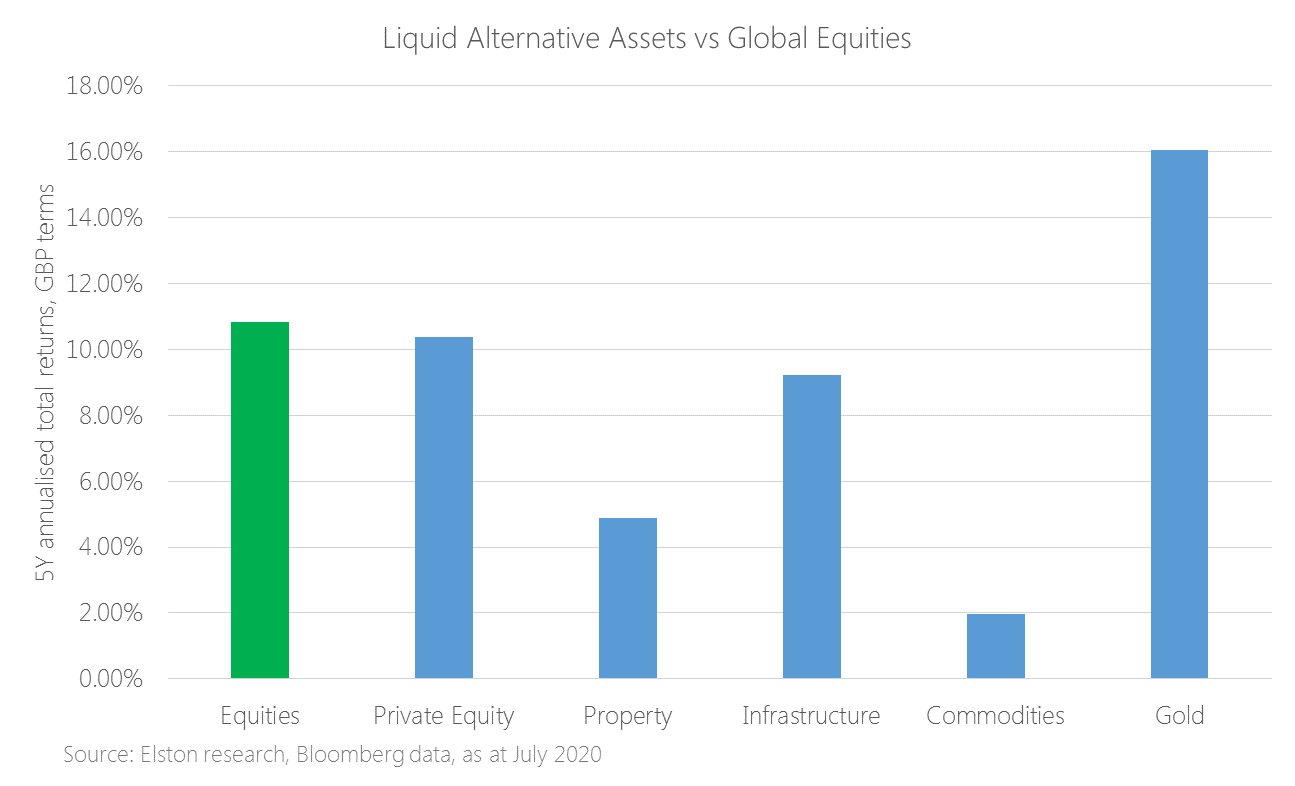 Looking at performance YTD, gold has returned +31.06% in GBP terms, outperforming Global Equities by 32.54ppt. Infrastructure has also slightly outperformed equities owing to its inflation protective qualities. Fig.3. YTD performance of Liquid Alternative Assets (GBP terms) 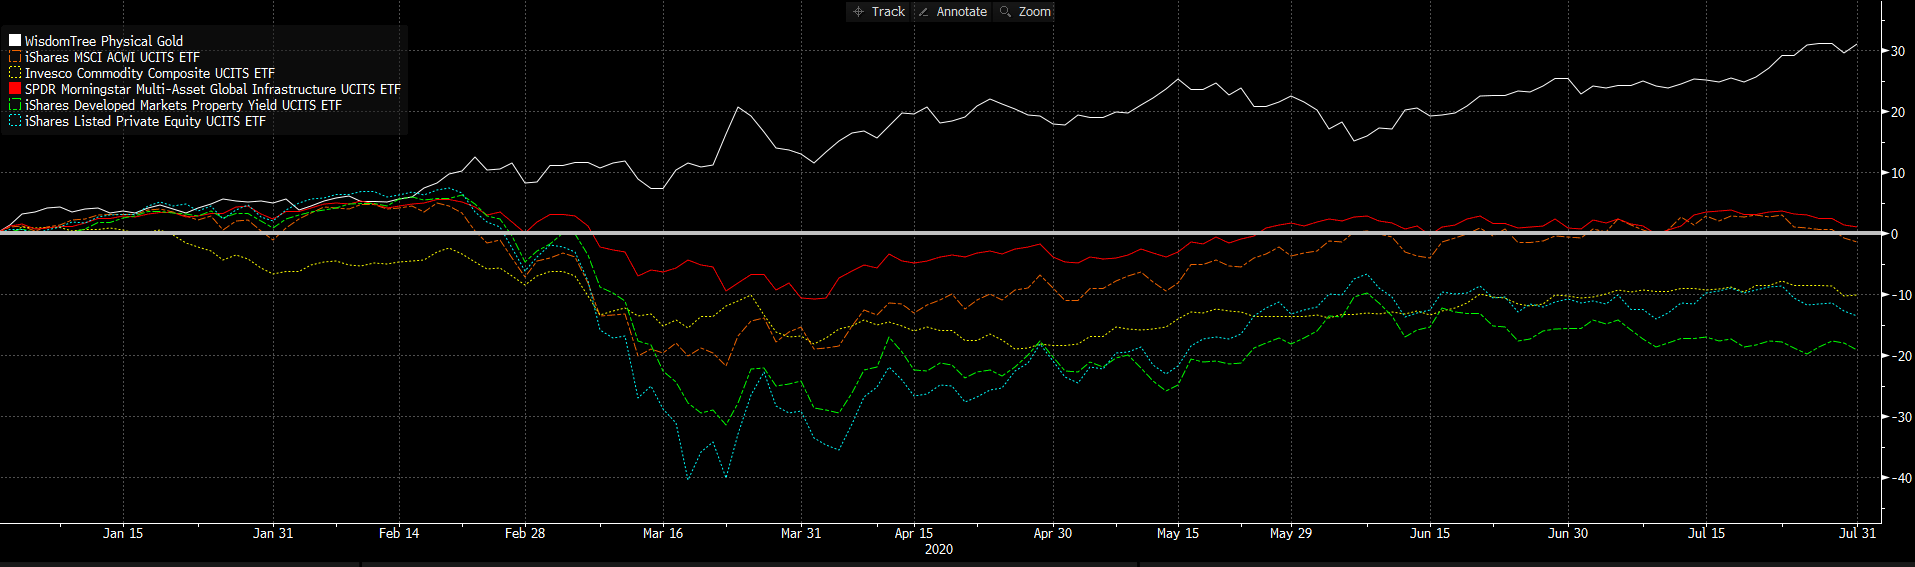 Source: Elston research, Bloomberg data Liquid Alternatives: Strategies We define Liquid Alternative Strategy ETFs as tradable ETFs that provide alternative asset allocation strategies. By providing differentiated risk-return characteristics, these ETFs should provide diversification and/or reflect a particular directional bias. Fig.4. Examples of European-listed Liquid Alternative Strategies 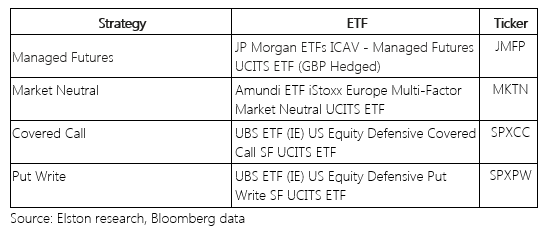 Each of these strategies provide a low degree of correlation with Global Equities and therefore have diversification benefits. Fig.5. Liquid Alternative Strategies: Correlation Matrix 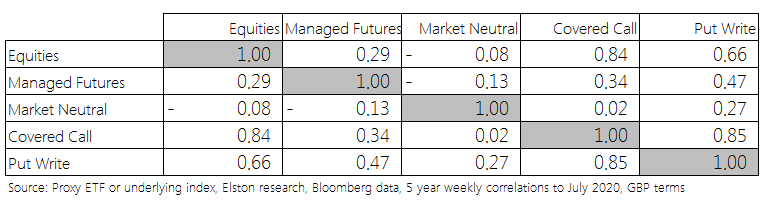 In 2020, the Market Neutral strategy has proven most defensive. Fig.6. Liquid Alternative Strategies: YTD performance 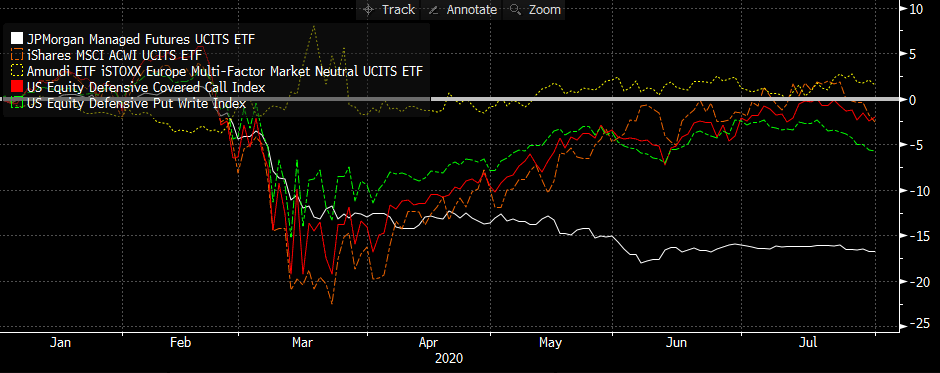 Source: Bloomberg data, GBP terms, as at July 2020 Conclusion ETFs offer a timely, convenient, transparent, liquid and low-cost way of allocating or deallocating to a particular exposure. Blending Liquid Alternative ETFs – both at an asset class level and a strategy level - provides managers with a broader toolkit with which to construct portfolios. NOTICES
Commercial Interest: Elston Consulting Limited creates research portfolios and administers indices that may or may not be referenced in this article. If referenced, this is clearly designated as such and is to raise awareness and provide purely factual information as regards these portfolios and/or indices. Image Credit: Shutterstock Liquid Alt ETPs: success for alternative asset class exposure, less so for alternative strategies9/7/2020

Following the severe market turbulence of 2020, it’s worth taking a fresh look at “Liquid Alts” within the ETF space. What are Liquid Alternative ETFs? We define Liquid Alternative ETFs as any ETF that is:
Rise in popularity post GFC The increased popularity in the US of “Liquid Alts” came after the Global Financial Crisis and related liquidity crunch. Following the crisis, there was a demand for portfolio diversifiers that were an alternative to bonds, but with a keen focus on liquidity profile of the underlying holdings. In the US, the tradability of the ETF format meant that a broad range of “Liquid Alt” ETFs were launched, providing access to asset classes such as gold, commodities, and property securities, as well as long/short and more sophisticated “active” or systematic investment strategies packaged up within an ETF. Liquid Alts became in vogue. What about Liquid Alts in the UK? First we need to distinguish between the “type” of Liquid Alts available. We distinguish between those Liquid Alts that give exposure to an alternative asset class; and those that give exposure to an alternative asset allocation strategy. In the UK, following the financial crisis, we saw the launch of ETFs that gave exposure to alternative asset classes – gold, commodities, property, listed private equity, and infrastructure, for example. In this respect, the growth – in depth and breadth – of Liquid Alts has been impressive, particularly in the commodities and property sectors. But when it comes to Liquid Alts to deliver an alternative strategy, the ETP format has not been popular: the preferred format remains daily-dealing funds. Diversifier strategies, for example absolute return funds such as GARS, systematic trading strategies, long/short funds and funds-of-structured-products, have all been typically manufactured as funds in the UK rather than exchange traded products. Reviewing the marketing in 2016, we were expecting the range of Liquid Alt strategies available to UK investors to broaden both in the mutual fund format and the ETP format. As regards mutual funds, that has proven to be the case. As regards ETPs, Liquid Alt strategies have failed to catch on. Only a handful of liquid alternative strategy ETPs were launched, and they have largely failed to gain any traction. Why is this? Whilst straightforward Liquid Alt asset class ETPs have been successful in the UK, Liquid Alt strategy ETPs have failed to gain traction in the UK for 4 reasons, in our view:
Evaluating success: complexity fails To summarise, in the UK, within the Liquid Alt ETF space, the more straightforward a product, the more traction it’s got. Importantly, the reverse applies. “Straightforward” liquid alt ETFs Straightforward liquid alt ETFs provide liquid exposure to a specific asset class, or proxy for an asset class. Fig.1. Liquid Alternative Asset Classes 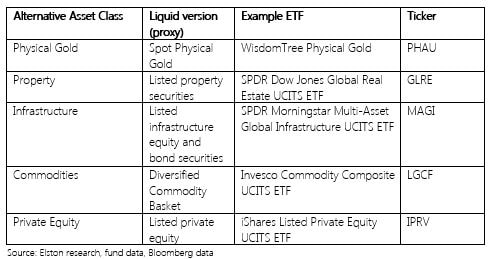 We find these “Liquid Alt” ETFs very useful building blocks to build in some diversifiers in a targeted and transparent way. “Complex” liquid alt ETFs The more complex liquid alt ETFs launched into the European market, have had far less success, and have ended up in the ETF graveyard.. Examples of complex strategies include: ETFs tracking a proxy of the HFRX Hedge Fund Index, an equity long/short ETF, and a market neutral ETF. Fig. 2. Liquid Alternative Strategies 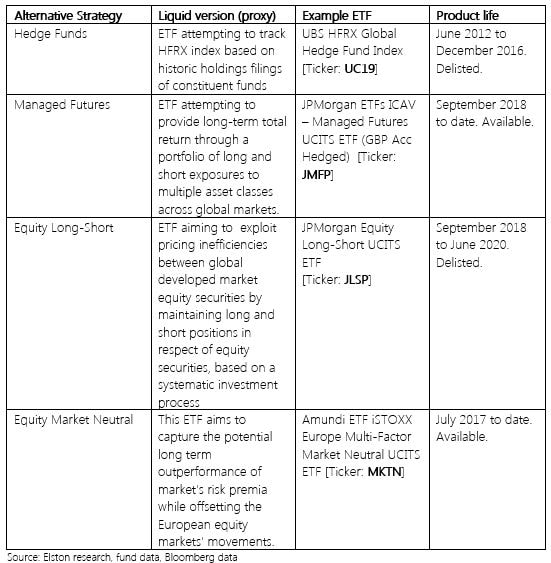 Liquidity lessons learned and relearned There were painful liquidity lessons learned in the 2008 GFC. Those liquidity lessons have been relearned for “less liquid alts” delivered by traditional fund formats, where investors were gated in direct property funds during Brexit in 2016 and Coronavirus this year. By comparison, investors who chose property securities ETFs as their “liquid” way of accessing that exposure experienced no such gating. Furthermore, the high profile gating of Woodford’s Equity Income fund and GAM absolute return bonds fund are further reminders as to why liquidity of the underlying asset, whether, within a fund or ETF, is so important. Where next? We see potential for increased competition in the single-asset class liquid alts, particularly infrastructure and listed private equity where there is little choice. Whilst we expect some ETF providers to continue to create liquid alt trading strategies, we are not convinced that ETPs are the best format for these diversifiers. Where we do expect innovation is in index-tracking funds that can be held on platform and provide a transparent, liquid and systematic approach to delivering true diversification strategies, as an alternative to opaque, higher cost absolute return funds. NOTICES Commercial Interest: Elston Consulting Limited creates research portfolios and administers indices that may or may not be referenced in this article. If referenced, this is clearly designated and is to raise awareness and provide purely factual information as regards these portfolios and/or indices.  An Englishman’s home is his castle, the saying goes. But in truth, the Scots, Welsh and Irish are just as keen on owning their own home. And for many Brits, one home is not enough; the level of buy-to-let and second home ownership is higher in the UK than almost anywhere else in the world.
Of course, people don’t just buy houses, flats and apartments to make money out of them. Homes bring enjoyment and utility to their owners that transcend financial considerations. But research has shown that most home buyers do see their purchase as a financial investment. Indeed, many now view property as a better and less risky investment than equities. What, then, does the evidence say about that? Each year, Professors Elroy Dimson, Paul Marsh and Mike Staunton of London Business School produce a publication for Credit Suisse called the Global Investment Returns Yearbook. In it they show how the different asset classes have performed over the very long term — specifically since 1900. There are several complications when assessing residential property as a financial investment. Most owner-occupiers, for instance, will need to take out a mortgage, and regardless of the size of the property, there are on-going maintenance costs involved in home ownership too. For landlords, those expenses are offset to some degree or other by rental outcome. But, in real terms, how much have house prices grown since 1900? You might be surprised at how low the average price rise, after inflation, actually is. Dimson, Marsh and Staunton analysed the data for 11 different countries and calculated the UK figure to be 1.8%. In Australia, where prices have grown fastest since the start of the twentieth century, the figure is 2.2%. The average annual price rise across all 11 counties is 1.3%, and in the United States it’s as low as 0.3%. How then, does that compare with returns from other asset classes? Well, equities have actually produced much higher returns houses. Since 1900, the 2018 Yearbook states, UK equities have returned an average of 5.5% (and the average return since 1968 is higher still, at 6.4%). Bonds have returned 1.8% over the last 118 years — in other words, the same as the growth in UK house prices — while government bonds, or gilts, returned an average of 1% a year. Again, all of these returns have been adjusted for inflation. Now let’s look at risk. “Housing has been less risky than equities,” the 2018 Yearbook states, “but the expression "safe as houses" is misleading.” As an example, Dimson, Marsh and Staunton cite the US, where “house prices fell by more than 36% in real terms from their late-2005 peak until their low in 2012”. The biggest numerical fall in UK house prices in recent history was between 1989 and 1993, when they dropped 20% across the country and by more than 30% in London. After the global financial crisis of 2007-08 they fell 13%. Of course, both equities have had a very good run. The bull market in global stocks is now more than nine years old. Despite that fall in prices immediately after the financial crash, UK houses have risen steadily in value since the mid-1990s and, according to the Office for National Statistics, houses now cost almost eight times average earnings. Nobody knows where the price of stocks or houses are heading next. As ever, the most sensible approach is to stay diversified and not to be over-exposed to either. If you own your own home, you are already heavily exposed to residential property. If you’re thinking of either trading up to a bigger house or investing in a second property, you need to think carefully whether the benefits outweigh the additional costs and risk involved. Whatever you do, though, don’t invest in property expecting to make a big financial gain, even over the long term. To quote Dimson, Marsh and Staunton: “Residential property should not be purchased with an exaggerated expectation of a large risk premium. It is equity assets that provide an expected reward for risk.” Private clients and families wanting wealth advice, typically want holistic wealth advice.
That's why it's worth remembering that investment capital is only one form of capital. Client fact finding should go well beyond understanding an investment portfolio, to account for other forms of capital - what it is and how it's structured. What are the other key forms of client capital to consider: Land: the oldest capital of all, since "they just don't make it anymore" - how is it held, how is it managed. In the UK agricultural yields nose-dived when the US prairies got going and crisis-related spikes aside, have never fully recovered. But "green gold" remains a resilient, and tax-efficient, store of value, and a source of collateral where productive. Property: principal, residential, and commercial property all require attention and management. Providing a store of value, an income yield and a source of collateral, it's no wonder that bricks and mortar continues to play such an important role in overall wealth. It's all the easiest "immovable" thing to tax. In the UK, taxation for properties has tightened for offshore owners, and now residential buy-to-let properties. Staying on top of the changing tax position is key for any type of property - whether owned for lifestyle or investment. Business: operating businesses can continue to provide an engine for family wealth. Again how it's owned and managed is key, as well as a picture of its capital intensity and capital requirements. How and whether returns are paid out or re-invested all form part of the broader financial landscape. Chattels: chattels are subject to their own esoteric tax treatment, and are a source of pleasure as well as a store of value. Inventorying, maintaining and insuring them are the larger headaches, with different experts needed in different fields. Trust capital: is the client a settlor or beneficiary of discretionary, life interest trust: if so, what are the terms of the trust, who are the trustees, how is it managed, and what is the tax position. Like personal capital, trust capital could simply be an investment portfolio, or itself made up of a mixture of the different types of capital outlined here. Charitable capital: whether supporting a historic, or creating a new charitable fund or trust, ensuring charitable capital is efficiently managed requires a keen eye on economies of scale. Ensuring it is properly and transparently deployed requires commensurate due diligence. Human capital: most of all, there's not much point to well-managed wealth if it can't be modeled to suit client objectives and needs - be these material or emotional. After all, you can't take it with you. Balancing this with an intergenerational view and succession plan is probably the hardest part for an adviser. So whilst there is no shortage of investment portfolio managers to choose from (and selecting, monitoring and reviewing one is another whole challenge), a holistic approach requires much greater scope and a flexible coalition of expertise. Disclosure: I/we have no positions in any stocks mentioned, and no plans to initiate any positions within the next 72 hours. Additional disclosure: This article has been written for a UK audience. For research purposes/market commentary only, does not constitute an investment recommendation or advice, and should not be used or construed as an offer to sell, a solicitation of an offer to buy, or a recommendation for any product. This blog reflects the views of the author and does not necessarily reflect the views of Elston Consulting, its clients or affiliates. For information on Elston’s research, products and services, please see www.elstonconsulting.co.uk Photo credit: Google Images; Chart credit: N/A; Table credit: N/A
Post-Brexit fears around commercial property values has led to managers of three UK property funds locking investors in. They fear a potential rush of investors to sell units following the Brexit result in the EU Referendum. Decisions to suspend will typically reviewed every 28 days. The funds affected are those managed by Standard Life, Aviva and M&G, totalling some £9bn of assets (see table). While the justification given – to “protect the interests of all investors in the fund” – is fair and reasonable, some investors may not be too happy to be locked in for potentially quite a scary ride. The paternalistic reading is that investors are being protected from themselves, as they are denied the temptation to panic sell. Funds that locked in investors in 2008 eventually “came good”. But while investors may agree that “buy and hold” is right for the long run, that’s not the same deal as “buy and be held prisoner at the manager’s will”. This episode shines a much needed spotlight on the opacity around the underlying liquidity within funds that trade in less liquid assets. As always, investment funds are only as liquid as their underlying holdings. One of the main reasons advisers give for using funds over ETFs is that daily liquidity is not necessarily important as their investors take a long-term view. This does however deny the opportunity to make tactical adjustments to changing economic circumstances, particularly event-driven ones such as the UK referendum. What this episode illustrates that by contrast to funds, ETFs benefit from better internal liquidity (they typically invest only in liquid securities), from better daily external liquidity (as they are both OTC and exchange-traded), and from active liquidity management (the creation and redemption of units through capital markets activity by the issuer). For UK investors whose property exposure was through ETFs which such as iShares UK Property UCITS ETF (LSE:IUKP) which tracks the FTSE EPRA/NAREIT UK Property Index, the flexibility remains whether to adjust exposure or to the ride this out. And for portfolio management, flexibility counts. In terms of underlying exposure, Property ETFs and Property Funds are similar but different. Whereas property funds may have direct exposure to commercial or residential property, property ETFs typically own shares in listed real estate companies. As Property ETFs are by nature “equity only”, they can be expected to have higher volatility than property funds that which have exposure to bond-like steady streams of net rental income from less liquid direct holdings. So if risk is defined by standard deviation, it is clearly higher for a property ETF. If risk is defined by liquidity, it is clearly higher for a fund. Aside from volatility, the level of yield from property ETFs relative to funds is comparable, while the overall fee level is of course much lower. Table: Fee Comparison 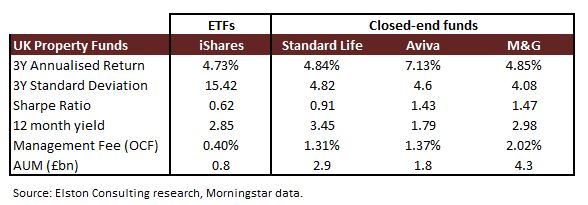 For investors seeking exposure to UK property as an asset class, then exchange-traded liquid ETFs that provide that from a portfolio construction perspective. But importantly, property ETFs won’t share the underlying liquidity risk that is (now) all too apparent.
NOTE Funds compared are iShares UK Property UCITS ETF (GBP), Standard Life Investments UK Real Estate Fund Retail Acc, Aviva Investors Property Trust 1 GBP Acc, M&G Feeder of Property Portfolio Sterling A Acc. Returns data as of 5th July 2016 (except M&G as of 4th July 2016). Standard deviationfigures as of 30th June 2016 for all funds. NOTICES: I/we have no positions in any stocks mentioned, and no plans to initiate any positions within the next 72 hours. I wrote this article myself, and it expresses my own opinions. I am not receiving compensation for it. This article has been written for a US and UK audience. Tickers are shown for corresponding and/or similar ETFs prefixed by the relevant exchange code, e.g. “NYSEARCA:” (NYSE Arca Exchange) for US readers; “LON:” (London Stock Exchange) for UK readers. For research purposes/market commentary only, does not constitute an investment recommendation or advice, and should not be used or construed as an offer to sell, a solicitation of an offer to buy, or a recommendation for any product. For more information see www.elstonconsulting.co.uk Photo credit: pictogram-free.com. Table credit: Elston Consulting |
ELSTON RESEARCHinsights inform solutions Categories
All
Archives
April 2024
|
 RSS Feed
Company |
Solutions |
|