
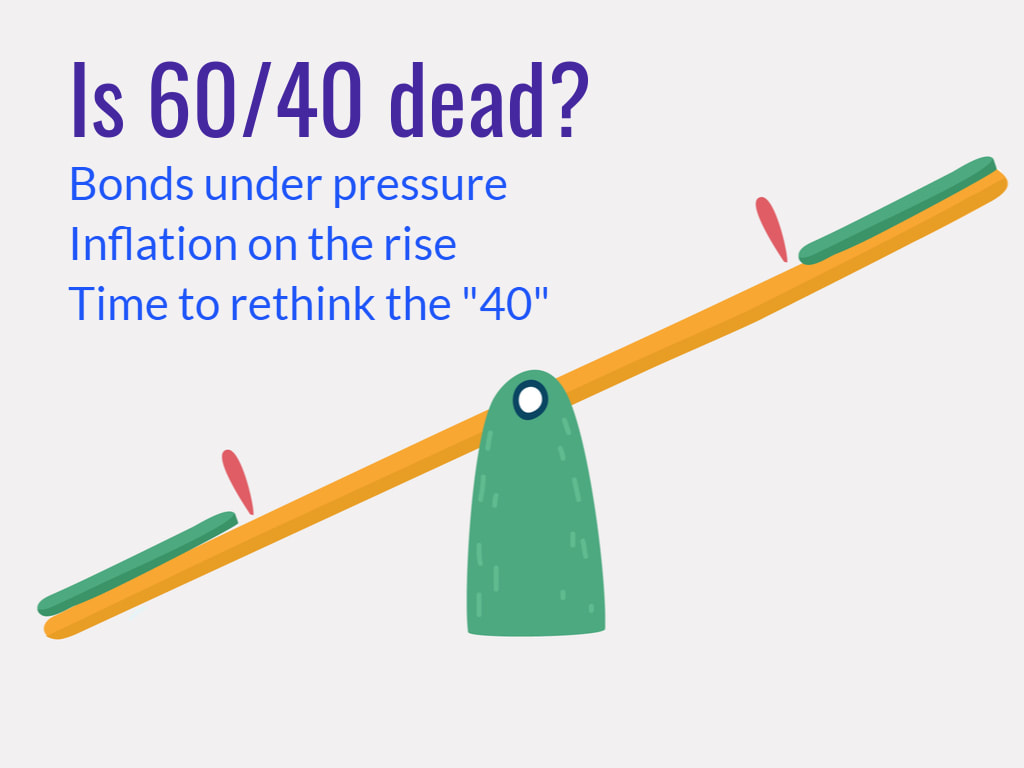
 [ 5 min read, open as pdf]
Since an article published in 2019 pointed the historic lows in bond yields, many investment firms are starting to rethink the 60/40 portfolio. This came under even more scrutiny following the market turmoil of 2020. While some affirm that the 60/40 will outlive us all, others argue against this notion. We take a look at the main arguments for and against and key insights What is a 60/40 portfolio? A 60/40 equity/bond portfolio is a heuristic “rule of thumb” approach considered to be a proxy for the optimal allocation between equities and bonds. Conventionally equities were for growth and bonds were for ballast. The composition of a 60/40 portfolio might vary depending on the base currency and opportunity set of the investor/manager. Defining terms is therefore key. We summarise a range of potential definitions of terms: 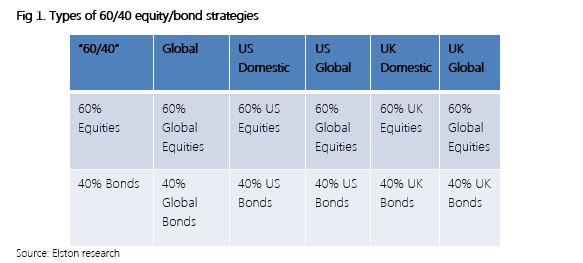 Furthermore, whilst 60/40 seems simple in terms of asset weighting scheme, it is important to understand the inherent risk characteristics that this simple allocation creates. For example, a UK Global 60/40 portfolio has 62% beta to Global Equities; equities contribute approximately 84% of total risk, and a 60/40 portfolio is approximately 98% correlated to Global Equities[1]. [1] Elston research, Bloomberg data. Risk Contribution based on Elston 60/40 GBP Index weighted average contribution to summed 1 Year Value At Risk 95% Confidence as at Dec-20. Beta Correlation to Global Equities based on 5 year correlation of Elston 60/40 GBP Index to global equity index as at Dec-20. 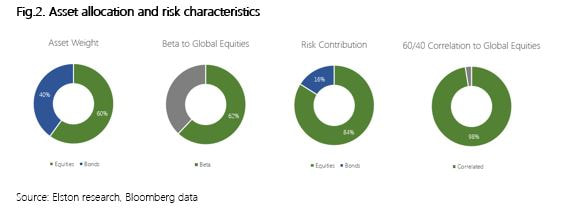 Why some think 60/40 will outlive us all. The relevance of 60/40 portfolio lies in its established historic, mathematical and academic backup. Whilst past performances do not guarantee future returns, it nonetheless provides us with experience and guidance. (Martin,2019) Research also suggests that straightforward heuristic or “rule-of-thumb” strategies work well because they aren’t likely to inspire greed or fear in investors. They become timeless. Thus, creating a ‘Mind-Gap’. (Martin,2019) In the US, the Vanguard Balanced Index Fund (Ticker: VBINX US) which combines US Total Market Index and 40% into US Aggregate bonds, plays a major role in showcasing the success of the 60/40 portfolio that has proved popular with US retail investors (Jaffe,2019). Similarly, in the UK the popularity of Vanguard LifeStrategy 60% (Ticker VGLS60A) showcases the merits of a straightforward 60/40 equity/bond approach. In 2020, for US investors VBINX provided greater (peak-to-trough) downside protection owing to lower beta (-19.5% vs -30.3% for US equity) and delivered total return of +16.26% volatility of 20.79%, compared to +18.37% for an ETF tracking the S&P 500 with volatility of 33.91%, both funds are net of fees. In this respect, the strategy captured 89% of market returns, with 61% of market risk. 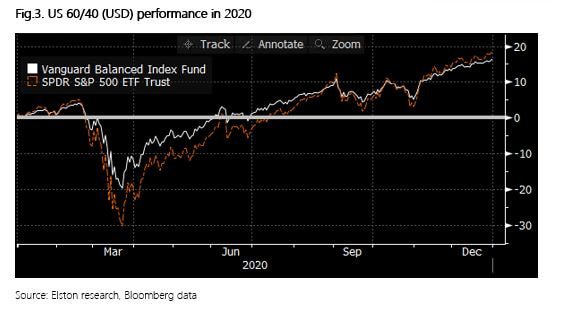 For GBP-based investors in 2020 the 60/40 approach had lower (peak-to-trough) drawdown levels (-15%, vs -21% for global equities) owing to lower beta. The 60% equity fund delivered total return of +7.84% with volatility of 15.12%, compared to +12.15% for an ETF tracking the FTSE All World Index with volatility of 24.29%. In this respect, the strategy captured 65% of market returns, with 62% of market risk. 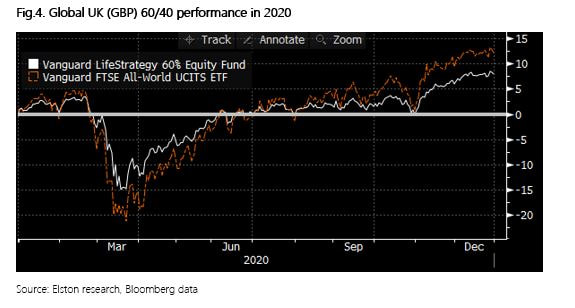 Why some think 60/40 has neared its end
Since its inception the 60/40 portfolio, derived 90% of the risk from stocks. In simple terms, 60% of the asset allocation of the portfolio was therefore the main driver of the portfolio. Returns (Robertson,2021). This hardly a surprise given that equities have a 84% contribution to portfolio ris, on our analysis, but the challenge made by some researchers is that if a 60/40 portfolio mainly reflects equity risk, what role does the 40% bond allocation provide, other than beta reduction? The bond allocation is under increasing scrutiny now is because global economic growth has slowed and traditionally safer asset classes like bonds have grown in popularity making bonds susceptible to sharp and sudden selloffs. (Matthews,2019) Strategists such as for Woodard and Harris, for Bank of America and Bob Rice for Tangent Capital have stated in their analysis that the core premise of the 60/40 portfolio has declined as equity has provided income, and bonds total return, rather than the other way round.. (Browne,2020) Another study shows that over the past 65 years bonds can no longer effectively hedge against inflation and risk reduction through diversification can be done more adequately by exploring alternatives such as private equity, venture capital etc. (Toschi, 2021). Left unconstrained, however, this can necessarily up-risk portfolios. With bond yields at an all-time low, nearing zero and the fact that they can no longer provide the protection in the up-and-coming markets many investors query the value provided by a bond allocation within a portfolio. (Robertson,2021) Key insights While point of views might differ about 60/40 as an investment strategy, one aspect that is accepted is that the future of asset allocation looks very different when compared to the recent past. Rising correlations, low yields have led strategists and investors to incorporate smarter ways of risk management, explore new bond markets like China, create modified opportunities for bonds to hedge volatility through risk parity strategies, as well as using real asset exposure such as real estate and infrastructure. (Toschi, 2021) Research conducted by The MAN Institute summarises that modifying from traditional to a more trend-following approach introduces the initial layer of active risk management. By adding an element of market timing investors further reduce the risk, when a market’s price declines. While bonds have declined in yield, they still hold importance in asset allocation for beta reduction. Further diversifying the portfolio with an allocation to real assets has potential to provide more yield and increased return than government bonds. Summary The 60/40 portfolio strategy has established itself over many decades, it has seen investors through four major wars, 14 recessions, 11 bear markets, and 113 rolling interest rate spikes. It has proved resilience as a strategy and utility as a benchmark. Our conclusion is that 60/40 is not dead: it is a useful multi-asset benchmark and remains a starting point for strategic asset allocation strategies. But the detail of the bond allocation needs a rethink. Incorporating alternative assets or strategies so long as any increased risk can be constrained to ensure comparable portfolio risk characteristics. Henry Cobbe & Aayushi Srivastava Elston Consulting Bibliography Browne, E., 2021. The 60/40 Portfolio Is Alive and Well. [online] Pacific Investment Management Company LLC. Available at: https://www.pimco.co.uk/en-gb/insights/blog/the-60-40-portfolio-is-alive-and-well Jaffe, C., 2019. No sale: Don’t buy in to ‘the end’ of 60/40 investing. [online] Seattle Times. Available at: https://www.seattletimes.com/business/no-sale-dont-buy-in-to-the-end-of-60-40-investing/ Martin, A., 2019. The 60/40 Portfolio Will Outlive Us All. [online] Advisorperspectives.com. Available at:https://www.advisorperspectives.com/articles/2019/11/11/the-60-40-portfolio-will-outlive-us-all#:~:text=As%20two%20recent%20commentaries%20demonstrate,40%20will%20outlive%20us%20all. Matthews, C., 2021. Bank of America declares ‘the end of the 60-40’ standard portfolio. [online] MarketWatch. Available at:https://www.marketwatch.com/story/bank-of-america-declares-the-end-of-the-60-40-standard-portfolio-2019-10-15 Robertson, G., 2021. 60/40 in 2020 Vision | Man Institute. [online] www.man.com/maninstitute. Available at:https://www.man.com/maninstitute/60-40-in-2020-vision Toschi, M., 2021. Why and how to re-think the 60:40 portfolio | J.P. Morgan Asset Management. [online] Am.jpmorgan.com. Available at: https://am.jpmorgan.com/be/en/asset-management/adv/insights/market-insights/on-the-minds-of-investors/rethinking-the-60-40-portfolio/  [3 min read, open as pdf] Inflation is on the rise Easy central bank money, pent up demand after lockdowns and supply-chain constraints mean inflation is on the rise. Will Central Banks be able to keep the lid on inflation? The risk is that it could persistently overshoot target levels. 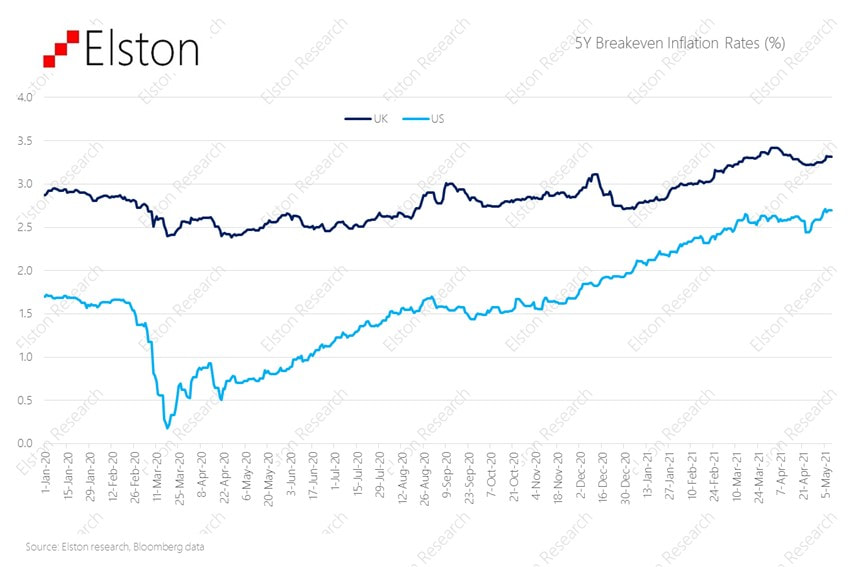 It matters more over time Inflation erodes the real value of money: its “purchasing power”. If inflation was on target (2%), £100,000 in 10 year’s time would be worth only £82,035 in today’s money. But on current expectations, it could be worth a lot less than that. 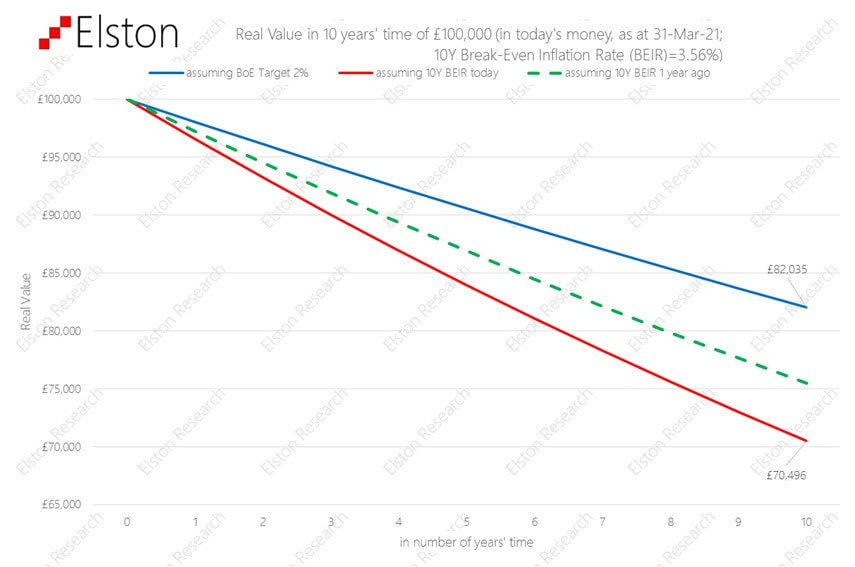 Real assets can help
A bank note is only as valuable as the value printed on it. This is called its “nominal value”. Remember the days when a £5 note went a long way? When inflation rises, money loses its real value. By contrast, real assets are things that have a real intrinsic value over time whose value is set by supply, demand and needs: like copper, timber, gold, oil, and wheat. Real assets can also mean things that produce an regular income which goes up with inflation, like infrastructure companies (pipelines, toll roads, national grid etc) and commercial property with inflation-linked rents. Rethinking portfolio construction Including “real assets” into the mix can help diversify a portfolio, and protect it from inflation. Obviously there are no guarantees it will do so perfectly, but it can be done as a measured approach to help mitigate the effects of inflation. The challenge is how to do this without taking on too much risk. Find out more about our Liquid Real Assets Index  [5min read, open as pdf]
We agree it’s time to rethink the 60/40 portfolio. It’s a useful benchmark, but a problematic strategy. What is the 60/40 portfolio, and why does it matter? What it represents? Trying to find the very first mention of a 60/40 portfolio is proving a challenge, but it links back to Markowitz Modern Portfolio Theory and was for many years seen as close to the optimal allocation between [US] equities and [US] bonds. Harry Markowitz himself when considering a “heuristic” rule of thumb talked of a 50/50 portfolio. But the notional 60/40 equity/bond portfolio has been a long-standing proxy for a balanced mandate, combining higher-risk return growth assets with lower-risk-return, income generating assets. What’s in a 60/40? Obviously the nature of the equity and the nature of the bonds depends on the investor. US investor look at 60% US equities/40% US treasuries. Global investors might look at 60% Global Equities/40% Global Bonds. For UK investors – and our Elston 60/40 GBP Index – we look at 60% predominantly Global Equities and 40% predominantly UK bonds Why does it matter? In the same way as a Global Equities index is a useful benchmark for a “do-nothing” stock picker, the 60/40 portfolio is a useful benchmark for a “do-nothing” multi-asset investor. Multi-asset investors, with all their detailed decision making around asset allocation, risk management, hedging overlays and implementation options either do better than, or worse than this straightforward “do-nothing” approach of a regularly rebalanced 60/40 portfolio. Indeed – its simplicity is part of its appeal that enables investors to access a simple multi-asset strategy at low cost. The problem with Bonds in a 60/40 framework In October 2019, Bank of America Merrill Lynch published a research paper “The End of 60/40” which argues that “the relationship between asset classes has changed so much that many investors now buy equities not for future growth but for current income, and buy bonds to participate in price rallies”. This has prompted a flurry of opinions on whether or not 60/40 is still a valid strategy The key challenges with a 60/40 portfolio approach is more on the bond side:
So is 60/40 really dead? In short, as a benchmark no. As a strategy – we would argue that for serious investors, it never was one. We therefore think it’s important to distinguish between 60/40 as an investment strategy and 60/40 as a benchmark. We think that a vanilla 60/40 equity/bond portfolio remains useful as a benchmark to represent the “do nothing” multi-asset approach. However, we would concur that a vanilla 60/40 equity/bond portfolio, as a strategy offered by some low cost providers does – at this time – face the significant challenges identified in the 2019 report, that have been vindicated in 2020 and 2021. For example, during the peak of the COVID market crisis in March 2020, correlations between equities and bonds spiked upwards meaning there was “no place to hide”. The growing inflation risk has put additional pressure on nominal bonds. Real yields are negative. Interest rates won’t go lower. But outside of some low-cost retail products, very few portfolio managers, would offer a vanilla equity/bond portfolio as a client strategy. The inclusion of alternatives have always had an important role to play as diversifiers. Rethinking the 40%: What are the alternatives? When it comes to rethinking the 60/40 portfolio, investors will have a certain level of risk budget. So if that risk budget is to be maintained, there is little change to the “60% equity” part of a 60/40 portfolio. What about the 40%? We see opportunity for rethinking the 40% bond allocation by: We nonetheless think it is important to:
1. Rethinking the bond portfolio Whilst more extreme advocates of the death of 60/40 would push for removing bonds entirely, we would not concur. Bonds have a role to play for portfolio resilience in terms of their portfolio function (liquidity, volatility dampener), so would instead focus on a more nuanced approach between yield & duration. We would concur that long-dated nominal bonds look problematic, so would suggest a more “barbell” approach between shorter-dated bonds (as volatility dampener), and targeted, diversified bond exposures: emerging markets, high yield, inflation-linked (for diversification and real yield pick-up). 2. Incorporating sensible alternative assets Allocating a portfolio of the bond portfolio to alternatives makes sense, but we also need to consider what kind of alternatives. Whilst some managers are making the case for hedge funds or private markets as an alternative to bonds, we think there are sensible cost-efficient and liquid alternatives that can be considered for inclusion that either have bond-like characteristics (regular stable income streams), or provide inflation protection (real assets). For regular diversified income and inflation protection, we would consider: asset-backed securities, infrastructure, utilities and property. The challenge, however, is how to incorporate these asset classes without materially up-risking the overall portfolio. For inflation protection, we would consider real assets: property, diversified, commodities, gold and inflation-protected bonds. Properly incorporated these can fulfil a portfolio function that bonds traditionally provided (liquidity, income, ballast and diversification). 3. Consider risk-based diversification as an alternative strategy One of the key reasons for including bonds in a multi-asset portfolio is for diversification purposes from equities on the basis that one zigs when the other zags. In the short-term, and particularly at times of market stress, correlations between asset classes can increase, this reduces the diversification effect if bonds zag when equities zag. We would argue risk-based diversification strategies have a role to play to here, on the basis that rather than relying on long-run theoretical correlation, they systematically focus on short-run actual correlation between asset classes and adapt their asset allocation accordingly. Traditional portfolios means choosing asset weights which then drive portfolio risk and correlation metrics. Risk-based diversification strategies do this in reverse: they use short-run portfolio risk and correlation metrics to drive asset weights. If the ambition is to diversify and decorrelate, using a strategy that has this as its objective makes more sense. Summary So 60/40 is not dead. It will remain a useful benchmark for mult-asset investors. As an investment strategy, vanilla 60/40 equity/bond products will continue to attract assets for their inherent simplicity. But we do believe a careful rethink of the “40” is required.  [5 min read, open as pdf]
Commodity indices, and the ETPs that track them provide a convenient way of accessing a broad commodity basket exposure with a single trade. What’s inside the basket? Commodity indices represent baskets of commodities constructed using futures prices. The Bloomberg Commodity Index which was launched in 1998 as the Dow Jones-AIG Commodity Index has a weighting scheme is based on target weights for each commodity exposure. These weights are subject to the index methodology rules that incorporate both liquidity (relative amount of trading activity of a particular commodity) and production data (actual production data in USD terms of a particular commodity) to reflect economic significance. The index subdivides commodities into “Groups”, such as: Energy (WTI Crude Oil, Natural Gas etc), Grains (Corn, Soybeans etc), Industrial Metals (Copper, Aluminium etc), Precious Metals (Gold, Silver), Softs (Sugar, Coffee, Cotton) and Livestock (Live Cattle, Lean Hogs). The index rules include diversification requirements such that no commodity group constitutes more than 33% weight in the index; no single commodity (together with its derivatives) may constitute over 25% weight); and no single commodity may constitute over 15% weight. The target weights for 2021 at Group and Commodity level is presented below: 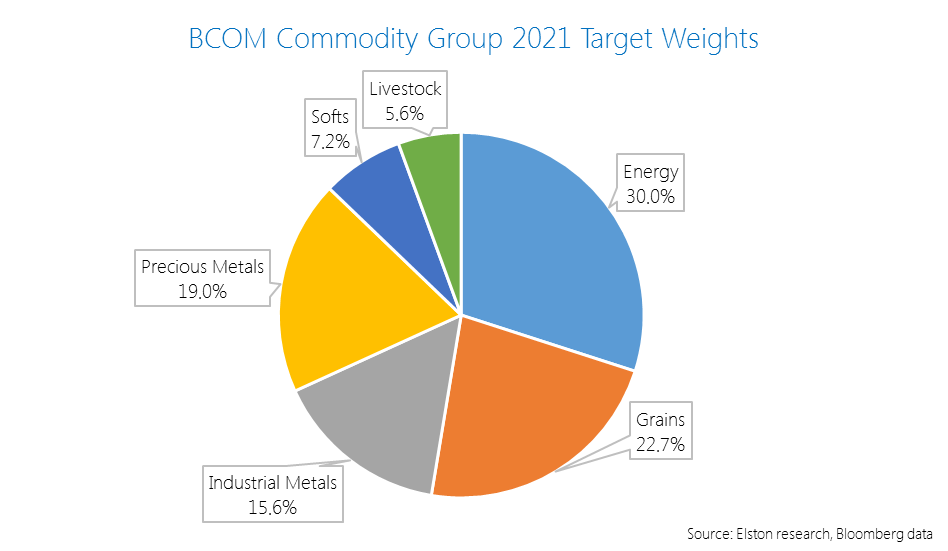 Owing to changes in production and or liquidity, annual target weights can vary. For example the material change in weight in the 2021 target weights vs the 2020 target weights was a +1.6ppt increase in Precious Metals (to 19.0%) and a -1.9pp decrease in Industrial Metals to 15.6%. Traditional vs “Smart” weighting schemes One of the drawbacks of the traditional production- and liquidity-based weighting scheme is that they are constructed with short-dated futures contracts. This creates a risk when futures contracts are rolled because for commodities where the forward curve is upward sloping (“contango”), the futures price of a commodity is higher than the spot price. Each time a futures contract is rolled, investors are forced to “buy high and sell low”. This is known as “negative roll yield”. A “smart” weighting scheme looks at the commodity basket from a constant maturity perspective, rather than focusing solely on short-dated futures contracts. This approach aims to mitigate the impact of negative roll yield as well as potential for reduced volatility, relative to traditional indices. This Constant Maturity Commodity Index methodology was pioneered by UBS in 2007 and underpins the UBS Bloomberg BCOM Constant Maturity Commodity Index and products that track it. Illustration of futures rolling for markets in contango 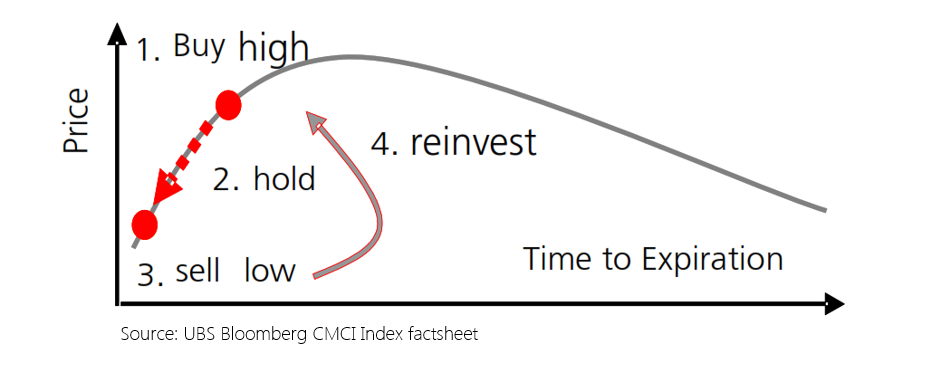 An Equal Weighted approach Whilst the traditional index construction considers economic significance in terms of production and liquidity, investors may seek alternative forms of diversified commodities exposure, such as Equal Weighted approach. There are two ways of achieving this, equal weighting each commodity, or equal weighting each commodity group. The Refinitiv Equal Weight Commodity Index equally weights each if 17 individual commodity components, such that each commodity has a 5.88% (1/17th) weight in the index. This results in an 18% allocation to the Energy Group, 47% allocation to the Agriculture group, 12% allocation to the Livestock group and 23% allocation to Precious & Industrial Metals. An alternative approach is to equally weight each commodity group. This is the approach we take in the Elston Equal Weight Commodity Portfolio, which has a 25% allocation to Energy, a 25% allocation to Precious Metals, a 25% Allocation to Industrial Metals and a 25% Allocation to Agricultural commodities. This is on the basis that commodities components within each group will behave more similarly than commodity components across groups. These two contrasting approaches are summarised below: 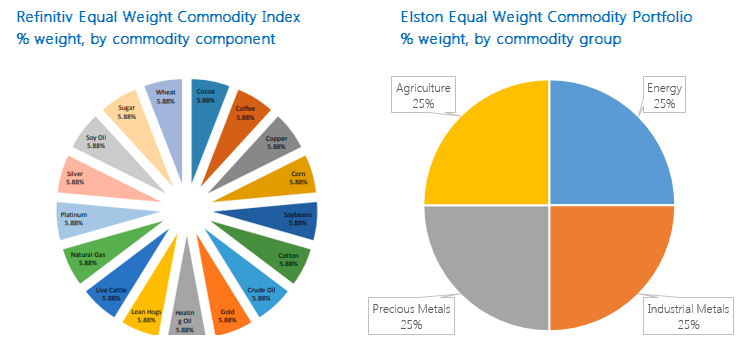 Performance In 2020, the Equal Weight component strategy performed best +6.28%. The Constant Maturity strategy delivered +0.69%. The Equal Weight Group strategy was flat at -0.05% and the traditional index was -5.88%, all expressed in GBP terms. 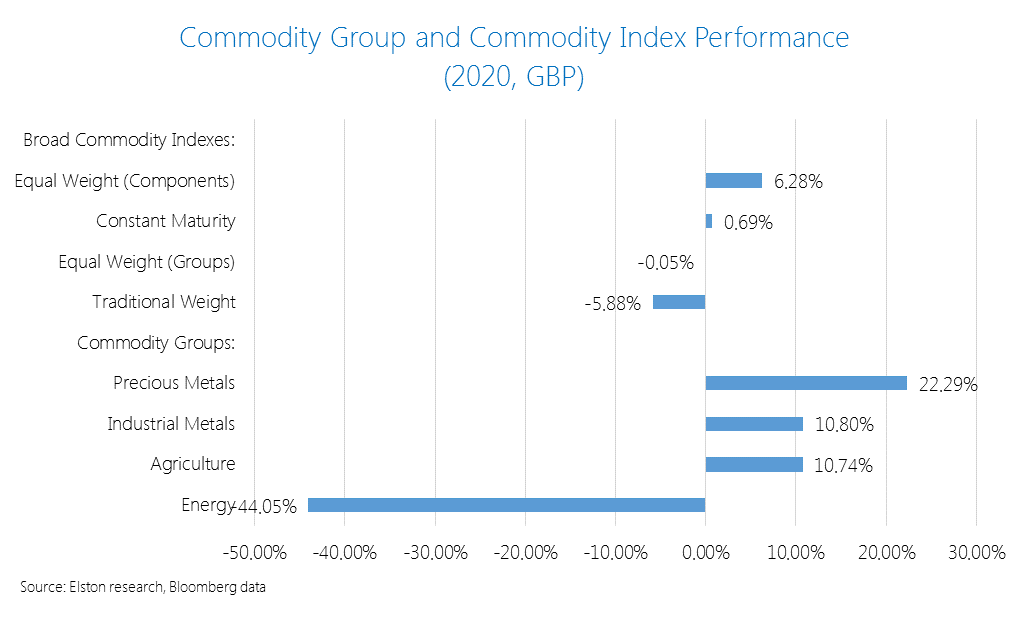 Informed product selection This summarises four different ways of accessing a diversified commodity exposure: traditional weight, constant maturity weighting, equal component weighting and equal group weighting. Understanding the respective strengths and weaknesses of each approach is an important factor for product selection.  [3 min read, open as pdf]
Focus on inflation In our recent Focus on Inflation webinar we cited the study by Briere & Signori (2011) looking at the long run correlations between asset returns and inflation over time. We highlighted the “layered” effect of different inflation protection strategies (1973-1990) with cash (assuming interest rate rises), and commodities providing best near-term protection, inflation linked bonds and real estate providing medium-term protection, and equities providing long-term protections. Nominal bonds were impacted most negatively by inflation. 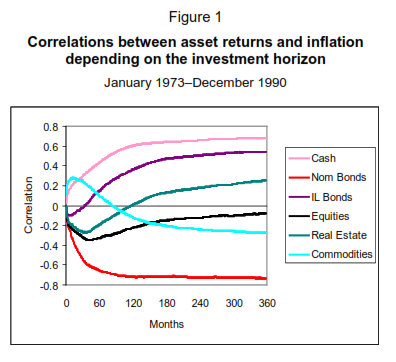 Source: Briere & Signori (2011), BIS Research Papers Given the growing fears of inflation breaking out, we plotted the YTD returns of those “inflation-hedge” asset classes, in GBP terms for UK investors, with reference to the US and UK 5 Year Breakeven Inflation Rates (BEIR). Figure 2: Inflation-hedge asset class performance (GBP, YTD) vs US & UK 5Y BEIR 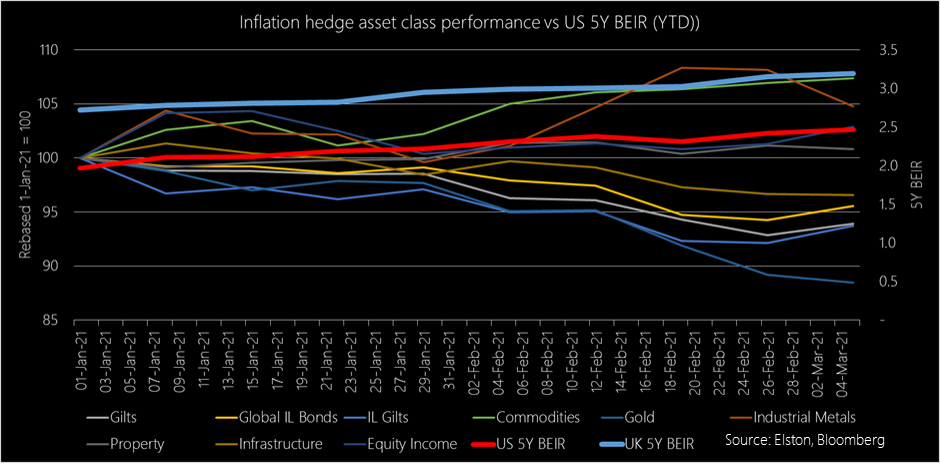 Source: Elston research, Bloomberg data, as at 5th March 2021
Winners and Losers so far We looked at the YTD performance in GBP of the following broad “inflation hedge” asset classes, each represented by a selected ETF: Gilts, Inflation Linked Gilts, Commodities, Gold, Industrial Metals, Global Property, Multi-Asset Infrastructure and Equity Income. Looking at price performance year to date in GBP terms:
So Inflation-Linked Gilts don’t provide inflation protection? Not in the short run, no. UK inflation linked gilts have an effective duration of 22 years, so are highly interest rate sensitive. Fears that inflation pick up could lead to a rise in interest rates therefore reduces the capital value of those bond (offset by greater level of income payments, if held to maturity). So whilst they provide medium- to long-term inflation protection, they are poor protection against a near-term inflation shock. Conclusion In conclusion, we observe:
 [2 min read, open as pdf]
A Factor-based approach to investing Factor-based investing means choosing securities for an inclusion in an index based on what characteristics or factors drive their risk-return behaviour, rather than a particular geography or sector. Just like food can be categorised simply by ingredients, it can also be analysed more scientifically by nutrients. Factors are like the nutrients in an investment portfolio. What are the main factors? There is a realm of academic and empirical study behind the key investment factors, but they can be summarised as follows The different factors can be summarised as follows:
Which has been the strongest performing factor? Momentum has been the best performing factor over the last 5 years. Value has been the worst performing factor. Fig.1. World equity factor performance 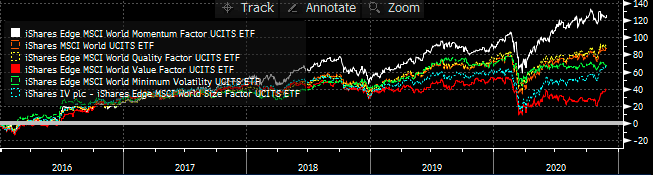 Source: Elston research, Bloomberg data A crowded trade? Data points to Momentum being a “crowded trade”, because of the number of people oerweighting stocks with momentum characteristics. This level of crowdedness can be an indicator of potential drawdowns to come. Fig.2. Momentum Factor is looking increasingly crowded 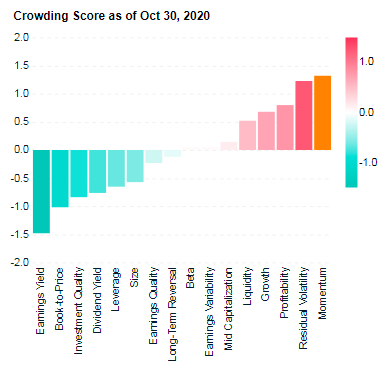 Source: MSCI Factor Crowding Model The best time to buy into a Momentum strategy has been when it is uncrowded – like in 2001 and 2009, which is also true of markets more generally. MSCI’s research suggests that with crowding scores greater than 1 were historically more likely to experience significant drawdowns in performance over subsequent months than factors with lower crowding scores. Fig.3. Factors with higher crowding score can be an indicator of greater potential drawdowns, relative to less crowded factors 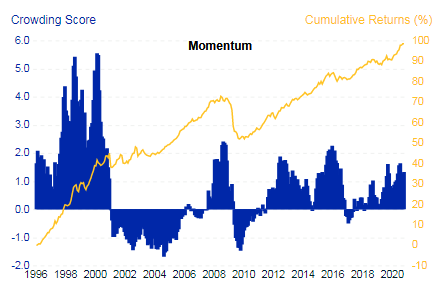 Source: MSCI Factor Crowding Model
Rotation to Value The value-based approach to investing has delivered lack lustre performance in recent times, hence strategists’ calls that there may be a potential “rotation” into Value-oriented strategies in coming months as the post-COVID world normalises. But can factors be timed? Marketing timing, factor timing? Market timing is notoriously difficult. Factor timing is no different. To get round this, a lot of fund providers have offered multi-factor strategies, which allocate to factors either statically or dynamically. Whilst convenient as a catch-all solution, unless factor exposures are dynamically and actively managed, the exposure to all factors in aggregate will be similar to overall market exposure. This has led to a loss of confidence and conviction in statically weighted multi-factor funds. Summary Factors help break down and isolate the core drivers of risk and return.
For more on Factor investing, see https://www.elstonsolutions.co.uk/insights/category/factor-investing https://www.msci.com/factor-investing |
ELSTON RESEARCHinsights inform solutions Categories
All
Archives
April 2024
|
 RSS Feed
Company |
Solutions |
|