
We conducted a Survey of senior portfolio managers and decision makers from firms whose combined assets under management is in excess of £500bn. The survey was designed to get a better understanding on how those managers approach bond investing. Our key findings based on the survey are summarised below:
For more information and important notices, view the full report. Disclosure: I/we have no positions in any stocks mentioned, and no plans to initiate any positions within the next 72 hours. Additional disclosure: The data in this article comes from an Elston ETF Research report “Bond ETF Investing Survey” that was sponsored by State Street Global Advisors Limited. We warrant that the information in this article is presented objectively. For further information, please refer to important Notices and Disclosures in that Report which is available on our website www.ElstonETF.com This article has been written for a UK audience. Tickers are shown for corresponding and/or similar ETFs prefixed by the relevant exchange code, e.g. “LON:” (London Stock Exchange) for UK readers. For research purposes/market commentary only, does not constitute an investment recommendation or advice, and should not be used or construed as an offer to sell, a solicitation of an offer to buy, or a recommendation for any product. This article reflects the views of the author and does not necessarily reflect the views of Elston Consulting, its clients or affiliates. For information and disclaimers, please see www.ElstonETF.com Image credit: Elston Consulting; Chart credit: Elston Consulting; Table credit: Elston Consulting BMO has lowered the cost of its bond ETF range by -43% from 30bp to 17bp as it passes through the economies of scale to end investors.
BMO’s bond ETFs offer access to the global corporate bond market, whilst giving investors the choice to select their preferred exposure, as defined by maturity. iShares offers the most popular London-listed global corporate bond ETF (CRPS). This tracks the Bloomberg Barclays Global Aggregate Corporate Bond Index at 0.20% TER. Its GBP-hedged version (CRHG) understandably costs slightly more at 0.25% TER for the convenience of in-built currency hedging. Like iShares, BMO also offers a GBP-hedged range, but has a more nuanced approach by offering investors a choice of three different ETFs each with a different maturity range: 1 to 3 years (ZC1G), 3 to 7 years (ZC3G) and 7 to 10 years (ZC7G). This compares to the average maturity of the main index of approximately 9 years. The ability to access this exposure by maturity is particularly useful for UK institutional and pension scheme investors who are looking to construct liability-relative portfolios where both duration and currency controls are important to avoid asset-liability mismatches. The BMO range has gathered some £117m AUM since launch in November 2015 (inflows of £3m per month on average). This compares to iShares' CRPS size of £824m since launch in September 2012 (inflows of £12m per month on average). As the advantages of bond investing with ETFs become more apparent (secondary liquidity, transparent exposure, daily disclosure of underlying), we expect increasing price competition and greater nuance within the most popular strategies. ETFs mentioned ZC1G BMO Barclays 1-3 Year Global Corporate Bond (GBP Hedged) 0.17% TER ZC3G BMO Barclays 3-7 Year Global Corporate Bond (GBP Hedged) 0.17% TER ZC7G BMO Barclays 7-10 Year Global Corporate Bond (GBP Hedged) 0.17% TER CRPS iShares Global Corporate Bond (Unhedged) 0.20% TER CRHG iShares Global Corporate Bond (GBP Hedged ) 0.25% TER (All ETFs mentioned are UCITS ETFs listed on the London Stock Exchange)
What are CoCos? Following the 2008 financial crisis, banks had difficulty issuing traditional debt securities, and had to sit on a large amount of capital to ensure their balance sheet strength was maintained. CoCos were created as the issuing banks flexible friend. This is because are designed to absorb losses when the balance sheet of the issuing banks weakens below a threshold level. Losses can be absorbed by the CoCo converting into equity or suffering a write-down of its principal value making it more flexible than traditional bank securities. To offset the risk of loss, CoCos are issued with a higher coupon than traditional bank bonds. Accessing CoCos Whilst bond funds may include CoCos, direct access to CoCos as a targeted allocation was previously only available to institutions who could meet minimum issuance sizes from one or more issuer. By accessing CoCos using an ETF, the minimum investment drops to $100, and the ETF is diversified across 29 CoCos from 24 different issuers. Why include CoCos in a portfolio? Convertibility into the issuing bank’s shares means that CoCos provide an exposure that has both bond and equity-like characteristics. When there is higher risk of balance sheet stress, CoCo's behave more like equities. When there is lower risk of balance sheet stress, CoCo’s behave more like bonds. CoCos' moderate correlation to equities and low correlation to Corporate and Government Bonds makes them a useful diversifier from a portfolio construction perspective. Fig.1. Correlations to major asset classes 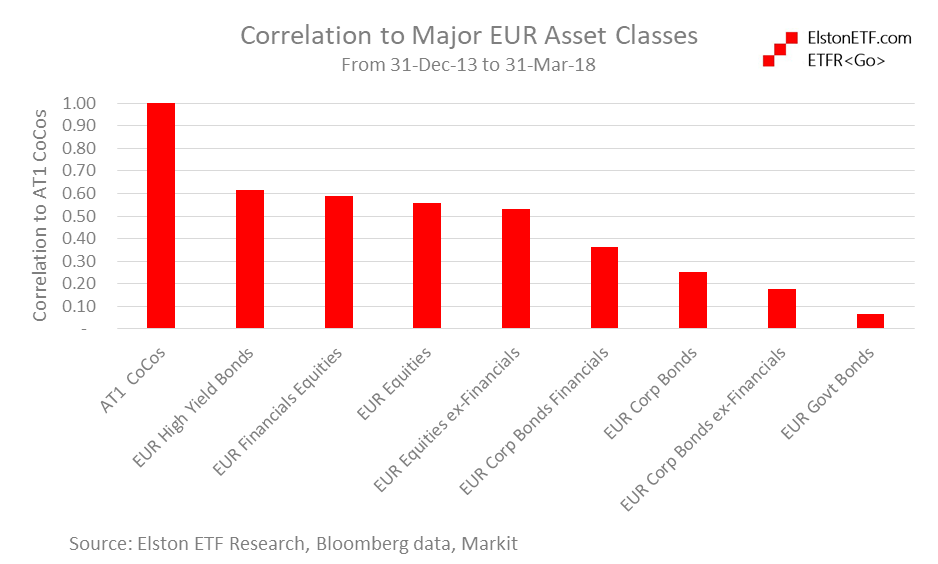 Bigger income & better credit quality CoCos have an attractive income to reward risk taken, but a better quality credit rating compared to traditional High Yield Bonds. Fig.2. Income Profile 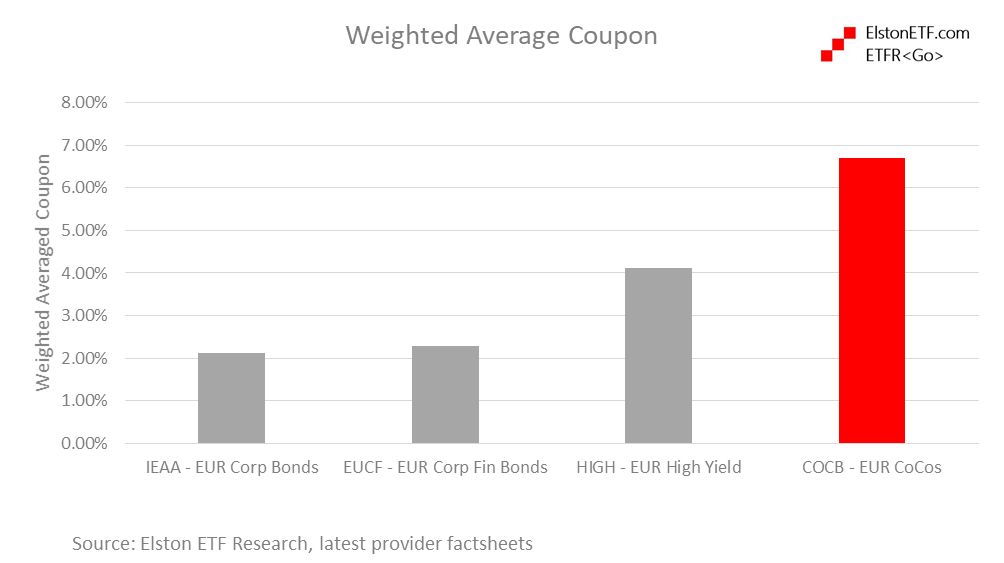 Fig.3. Credit Profile 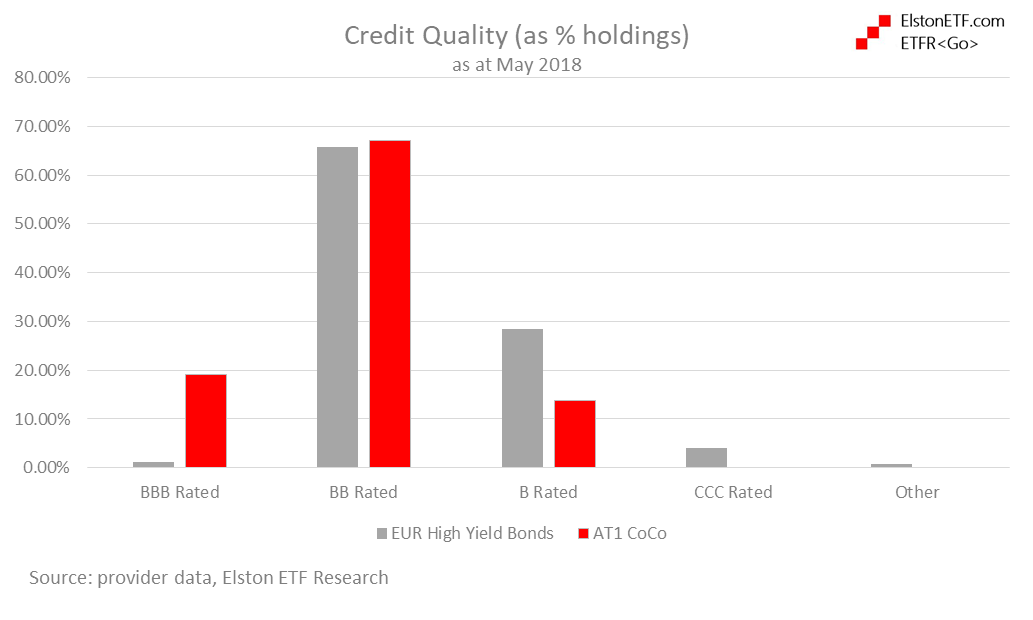 Furthermore, in terms of counterparty risk, CoCos are only issued by large banks that are well regulated with high capital ratios. How about performance? CoCos have outperformed EUR bonds and equities, both excluding and including Financials exposure. Fig.4. Total Returns 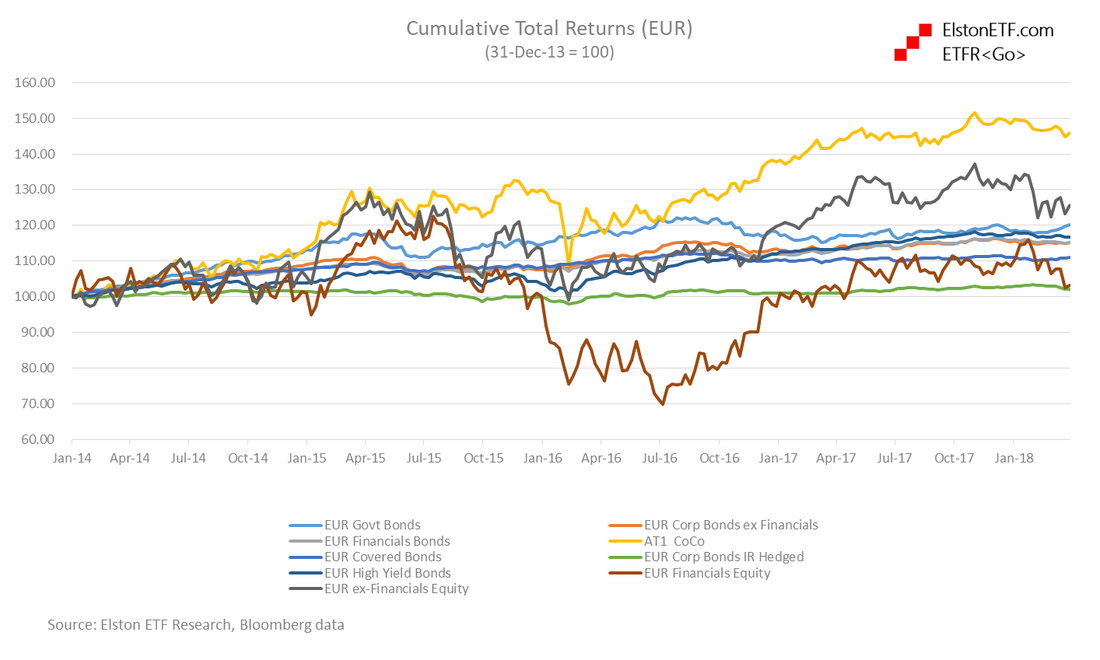 CoCos are positioned between equities and bonds in respect of realised volatility, but with better risk-adjusted returns. Fig.5. Risk-Return 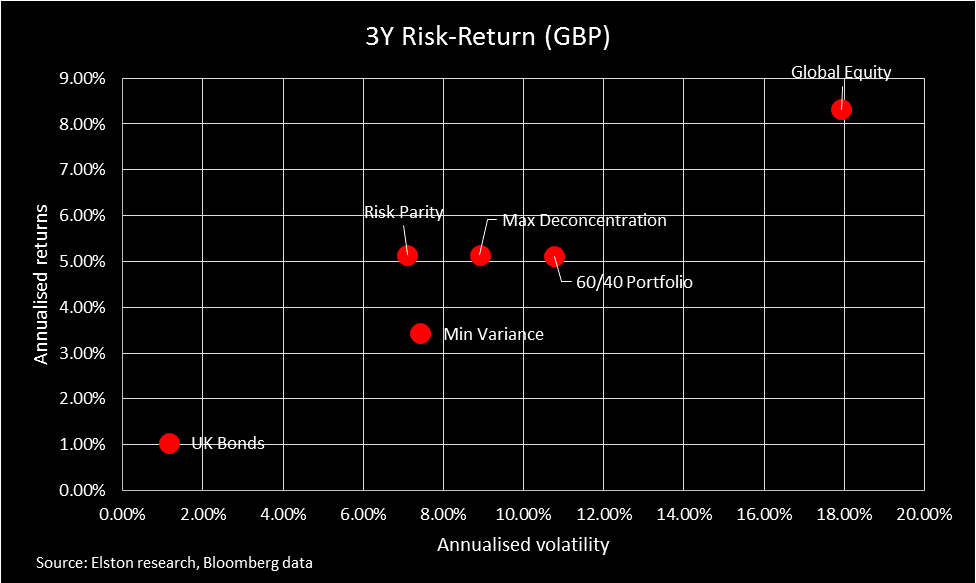 In summary, CoCos have offered solid risk-adjusted returns (Sharpe Ratio), and have a low correlation to bonds from a diversification perspective and a higher income with better credit quality relative to traditional high yield bonds.
October saw a sharp one month loss for global sovereigns owing to inflation fears, raised interest rate expectations and declining Central Bank appetite for QE. In the US, prospects of a December Fed Rate hike saw 10 year yields clime 30bp on month and 76bp from summer lows to 1.26%, whilst stronger growth numbers raised inflation expectations and positive performance for TIPS. The USD performance for inflation-linked treasuries was -0.33% (LSE:ITPS), compared to for -1.32% (LON:IBTM) for conventional treasuries. In the EU, fears over the ECB’s commitment to QE contributed to the sell off. The EUR performance for inflation-linked Euro government bonds (LSE:IBCI) was -1.78%, compared to for -2.14% for conventional Euro government bonds (LSE:IEGA). In the UK, the inflationary potential from Brexit, and vanishing expectations of any further BoE rate cuts on stronger economic growth led to a gilts sell off. The GBP performance for inflation-linked gilts (LSE:INXG) was -0.65%, compared to -3.92% for (LSE:IGLT) for conventional gilts. 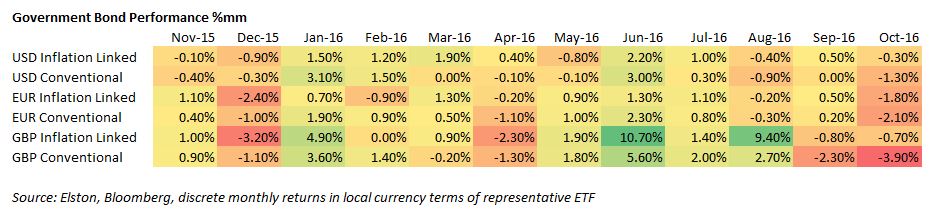 |
ELSTON RESEARCHinsights inform solutions Categories
All
Archives
April 2024
|
 RSS Feed
Company |
Solutions |
|