
 [5 min read, open as pdf]
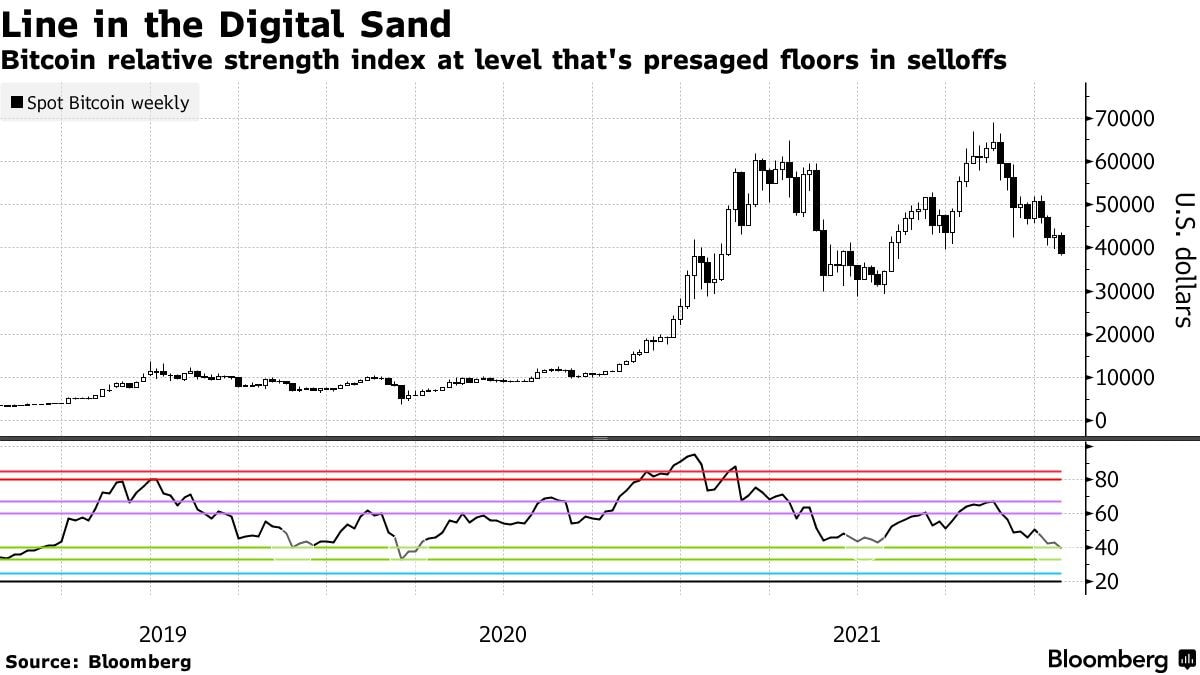
A great technology, an inappropriate asset In discussions with financial advisers, our position has consistently been that whilst blockchain is undoubtedly a breakthrough technology, Bitcoin is not an appropriate asset for retail investors’ portfolios. Read the full report in pdf  [3 min read, open as pdf]
2021 in review Our 2021 market roundup summarises another strong year for markets in almost all asset classes except for Bonds which remain under pressure as interest rates are expected to rise and inflation ticks up. Listed private equity (shares in private equity managers) performed best at +43.08%yy in GBP terms. US was the best performing region at +30.06%. Real asset exposures, such as Water, Commodities and Timber continued to rally in face of rising inflation risk, returning +32.81%, +28.22% and +17.66% respectively. 2022 outlook We are continuing in this “curiouser, through-the-looking glass” world. Traditionally you bought bonds for income, and equity for risk. Now it’s the other way round. Only equities provide income yields that have the potential to keep ahead of inflation. Bonds carry increasing risk of loss in real terms as inflation and interest rates rise. Real yields, which are bond yields less the inflation rate, are negative making traditional Bonds which aren’t linked to inflation highly unattractive. Bonds that are linked to inflation are highly sensitive to rising interest rates (called duration risk), so are not attractive either. How to navigate markets in this context? The big three themes for the year ahead are, in our view:
See full report in pdf Attend our 2022 Outlook webinar 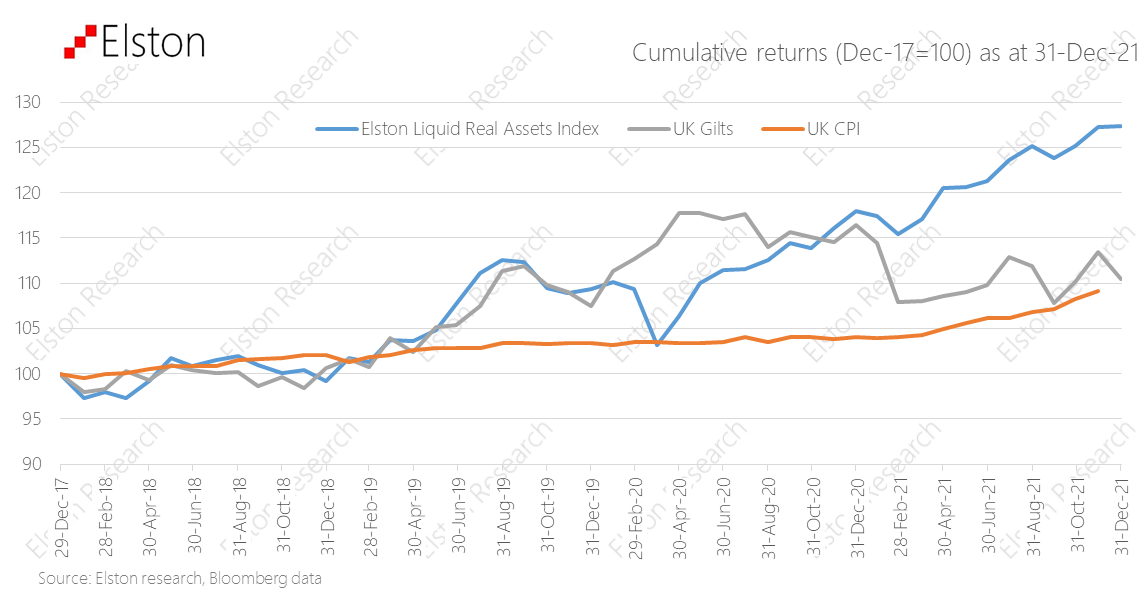 [3 min read, open pdf for full report with charts]
Inflation on the rise With inflation on the rise – and potentially interest rates too – nominal bonds are likely to remain under pressure. Whilst “real assets” – such as property, infrastructure and gold – have potential to preserve value in inflationary regimes, how can a switch from bonds to real assets be made without materially up-risking portfolios? This was the challenge we addressed in the design of our Liquid Real Assets index. Our Liquid Real Assets Index was developed to combine exposure to higher risk-return real asset exposures, with lower risk-return interest rate-sensitive assets, to deliver a real asset return exposure for inflation protection, in liquid format, with bond-like volatility to keep risk budgets in check. Given the rising inflationary pressures both in the US and in the UK, we take stock on the index performance year-to-date and are glad to say it’s “doing what it says on the tin. Find out more about the Elston Liquid Real Assets Index Watch the introductory webinar View the year-end index factsheet 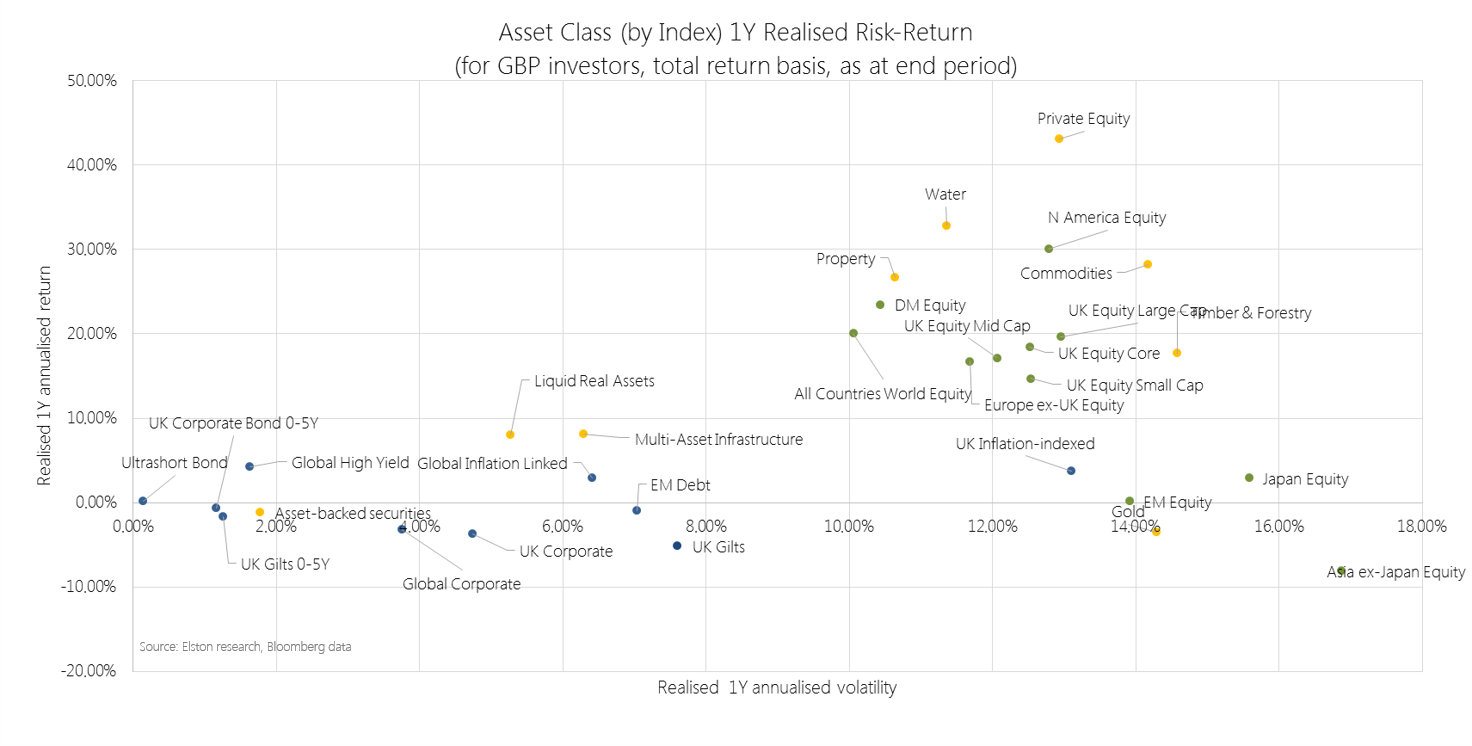 [3 min read, open as pdf]
Sustained recovery in risk assets 2021 saw a sustained recovery in risk assets, with the exception of Emerging Markets. Listed Private Equity was the top performing exposure returning +43.08% in GBP terms. Regionally, US equities remained the strongest performing market +30.06%. Real assets to the fore Real asset exposures, such as Water, Commodities and Timber continued to rally in face of rising inflation risk, returning +32.81%, +28.22% and +17.66% respectively. Our Liquid Real Assets Index (ticker ELSLRA Index) – which combines higher risk real assets and lower risk rate-sensitive assets to deliver volatility similar to bonds – returned +7.98%, whilst UK Gilts declined -5.16%. UK equity income strength Within UK equity market segments, UK Equity Income outperformed all other segments as inflation fears made income-generative, value-oriented shares relatively more attractive. UK Equity Income, represented by our Freedom Smart Beta UK Dividend Index (ticker ELSUKI Index), returned +20.77%, whilst UK Large Cap returned +19.68% and UK Core returned +18.44%. UK Small Cap was the weakest UK segment, returning +14.70% for the year. Read as pdf Register for our Quarterly Investment Outlook on 26 January 2022 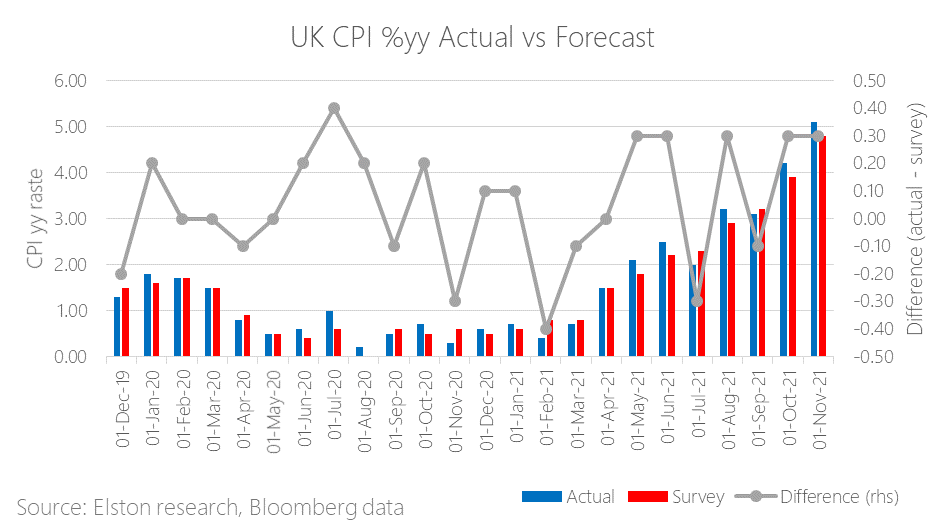 [7 min read, open as pdf]
Fed signals tightening Fed Chairman Jerome Powell signalled that inflation is now the biggest risk to growth, and getting the labour market back to pre-pandemic levels. The US will accelerate “tapering” or reduction of supportive asset purchases, and set out the potential for rate hikes in coming years (although no change in long-term target rate). And despite rate hikes usually spooking markets, markets rallied: why? Because the bigger concern was that the Fed was behind the curve and not getting on top of inflation. The risk of a so-called “policy error” had investors concerned. The fact that market-implied policy rates did not change before and after the policy announcement, suggests that this was a case of the Fed catching up with the market, than the market catching up with the Fed. UK inflation Meanwhile, UK inflation pressure continues, with November inflation data coming in at +5.1%yy, ahead of +4.8%yy forecast, the fastest rate in a decade. Transport, clothing and food were the main contributors. The risk is that inflation creeps into wage growth which would make it harder to bring inflation down to long-term target of 2.0%. This is the second month in a row of an upside surprise. The figure is also at the upper end of scenarios envisaged by the Bank of England at the November MPC meeting. Bank of England raises rates The Bank of England today announced a +0.15% increase in the Bank Rate from 0.10% to 0.25% citing “more persistent” inflation, and following the Fed’s lead in a greater level of tightening. Furthermore, the Bank of England minutes suggest that inflation could remain at elevated levels and “expect inflation to remain around 5% through the majority of the winter period, and to peak at around 6% in April 2022” Markets are pricing a 80% chance of a further +0.25% to 0.50% in February 2022. In October, BoE Governor, Andrew Bailey guided that rates would need to rise to address inflation. Where are breakeven rates? The UK 5 year breakeven rate is at 4.38%, following the announcement, compared to 4.66% at the end of last week. The US 5 year breakeven rate is at 2.73% today from 2.80% at the end of last week. Liquid Real Assets performance Our Liquid Real Assets Index combines exposure to higher risk-return real assets for inflation protection and lower risk-return rate-sensitive assets for interest rate hike protection for an overall volatility that is comparable to UK bonds. By incorporating allocations to exposures that are driving inflation, such as Commodities, or can pass-through inflation, such as Property and Infrastructure, the real assets index can provide a return premium in excess of inflation and in excess of nominal bonds. Summary Inflation is proving persistent, policy makers are catching up to keep it in check. Nominal bonds will remain under pressure, particularly longer-duration in a rising inflation, rising interest rate environment. We advocate pairing equity allocations with diversified real asset exposure that can respond to inflation and floating rate notes that can respond to interest rate hikes. Read full article with charts as pdf Register for our Quarterly Investment Outlook on 26 January 2022 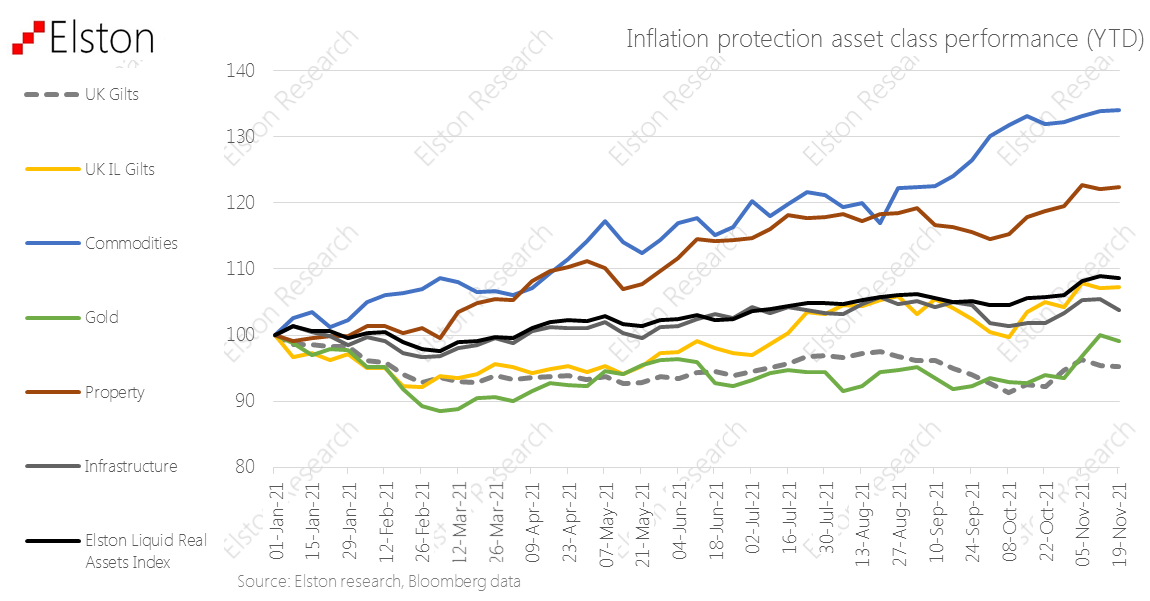
Inflation on the rise With inflation on the rise – and potentially interest rates too – nominal bonds are likely to remain under pressure. Whilst “real assets” – such as property, infrastructure and gold – have potential to preserve value in inflationary regimes, how can a switch from bonds to real assets be made without materially up-risking portfolios? This was the challenge we addressed in the design of our Liquid Real Assets index. Our Liquid Real Assets Index was developed to combine exposure to higher risk-return real asset exposures, with lower risk-return interest rate-sensitive assets, to deliver a real asset return exposure for inflation protection, in liquid format, with bond-like volatility to keep risk budgets in check. Given the rising inflationary pressures both in the US (where in Oct-21 it crossed 6%, the highest level in 30 years) and in the UK (where in Oct-21 it crossed 4%, the highest level in a decade), we take stock on the index performance year-to-date and are glad to say it’s “doing what it says on the tin. [Read full article] [Watch the webinar]  [3 min read, open as pdf]
Ahead of estimates UK CPI print for October came in at 4.2%yy vs 3.9% estimate and 3.1%yy in September. Inflation rates were higher than expected and the highest in a decade, putting more pressure on the Bank of England to raise interest rates and creating a palpable squeeze on cost of living for households through the winter. The increase was driven by energy prices and the impact of supply shortages across the economy. 
Read the article in full (5 min read) Following the post-COVID restart, there would necessarily be an inflationary spike, from base effects alone. Central Banks’ core thesis was that this spike would be “transitory”, rather than “persistent”. However, the combination of pent-up demand, supply chain disruptions and an energy crisis suggests that inflation could prove more persistent than transitory. We look at the numbers and how this informs the “big picture triangle” of three key macro factors: growth, inflation and interest rates. Finally, we outlined potential interventions in portfolio positioning from an asset allocation perspective. Nominal bonds are known to be structurally challenged in an inflationary regime, and propose real asset exposure instead. Within equities, we would propose an income/value bias. Regiser for our 3q21 Review & Outlook: The Big Squeeze  [3 min read, open as pdf]
US inflation moderates US CPI moderated from +5.4% to +5.3% y/y, whilst Core PCI (excluding energy and food) moderated from +4.3%yy to +4.0%yy. Full article in pdf 
Last week, the US Senate passed a $1.2trillion infrastructure bill that now awaits a House vote as part of the "build back better" campaign, and another part of the "bazooka" post-COVID policy stimulus. Whilst there are plenty of infrastructure equity funds like INFR (iShares Global Infrastructure UCITS ETF) and WUTI (SPDR® MSCI World Utilities UCITS ETF) that benefit from infrastructure spend, for those not wanting to uprisk portfolio, we like GIN (SPDR® Morningstar Multi-Asset Global Infrastructure UCITS ETF) which invests in infrastructure equity and debt securities. Infrastructure & Utilities forms a core part of our Liquid Real Assets Index, for the inflation-protective qualities (tariff formulae typically pass through inflation). The "hybrid" nature of infrastructure - with both equity and bond like components is why we place it firmly in the Alternative Assets category. Helpfully this can be accessed in a highly iquid and (relatively) low-cost format, compared to higher cost, less transparent and potentially less liquid infrastructure funds. 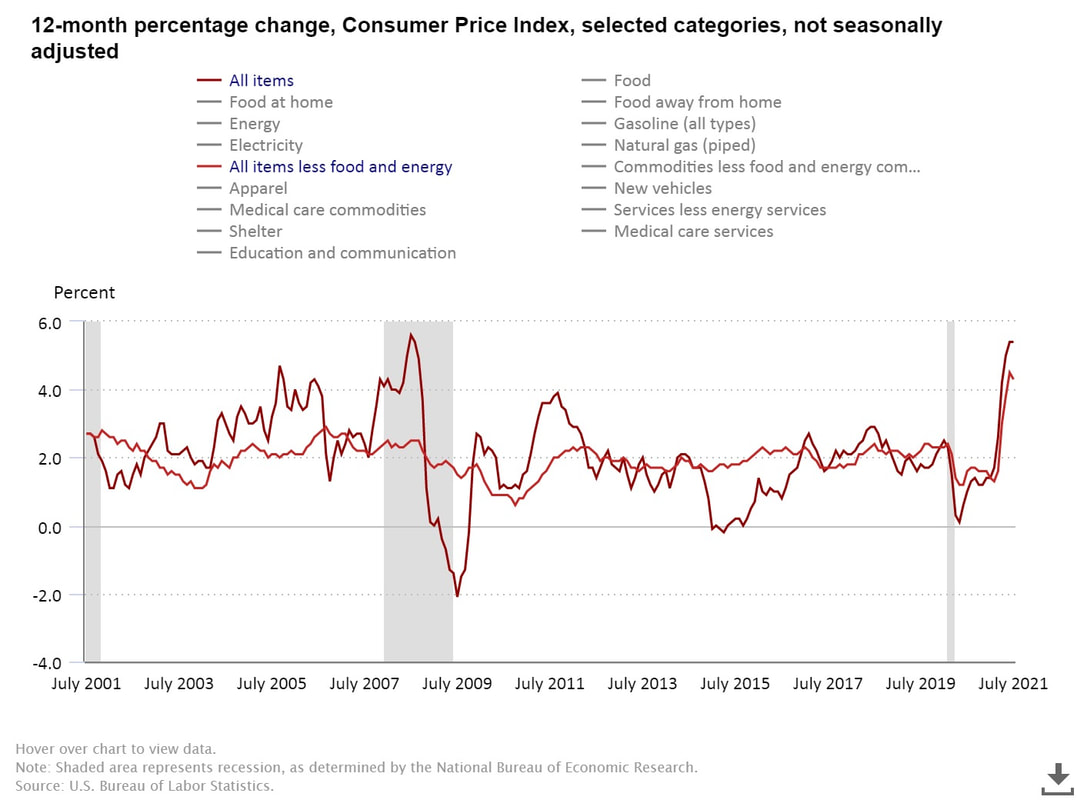
US inflation at highest level in 13 years running at +5.4%yy for second month, Core inflation (excl energy) +4.3%yy (Jul) from +4.5% (Jun). With a slight moderation in core inflation, economists are calling this as the inflation "peak". Whilst this may represent "peak inflation" year over year, overall inflation levels will remain elevated on restart and supply chain constraints As explored in our recent article on “catch-up” rates, we believe Fed policy will remain accommodative, with interest rates "lower for longer", as it lets inflation run "hotter for longer". This is positive for risk assets that offer inflation protection In inflationary regime we favour value-bias equities and real assets for diversification. 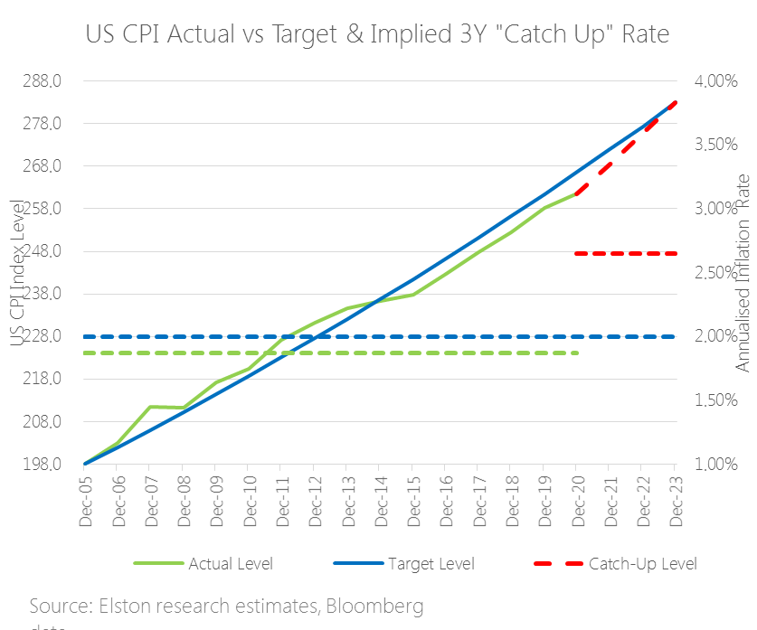 [3 min read, open as pdf]
The inflation theme is resonating in US earnings calls with company CEOs seeing this "temporary regime" lasting longer into 2022. In terms of prints, June CPI in the US was +5.4% and core CPI +4.5% - the highest print since November 1991. Markets have been caught between a push-pull between inflation data and interest rate policy response. Concerns that inflation is more persistent than transitory is driving flows to “risk on” assets. Related concerns that the Fed might start tightening policy earlier and sharper has been the “risk off” trade. Looking at inflation “catch-up” rates suggests that the Fed might let inflation run hotter for longer, pointing to a later lift off in rates from current low interest rates. This would be supportive for risk assets. What are “catch-up” rates? In 2020 ahead of the annual Jackson Hole conference the Fed indicated that it would take a more accommodative approach to inflation crossing the 2% target threshold. Why is this? Part of the answer is the concept of “catch up” rates. Essentially this means that a rate above 2% temporarily is ok if it means we are getting back to a 2% long-term trend-line. Effectively, letting inflation run hot and overshoot target in the short-term can make up for system slack/undershoots in prior years. What are the reference points? We don’t’ know the reference points (basis, trend-lines or catch-up period) the Fed will be using in its Policy decisions. So to illustrate this concept of “catch up rates”, we created an example with cumulative inflation (left hand scale) and average inflation rates (right hand scale). Our methodology We took December 2005 as a base, applied a cumulative 2% target inflation path (in blue), and then plotted cumulative path based on actual inflation rate (in green, averaging (dotted green line) 1.87%p.a. to June 2020 – i.e. below target rate). The red dashed line is the implied path back to trend-line assuming a “catch-up rate” of 2.65%p.a. (red-dotted line) that it would take for inflation to get back to the original trendline over 3 years. The catch up rate would be higher if using a shorter time-frame, and lower if using a longer-time frame. Conclusion Looking at implied three year “catch-up” rate helpso illustrate the concept and explains why Fed might let inflation run hotter for longer, pointing to a later lift off in rates. In inflationary regime we favour value-bias equities and real assets for diversification. Find out more in our quarterly review and outlook.  In this white paper, we revisit the core principles of inflation
[15 min read, open as pdf] 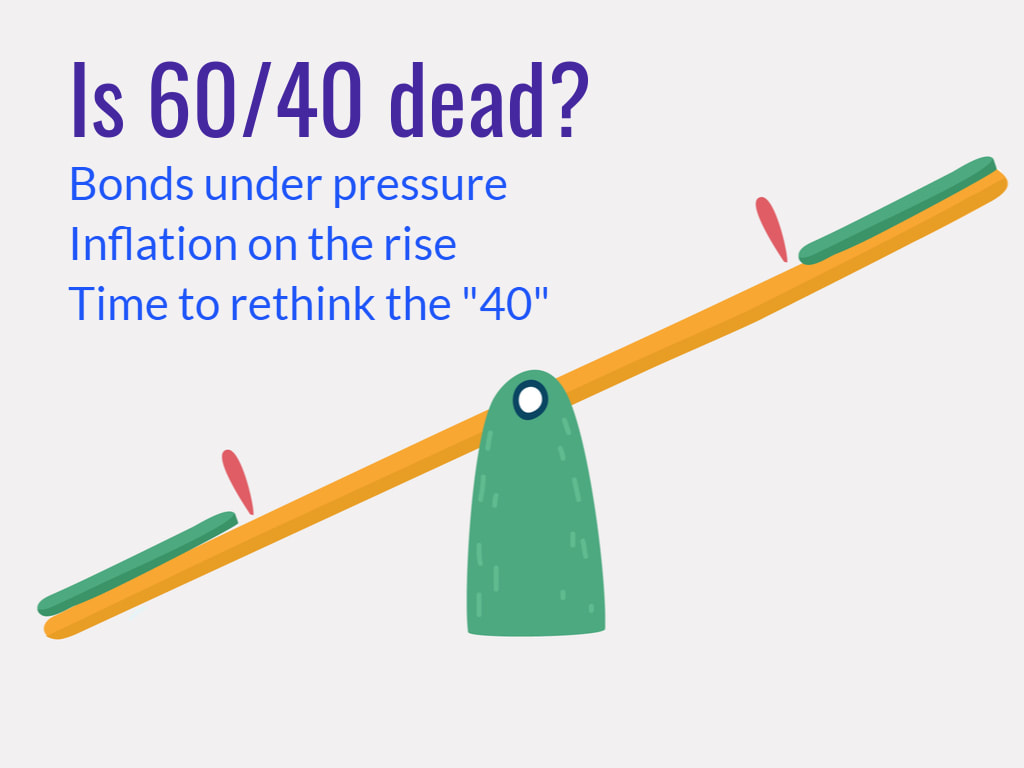 [ 5 min read, open as pdf]
Since an article published in 2019 pointed the historic lows in bond yields, many investment firms are starting to rethink the 60/40 portfolio. This came under even more scrutiny following the market turmoil of 2020. While some affirm that the 60/40 will outlive us all, others argue against this notion. We take a look at the main arguments for and against and key insights What is a 60/40 portfolio? A 60/40 equity/bond portfolio is a heuristic “rule of thumb” approach considered to be a proxy for the optimal allocation between equities and bonds. Conventionally equities were for growth and bonds were for ballast. The composition of a 60/40 portfolio might vary depending on the base currency and opportunity set of the investor/manager. Defining terms is therefore key. We summarise a range of potential definitions of terms: 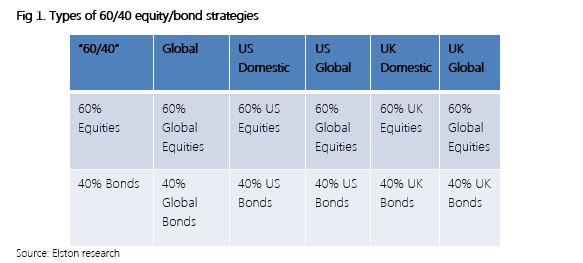 Furthermore, whilst 60/40 seems simple in terms of asset weighting scheme, it is important to understand the inherent risk characteristics that this simple allocation creates. For example, a UK Global 60/40 portfolio has 62% beta to Global Equities; equities contribute approximately 84% of total risk, and a 60/40 portfolio is approximately 98% correlated to Global Equities[1]. [1] Elston research, Bloomberg data. Risk Contribution based on Elston 60/40 GBP Index weighted average contribution to summed 1 Year Value At Risk 95% Confidence as at Dec-20. Beta Correlation to Global Equities based on 5 year correlation of Elston 60/40 GBP Index to global equity index as at Dec-20. 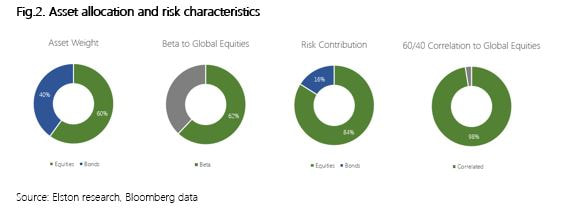 Why some think 60/40 will outlive us all. The relevance of 60/40 portfolio lies in its established historic, mathematical and academic backup. Whilst past performances do not guarantee future returns, it nonetheless provides us with experience and guidance. (Martin,2019) Research also suggests that straightforward heuristic or “rule-of-thumb” strategies work well because they aren’t likely to inspire greed or fear in investors. They become timeless. Thus, creating a ‘Mind-Gap’. (Martin,2019) In the US, the Vanguard Balanced Index Fund (Ticker: VBINX US) which combines US Total Market Index and 40% into US Aggregate bonds, plays a major role in showcasing the success of the 60/40 portfolio that has proved popular with US retail investors (Jaffe,2019). Similarly, in the UK the popularity of Vanguard LifeStrategy 60% (Ticker VGLS60A) showcases the merits of a straightforward 60/40 equity/bond approach. In 2020, for US investors VBINX provided greater (peak-to-trough) downside protection owing to lower beta (-19.5% vs -30.3% for US equity) and delivered total return of +16.26% volatility of 20.79%, compared to +18.37% for an ETF tracking the S&P 500 with volatility of 33.91%, both funds are net of fees. In this respect, the strategy captured 89% of market returns, with 61% of market risk. 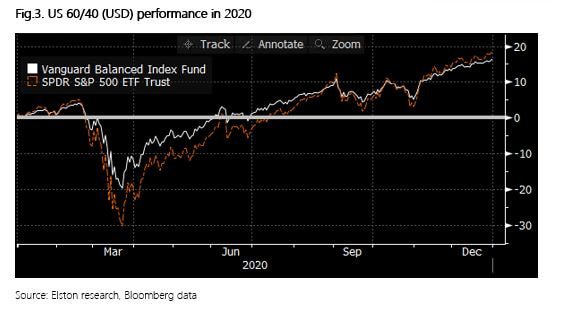 For GBP-based investors in 2020 the 60/40 approach had lower (peak-to-trough) drawdown levels (-15%, vs -21% for global equities) owing to lower beta. The 60% equity fund delivered total return of +7.84% with volatility of 15.12%, compared to +12.15% for an ETF tracking the FTSE All World Index with volatility of 24.29%. In this respect, the strategy captured 65% of market returns, with 62% of market risk. 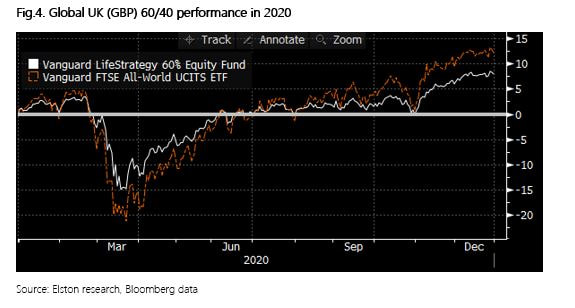 Why some think 60/40 has neared its end
Since its inception the 60/40 portfolio, derived 90% of the risk from stocks. In simple terms, 60% of the asset allocation of the portfolio was therefore the main driver of the portfolio. Returns (Robertson,2021). This hardly a surprise given that equities have a 84% contribution to portfolio ris, on our analysis, but the challenge made by some researchers is that if a 60/40 portfolio mainly reflects equity risk, what role does the 40% bond allocation provide, other than beta reduction? The bond allocation is under increasing scrutiny now is because global economic growth has slowed and traditionally safer asset classes like bonds have grown in popularity making bonds susceptible to sharp and sudden selloffs. (Matthews,2019) Strategists such as for Woodard and Harris, for Bank of America and Bob Rice for Tangent Capital have stated in their analysis that the core premise of the 60/40 portfolio has declined as equity has provided income, and bonds total return, rather than the other way round.. (Browne,2020) Another study shows that over the past 65 years bonds can no longer effectively hedge against inflation and risk reduction through diversification can be done more adequately by exploring alternatives such as private equity, venture capital etc. (Toschi, 2021). Left unconstrained, however, this can necessarily up-risk portfolios. With bond yields at an all-time low, nearing zero and the fact that they can no longer provide the protection in the up-and-coming markets many investors query the value provided by a bond allocation within a portfolio. (Robertson,2021) Key insights While point of views might differ about 60/40 as an investment strategy, one aspect that is accepted is that the future of asset allocation looks very different when compared to the recent past. Rising correlations, low yields have led strategists and investors to incorporate smarter ways of risk management, explore new bond markets like China, create modified opportunities for bonds to hedge volatility through risk parity strategies, as well as using real asset exposure such as real estate and infrastructure. (Toschi, 2021) Research conducted by The MAN Institute summarises that modifying from traditional to a more trend-following approach introduces the initial layer of active risk management. By adding an element of market timing investors further reduce the risk, when a market’s price declines. While bonds have declined in yield, they still hold importance in asset allocation for beta reduction. Further diversifying the portfolio with an allocation to real assets has potential to provide more yield and increased return than government bonds. Summary The 60/40 portfolio strategy has established itself over many decades, it has seen investors through four major wars, 14 recessions, 11 bear markets, and 113 rolling interest rate spikes. It has proved resilience as a strategy and utility as a benchmark. Our conclusion is that 60/40 is not dead: it is a useful multi-asset benchmark and remains a starting point for strategic asset allocation strategies. But the detail of the bond allocation needs a rethink. Incorporating alternative assets or strategies so long as any increased risk can be constrained to ensure comparable portfolio risk characteristics. Henry Cobbe & Aayushi Srivastava Elston Consulting Bibliography Browne, E., 2021. The 60/40 Portfolio Is Alive and Well. [online] Pacific Investment Management Company LLC. Available at: https://www.pimco.co.uk/en-gb/insights/blog/the-60-40-portfolio-is-alive-and-well Jaffe, C., 2019. No sale: Don’t buy in to ‘the end’ of 60/40 investing. [online] Seattle Times. Available at: https://www.seattletimes.com/business/no-sale-dont-buy-in-to-the-end-of-60-40-investing/ Martin, A., 2019. The 60/40 Portfolio Will Outlive Us All. [online] Advisorperspectives.com. Available at:https://www.advisorperspectives.com/articles/2019/11/11/the-60-40-portfolio-will-outlive-us-all#:~:text=As%20two%20recent%20commentaries%20demonstrate,40%20will%20outlive%20us%20all. Matthews, C., 2021. Bank of America declares ‘the end of the 60-40’ standard portfolio. [online] MarketWatch. Available at:https://www.marketwatch.com/story/bank-of-america-declares-the-end-of-the-60-40-standard-portfolio-2019-10-15 Robertson, G., 2021. 60/40 in 2020 Vision | Man Institute. [online] www.man.com/maninstitute. Available at:https://www.man.com/maninstitute/60-40-in-2020-vision Toschi, M., 2021. Why and how to re-think the 60:40 portfolio | J.P. Morgan Asset Management. [online] Am.jpmorgan.com. Available at: https://am.jpmorgan.com/be/en/asset-management/adv/insights/market-insights/on-the-minds-of-investors/rethinking-the-60-40-portfolio/  [3 min read, open as pdf] Inflation is on the rise Easy central bank money, pent up demand after lockdowns and supply-chain constraints mean inflation is on the rise. Will Central Banks be able to keep the lid on inflation? The risk is that it could persistently overshoot target levels. 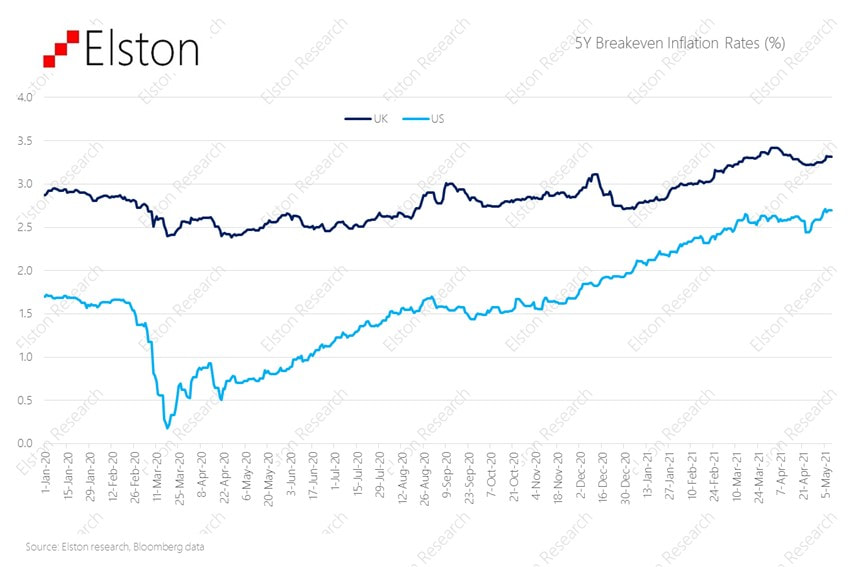 It matters more over time Inflation erodes the real value of money: its “purchasing power”. If inflation was on target (2%), £100,000 in 10 year’s time would be worth only £82,035 in today’s money. But on current expectations, it could be worth a lot less than that. 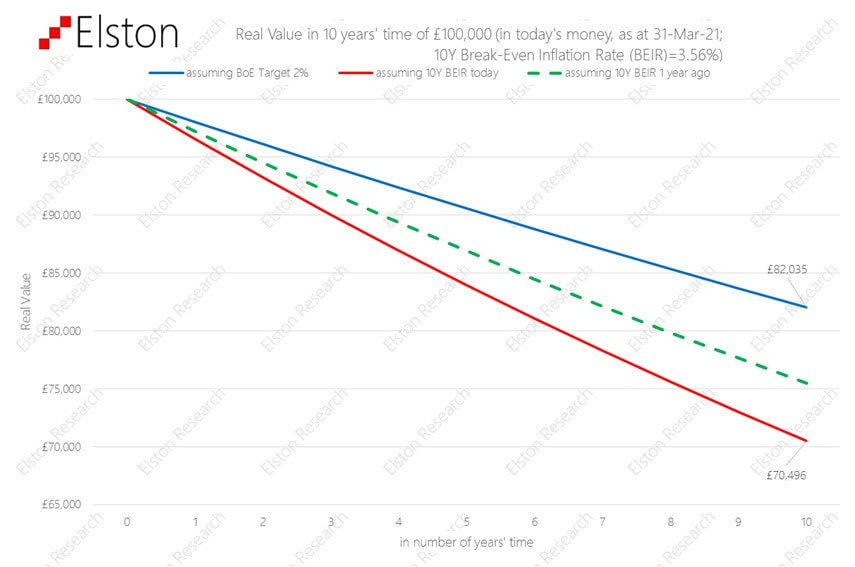 Real assets can help
A bank note is only as valuable as the value printed on it. This is called its “nominal value”. Remember the days when a £5 note went a long way? When inflation rises, money loses its real value. By contrast, real assets are things that have a real intrinsic value over time whose value is set by supply, demand and needs: like copper, timber, gold, oil, and wheat. Real assets can also mean things that produce an regular income which goes up with inflation, like infrastructure companies (pipelines, toll roads, national grid etc) and commercial property with inflation-linked rents. Rethinking portfolio construction Including “real assets” into the mix can help diversify a portfolio, and protect it from inflation. Obviously there are no guarantees it will do so perfectly, but it can be done as a measured approach to help mitigate the effects of inflation. The challenge is how to do this without taking on too much risk. Find out more about our Liquid Real Assets Index  [5min read, open as pdf]
We agree it’s time to rethink the 60/40 portfolio. It’s a useful benchmark, but a problematic strategy. What is the 60/40 portfolio, and why does it matter? What it represents? Trying to find the very first mention of a 60/40 portfolio is proving a challenge, but it links back to Markowitz Modern Portfolio Theory and was for many years seen as close to the optimal allocation between [US] equities and [US] bonds. Harry Markowitz himself when considering a “heuristic” rule of thumb talked of a 50/50 portfolio. But the notional 60/40 equity/bond portfolio has been a long-standing proxy for a balanced mandate, combining higher-risk return growth assets with lower-risk-return, income generating assets. What’s in a 60/40? Obviously the nature of the equity and the nature of the bonds depends on the investor. US investor look at 60% US equities/40% US treasuries. Global investors might look at 60% Global Equities/40% Global Bonds. For UK investors – and our Elston 60/40 GBP Index – we look at 60% predominantly Global Equities and 40% predominantly UK bonds Why does it matter? In the same way as a Global Equities index is a useful benchmark for a “do-nothing” stock picker, the 60/40 portfolio is a useful benchmark for a “do-nothing” multi-asset investor. Multi-asset investors, with all their detailed decision making around asset allocation, risk management, hedging overlays and implementation options either do better than, or worse than this straightforward “do-nothing” approach of a regularly rebalanced 60/40 portfolio. Indeed – its simplicity is part of its appeal that enables investors to access a simple multi-asset strategy at low cost. The problem with Bonds in a 60/40 framework In October 2019, Bank of America Merrill Lynch published a research paper “The End of 60/40” which argues that “the relationship between asset classes has changed so much that many investors now buy equities not for future growth but for current income, and buy bonds to participate in price rallies”. This has prompted a flurry of opinions on whether or not 60/40 is still a valid strategy The key challenges with a 60/40 portfolio approach is more on the bond side:
So is 60/40 really dead? In short, as a benchmark no. As a strategy – we would argue that for serious investors, it never was one. We therefore think it’s important to distinguish between 60/40 as an investment strategy and 60/40 as a benchmark. We think that a vanilla 60/40 equity/bond portfolio remains useful as a benchmark to represent the “do nothing” multi-asset approach. However, we would concur that a vanilla 60/40 equity/bond portfolio, as a strategy offered by some low cost providers does – at this time – face the significant challenges identified in the 2019 report, that have been vindicated in 2020 and 2021. For example, during the peak of the COVID market crisis in March 2020, correlations between equities and bonds spiked upwards meaning there was “no place to hide”. The growing inflation risk has put additional pressure on nominal bonds. Real yields are negative. Interest rates won’t go lower. But outside of some low-cost retail products, very few portfolio managers, would offer a vanilla equity/bond portfolio as a client strategy. The inclusion of alternatives have always had an important role to play as diversifiers. Rethinking the 40%: What are the alternatives? When it comes to rethinking the 60/40 portfolio, investors will have a certain level of risk budget. So if that risk budget is to be maintained, there is little change to the “60% equity” part of a 60/40 portfolio. What about the 40%? We see opportunity for rethinking the 40% bond allocation by: We nonetheless think it is important to:
1. Rethinking the bond portfolio Whilst more extreme advocates of the death of 60/40 would push for removing bonds entirely, we would not concur. Bonds have a role to play for portfolio resilience in terms of their portfolio function (liquidity, volatility dampener), so would instead focus on a more nuanced approach between yield & duration. We would concur that long-dated nominal bonds look problematic, so would suggest a more “barbell” approach between shorter-dated bonds (as volatility dampener), and targeted, diversified bond exposures: emerging markets, high yield, inflation-linked (for diversification and real yield pick-up). 2. Incorporating sensible alternative assets Allocating a portfolio of the bond portfolio to alternatives makes sense, but we also need to consider what kind of alternatives. Whilst some managers are making the case for hedge funds or private markets as an alternative to bonds, we think there are sensible cost-efficient and liquid alternatives that can be considered for inclusion that either have bond-like characteristics (regular stable income streams), or provide inflation protection (real assets). For regular diversified income and inflation protection, we would consider: asset-backed securities, infrastructure, utilities and property. The challenge, however, is how to incorporate these asset classes without materially up-risking the overall portfolio. For inflation protection, we would consider real assets: property, diversified, commodities, gold and inflation-protected bonds. Properly incorporated these can fulfil a portfolio function that bonds traditionally provided (liquidity, income, ballast and diversification). 3. Consider risk-based diversification as an alternative strategy One of the key reasons for including bonds in a multi-asset portfolio is for diversification purposes from equities on the basis that one zigs when the other zags. In the short-term, and particularly at times of market stress, correlations between asset classes can increase, this reduces the diversification effect if bonds zag when equities zag. We would argue risk-based diversification strategies have a role to play to here, on the basis that rather than relying on long-run theoretical correlation, they systematically focus on short-run actual correlation between asset classes and adapt their asset allocation accordingly. Traditional portfolios means choosing asset weights which then drive portfolio risk and correlation metrics. Risk-based diversification strategies do this in reverse: they use short-run portfolio risk and correlation metrics to drive asset weights. If the ambition is to diversify and decorrelate, using a strategy that has this as its objective makes more sense. Summary So 60/40 is not dead. It will remain a useful benchmark for mult-asset investors. As an investment strategy, vanilla 60/40 equity/bond products will continue to attract assets for their inherent simplicity. But we do believe a careful rethink of the “40” is required.  [5 min read, open as pdf]
Commodity indices, and the ETPs that track them provide a convenient way of accessing a broad commodity basket exposure with a single trade. What’s inside the basket? Commodity indices represent baskets of commodities constructed using futures prices. The Bloomberg Commodity Index which was launched in 1998 as the Dow Jones-AIG Commodity Index has a weighting scheme is based on target weights for each commodity exposure. These weights are subject to the index methodology rules that incorporate both liquidity (relative amount of trading activity of a particular commodity) and production data (actual production data in USD terms of a particular commodity) to reflect economic significance. The index subdivides commodities into “Groups”, such as: Energy (WTI Crude Oil, Natural Gas etc), Grains (Corn, Soybeans etc), Industrial Metals (Copper, Aluminium etc), Precious Metals (Gold, Silver), Softs (Sugar, Coffee, Cotton) and Livestock (Live Cattle, Lean Hogs). The index rules include diversification requirements such that no commodity group constitutes more than 33% weight in the index; no single commodity (together with its derivatives) may constitute over 25% weight); and no single commodity may constitute over 15% weight. The target weights for 2021 at Group and Commodity level is presented below: 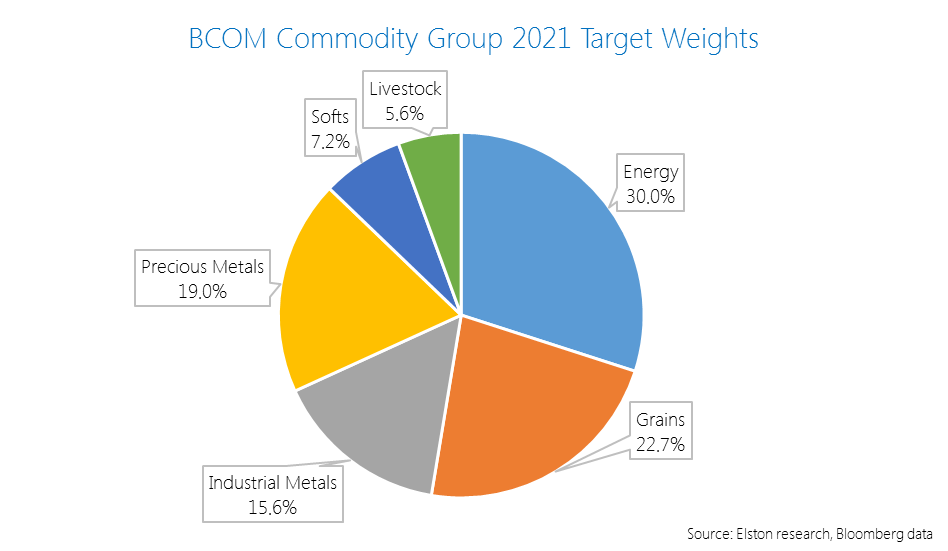 Owing to changes in production and or liquidity, annual target weights can vary. For example the material change in weight in the 2021 target weights vs the 2020 target weights was a +1.6ppt increase in Precious Metals (to 19.0%) and a -1.9pp decrease in Industrial Metals to 15.6%. Traditional vs “Smart” weighting schemes One of the drawbacks of the traditional production- and liquidity-based weighting scheme is that they are constructed with short-dated futures contracts. This creates a risk when futures contracts are rolled because for commodities where the forward curve is upward sloping (“contango”), the futures price of a commodity is higher than the spot price. Each time a futures contract is rolled, investors are forced to “buy high and sell low”. This is known as “negative roll yield”. A “smart” weighting scheme looks at the commodity basket from a constant maturity perspective, rather than focusing solely on short-dated futures contracts. This approach aims to mitigate the impact of negative roll yield as well as potential for reduced volatility, relative to traditional indices. This Constant Maturity Commodity Index methodology was pioneered by UBS in 2007 and underpins the UBS Bloomberg BCOM Constant Maturity Commodity Index and products that track it. Illustration of futures rolling for markets in contango 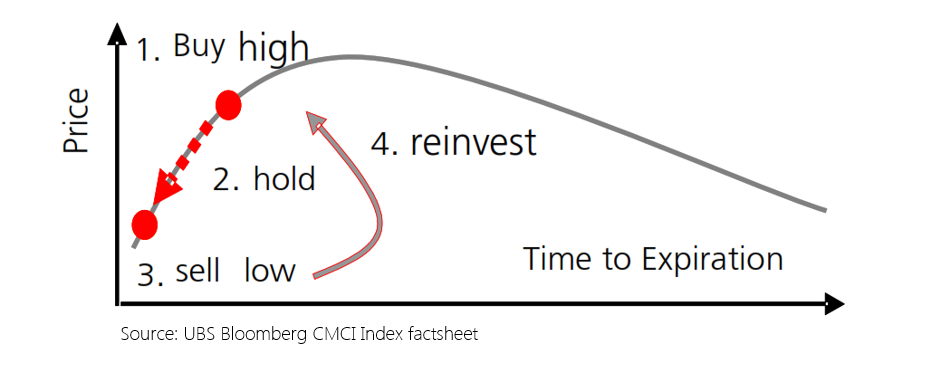 An Equal Weighted approach Whilst the traditional index construction considers economic significance in terms of production and liquidity, investors may seek alternative forms of diversified commodities exposure, such as Equal Weighted approach. There are two ways of achieving this, equal weighting each commodity, or equal weighting each commodity group. The Refinitiv Equal Weight Commodity Index equally weights each if 17 individual commodity components, such that each commodity has a 5.88% (1/17th) weight in the index. This results in an 18% allocation to the Energy Group, 47% allocation to the Agriculture group, 12% allocation to the Livestock group and 23% allocation to Precious & Industrial Metals. An alternative approach is to equally weight each commodity group. This is the approach we take in the Elston Equal Weight Commodity Portfolio, which has a 25% allocation to Energy, a 25% allocation to Precious Metals, a 25% Allocation to Industrial Metals and a 25% Allocation to Agricultural commodities. This is on the basis that commodities components within each group will behave more similarly than commodity components across groups. These two contrasting approaches are summarised below: 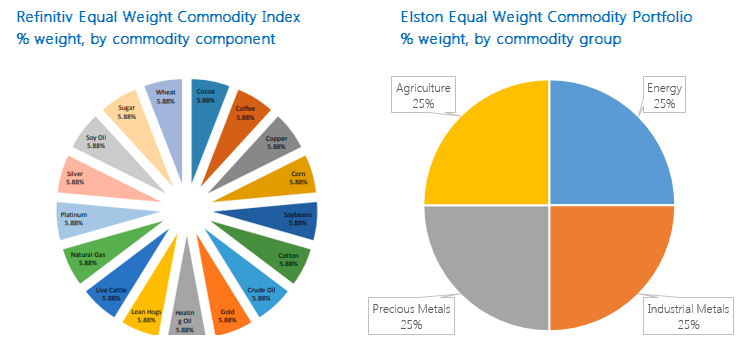 Performance In 2020, the Equal Weight component strategy performed best +6.28%. The Constant Maturity strategy delivered +0.69%. The Equal Weight Group strategy was flat at -0.05% and the traditional index was -5.88%, all expressed in GBP terms. 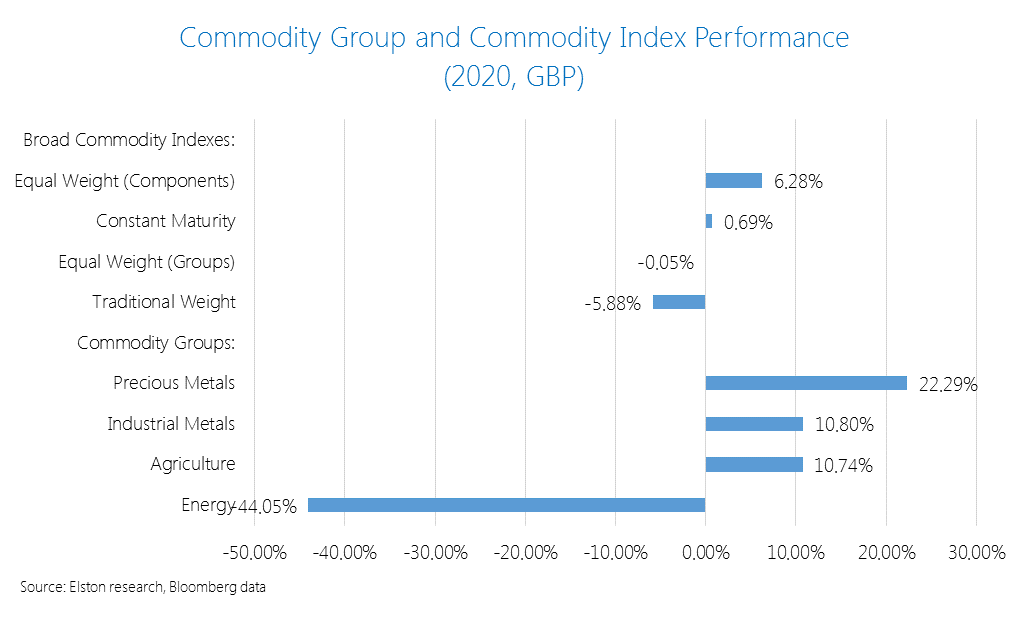 Informed product selection This summarises four different ways of accessing a diversified commodity exposure: traditional weight, constant maturity weighting, equal component weighting and equal group weighting. Understanding the respective strengths and weaknesses of each approach is an important factor for product selection.  [3 min read, open as pdf]
Focus on inflation In our recent Focus on Inflation webinar we cited the study by Briere & Signori (2011) looking at the long run correlations between asset returns and inflation over time. We highlighted the “layered” effect of different inflation protection strategies (1973-1990) with cash (assuming interest rate rises), and commodities providing best near-term protection, inflation linked bonds and real estate providing medium-term protection, and equities providing long-term protections. Nominal bonds were impacted most negatively by inflation. 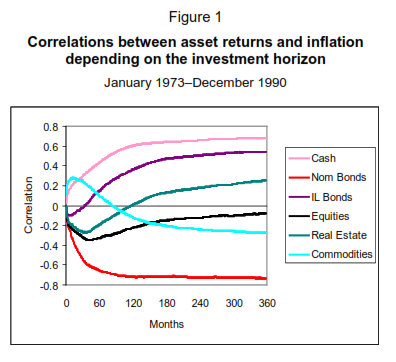 Source: Briere & Signori (2011), BIS Research Papers Given the growing fears of inflation breaking out, we plotted the YTD returns of those “inflation-hedge” asset classes, in GBP terms for UK investors, with reference to the US and UK 5 Year Breakeven Inflation Rates (BEIR). Figure 2: Inflation-hedge asset class performance (GBP, YTD) vs US & UK 5Y BEIR 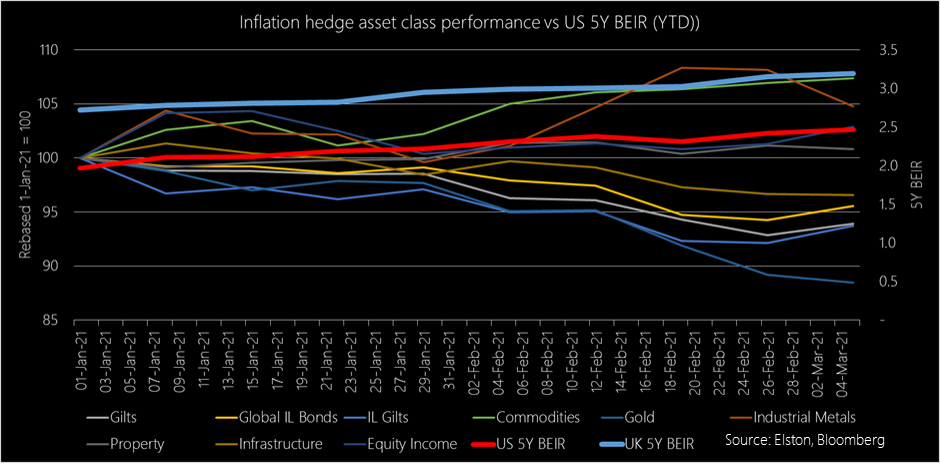 Source: Elston research, Bloomberg data, as at 5th March 2021
Winners and Losers so far We looked at the YTD performance in GBP of the following broad “inflation hedge” asset classes, each represented by a selected ETF: Gilts, Inflation Linked Gilts, Commodities, Gold, Industrial Metals, Global Property, Multi-Asset Infrastructure and Equity Income. Looking at price performance year to date in GBP terms:
So Inflation-Linked Gilts don’t provide inflation protection? Not in the short run, no. UK inflation linked gilts have an effective duration of 22 years, so are highly interest rate sensitive. Fears that inflation pick up could lead to a rise in interest rates therefore reduces the capital value of those bond (offset by greater level of income payments, if held to maturity). So whilst they provide medium- to long-term inflation protection, they are poor protection against a near-term inflation shock. Conclusion In conclusion, we observe:
 [5 minute read, open as pdf] Sign up for our upcoming CPD webinar on Real Assets for diversification
What are “Real Assets”? Real Assets can be defined as “physical assets that have an intrinsic worth due to their substance and property”[1]. Real assets can be taken to include precious metals, commodities, real estate, infrastructure, land, equipment and natural resources. Because of the “inflation-protection” objective of investing in real assets (the rent increases in property, the tariff increases in infrastructure), real asset funds also include exposure to inflation-linked government bonds as a financial proxy for a real asset. Why own Real Assets? There are a number of rationales for investing in Real Assets. The primary ones are to:
Accessing Real Assets Institutional investors can access Real Assets directly and indirectly. They can acquired direct property and participate in the equity or debt financing of infrastructure projects. Directly. For example, the Pensions Infrastructure Platform, established in 2021 has enabled direct investment by pension schemes into UK ferry operators, motorways and hospital construction projects. This provides funding for government-backed project and real asset income and returns for institutional investors. Institutional investors can also access Real Assets indirectly using specialist funds as well as mainstream listed funds such as property securities funds and commodities funds. Retail investors can access Real Assets mostly indirectly through funds. There is a wide range of property funds, infrastructure funds, commodity funds and natural resources funds to choose from. But investors have to decide on an appropriate fund structure.
The rise of real asset funds The first UK diversified real asset fund was launched in 2014, with competitor launches in 2018. There is now approximately £750m invested across the three largest real asset funds available to financial advisers and their clients, with fund OCFs ranging from 0.97% to 1.46%. Following the gating of an Equity fund (Woodford), a bond fund (GAM) and several property funds for liquidity reasons, there has – rightly – been increased focus by the regulator and fund providers (Authorised Corporate Directors or “ACDs”) on the liquidity profile of underlying assets. As a result, given their increased scale, real asset fund managers are increasingly turning to mainstream funds and indeed liquid ETFs to gain access to specific asset classes. Indeed, on our analysis, one real assets funds has the bulk of its assets invested in mainstream funds and ETFs that are available to advisers directly. Now there’s no shame in that – part of the rationale for using a Real Assets fund is to select and combine funds and manage the overall risk of the fund. But what it does mean is that discretionary managers and advisers have the option of creating diversified real asset exposure, using the same or similar underlying holdings, for a fraction of the cost to clients. Creating a liquid real asset index portfolio We have created the Elston Liquid Real Asset index portfolio of ETFs in order to:
We have built the index portfolio using the following building blocks
As regards asset allocation, we are targeting a look-through ~50/50 balance between equity-like securities and bond-like securities to ensure that the strategy provides beta reduction as well as diversification when included in a portfolio. For the index portfolio simulation, we have used an equal weighted approach. Fig.1. Performance of the Liquid Real Asset Index Portfolio (.ELRA) 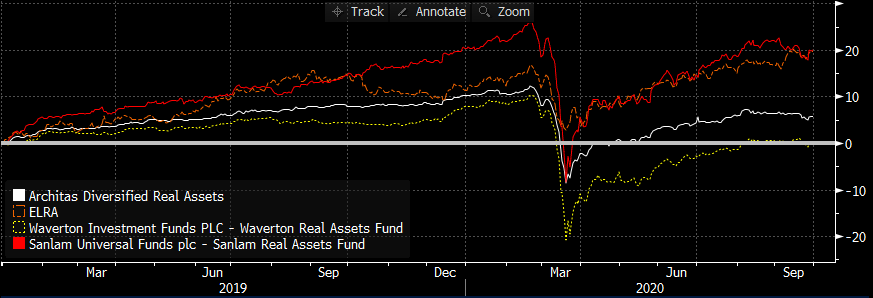 Source: Elston research, Bloomberg data. Total returns from end December 2018 to end September 2020 for selected real asset funds. Since December 2018, the Sanlam Real Assets fund has returned 19.99%, the Elston Real Asset Index Portfolio has returned +19.76%. This compares to +5.86% for the Architas Diversified Real Asset fund and +0.16% for the Waverton Real Assets Fund. What about Beta Our Real Asset Index Portfolio has a Beta of 0.75 to the Elston 60/40 GBP index so represents a greater risk reduction than Waverton (0.86) and Sanlam (0.84), which are all higher beta than Architas (0.53). Fig.2. Real Asset strategies’ beta to a 60/40 GBP Index 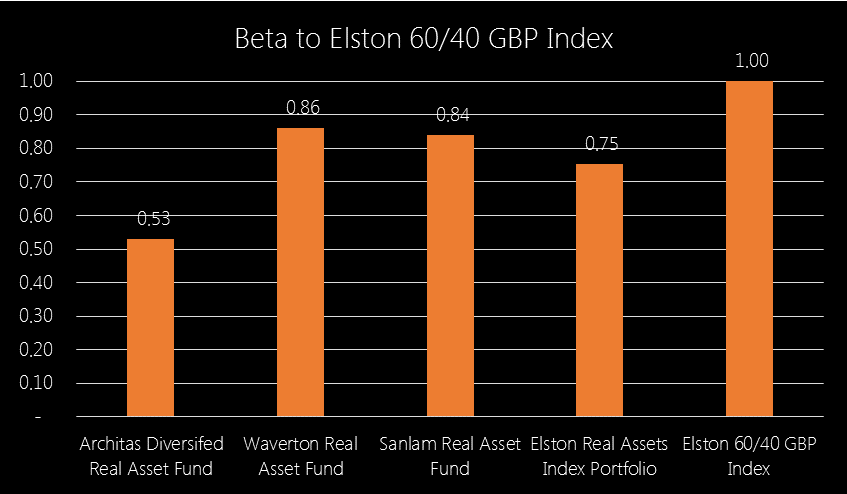 Source: Elston research, Bloomberg data. Weekly data relative to Elston 60/40 GBP Index, GBP terms Dec-18 to Sep-20. Finally, by accessing the real asset ETFs directly, there is no cost for the overall fund structure, hence the implementation cost for an index portfolio of ETFs is substantially lower. Fig.3. Cost comparison of Real Asset funds vs index portfolio of ETFs 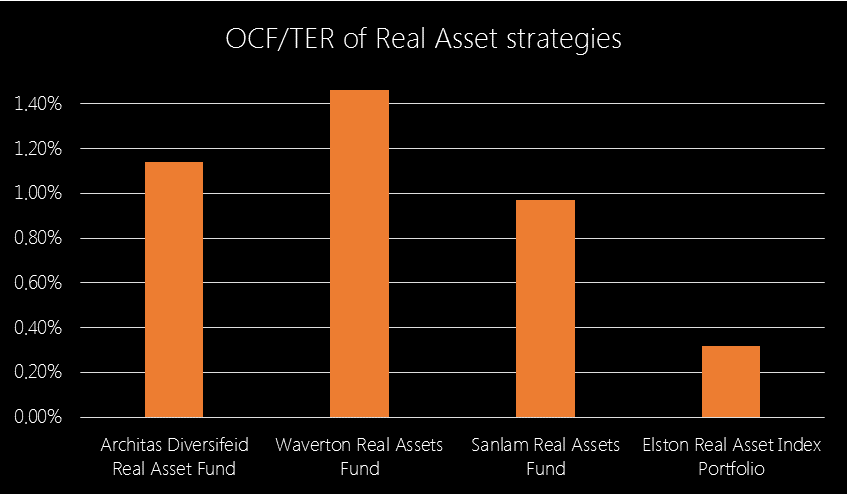 Source: Elston research, Bloomberg data
Fund or ETF Portfolio? The advantage of a funds-based approach is convenience (single-line holding), as well as having a a manager allocate dynamically between the different real asset exposures within the fund. The advantage of an index portfolio is simplicity, transparency and cost. Creating a managed ETF portfolio strategy that dynamically allocates to the different real asset classes over the market cycle is achievable and can be implemented on demand. Summary The purpose of this analysis was to note that:
[1] Source: https://www.investopedia.com/terms/r/realasset.asp |
ELSTON RESEARCHinsights inform solutions Categories
All
Archives
April 2024
|
 RSS Feed
Company |
Solutions |
|